

Long-term recovery behavior of brain tissue in hydrocephalus patients after shunting
- PMID: 36344582
- PMCID: PMC9640582
- DOI: 10.1038/s42003-022-04128-8
Long-term recovery behavior of brain tissue in hydrocephalus patients after shunting
Abstract
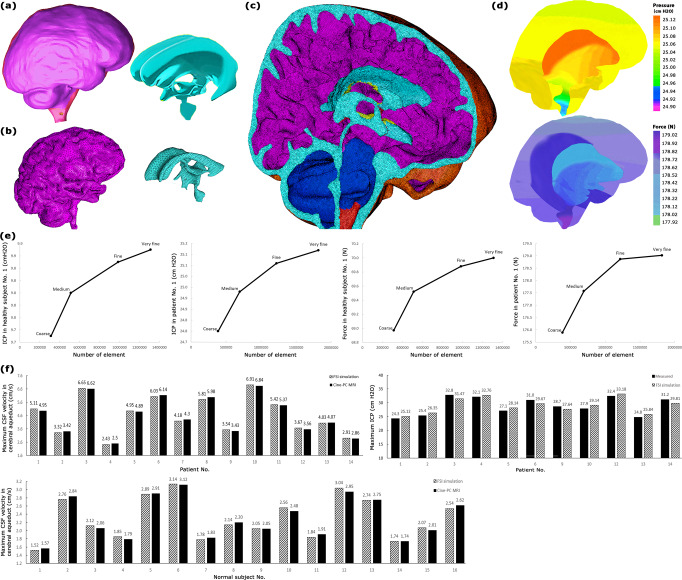
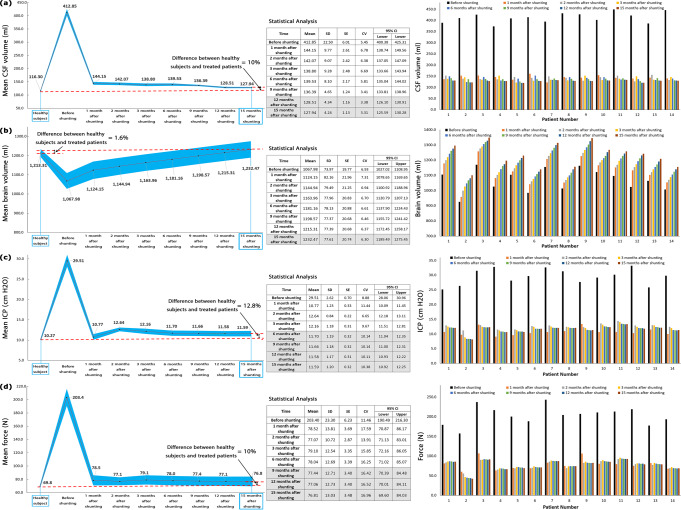
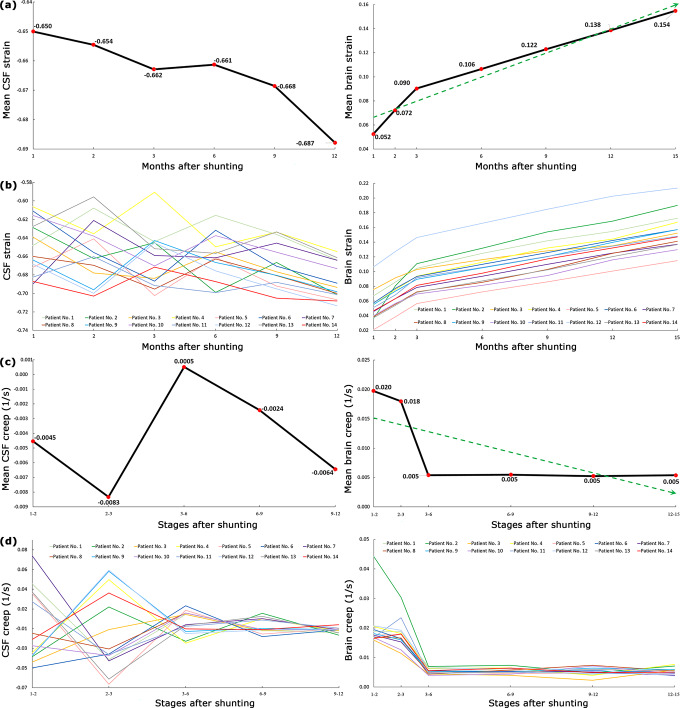
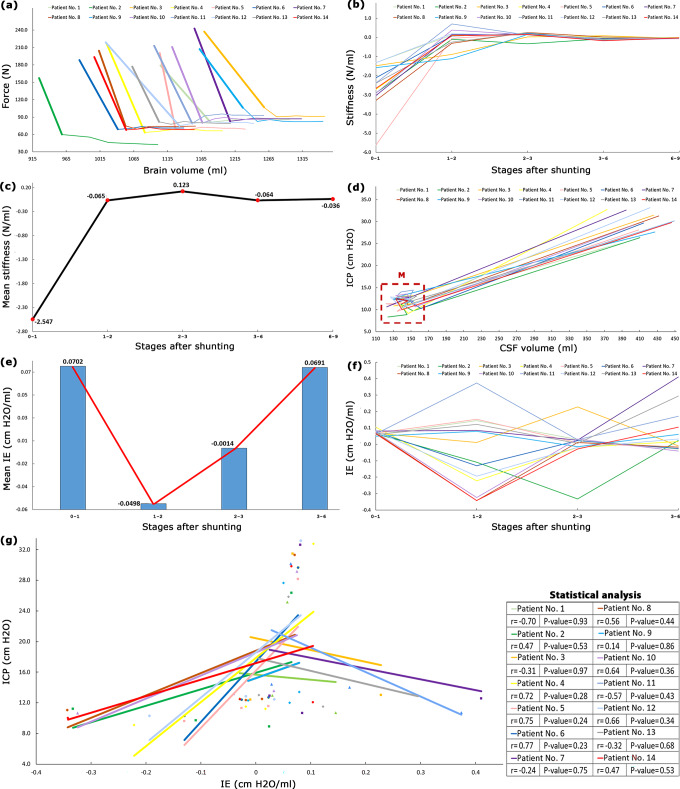
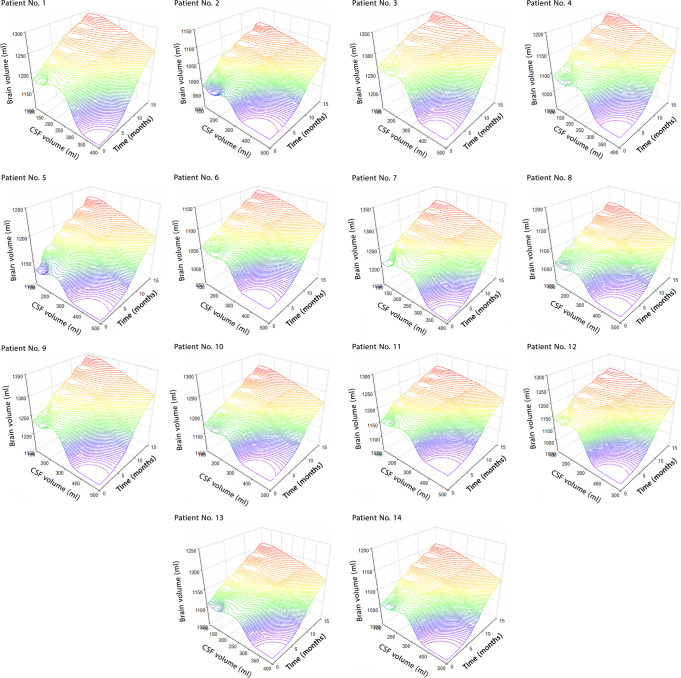
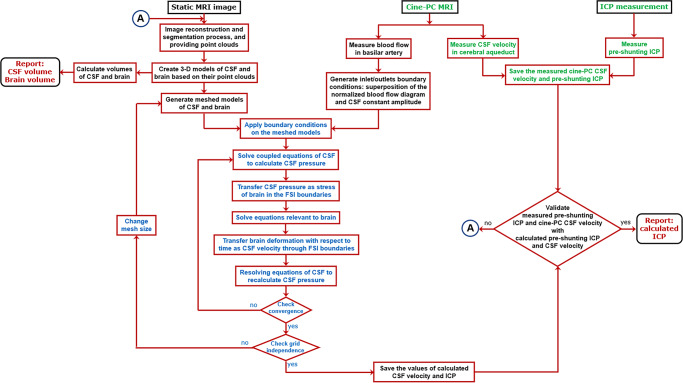
The unpredictable complexities in hydrocephalus shunt outcomes may be related to the recovery behavior of brain tissue after shunting. The simulated cerebrospinal fluid (CSF) velocity and intracranial pressure (ICP) over 15 months after shunting were validated by experimental data. The mean strain and creep of the brain had notable changes after shunting and their trends were monotonic. The highest stiffness of the hydrocephalic brain was in the first consolidation phase (between pre-shunting to 1 month after shunting). The viscous component overcame and damped the input load in the third consolidation phase (after the fifteenth month) and changes in brain volume were stopped. The long-intracranial elastance (long-IE) changed oscillatory after shunting and there was not a linear relationship between long-IE and ICP. We showed the long-term effect of the viscous component on brain recovery behavior of hydrocephalic brain. The results shed light on the brain recovery mechanism after shunting and the mechanisms for shunt failure.
© 2022. The Author(s).
Conflict of interest statement
The authors declare no competing interests.
Figures
Similar articles
-
A New Definition for Intracranial Compliance to Evaluate Adult Hydrocephalus After Shunting.Front Bioeng Biotechnol. 2022 Aug 1;10:900644. doi: 10.3389/fbioe.2022.900644. eCollection 2022. Front Bioeng Biotechnol. 2022. PMID: 35979170 Free PMC article.
-
Pulse amplitude of intracranial pressure waveform in hydrocephalus.Acta Neurochir Suppl. 2008;102:137-40. doi: 10.1007/978-3-211-85578-2_28. Acta Neurochir Suppl. 2008. PMID: 19388305
-
A laboratory model of shunt-dependent hydrocephalus. Development and biomechanical characterization.J Neurosurg. 1987 May;66(5):734-40. doi: 10.3171/jns.1987.66.5.0734. J Neurosurg. 1987. PMID: 3572499
-
Hydrocephalus: overdrainage by ventricular shunts. A review and recommendations.Surg Neurol. 1991 Mar;35(3):200-12. doi: 10.1016/0090-3019(91)90072-h. Surg Neurol. 1991. PMID: 1996449 Review.
-
Intracranial pressure and cerebral arterial flow velocity indices in childhood hydrocephalus: current review.Childs Nerv Syst. 1995 Jul;11(7):392-6. doi: 10.1007/BF00717403. Childs Nerv Syst. 1995. PMID: 7585666 Review.
Cited by
-
Enhanced Ionic Polymer-Metal Composites with Nanocomposite Electrodes for Restoring Eyelid Movement of Patients with Ptosis.Nanomaterials (Basel). 2023 Jan 24;13(3):473. doi: 10.3390/nano13030473. Nanomaterials (Basel). 2023. PMID: 36770434 Free PMC article.
-
Editorial: Modeling and simulation of cerebrospinal fluid disorders.Front Bioeng Biotechnol. 2023 Dec 13;11:1331170. doi: 10.3389/fbioe.2023.1331170. eCollection 2023. Front Bioeng Biotechnol. 2023. PMID: 38155926 Free PMC article. No abstract available.
-
Why Intracranial Compliance Is Not Utilized as a Common Practical Tool in Clinical Practice.Biomedicines. 2023 Nov 17;11(11):3083. doi: 10.3390/biomedicines11113083. Biomedicines. 2023. PMID: 38002083 Free PMC article. Review.
-
The Impact of Left Ventricular Performance and Afterload on the Evaluation of Aortic Valve Stenosis: A 1D Mathematical Modeling Approach.Bioengineering (Basel). 2023 Mar 28;10(4):425. doi: 10.3390/bioengineering10040425. Bioengineering (Basel). 2023. PMID: 37106613 Free PMC article.
-
Raman Spectroscopy Characterization of Multi-Functionalized Liposomes as Drug-Delivery Systems for Neurological Disorders.Nanomaterials (Basel). 2023 Feb 11;13(4):699. doi: 10.3390/nano13040699. Nanomaterials (Basel). 2023. PMID: 36839067 Free PMC article.
References
-
- Dewan MC, Naftel RP. The global rise of endoscopic third ventriculostomy with choroid plexus cauterization in pediatric hydrocephalus. Pediatr. Neurosurg. 2017;52:401–408. - PubMed
-
- Freimann FB, et al. Alteration of brain viscoelasticity after shunt treatment in normal pressure hydrocephalus. Neuroradiology. 2012;54:189–196. - PubMed
-
- Ferguson SD, Michael N, Frim DM. Observations regarding failure of cerebrospinal fluid shunts early after implantation. Neurosurgical focus. 2007;22:1–5. - PubMed
-
- Stagno V, Navarrete EA, Mirone G, Esposito F. Management of hydrocephalus around the world. World Neurosurg. 2013;79:S23. e17–S23.e20. - PubMed
Publication types
MeSH terms
LinkOut - more resources
Full Text Sources
Medical
