. 2022 Nov 7;12(1):18853.
doi: 10.1038/s41598-022-23748-y.

Shifting in the global flood timing

Affiliations

Shifting in the global flood timing

Gonghuan Fang et al. Sci Rep. .

Abstract

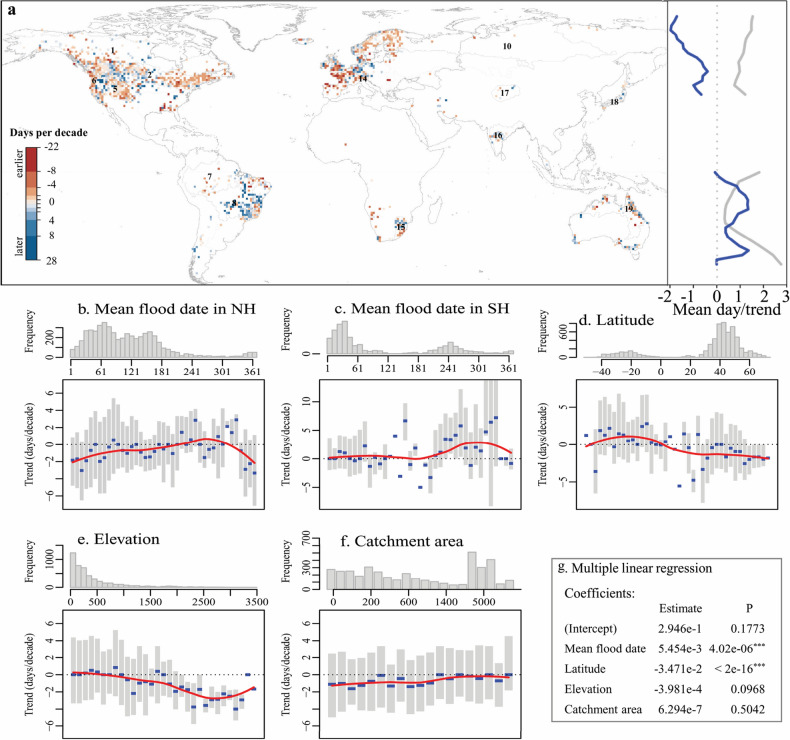
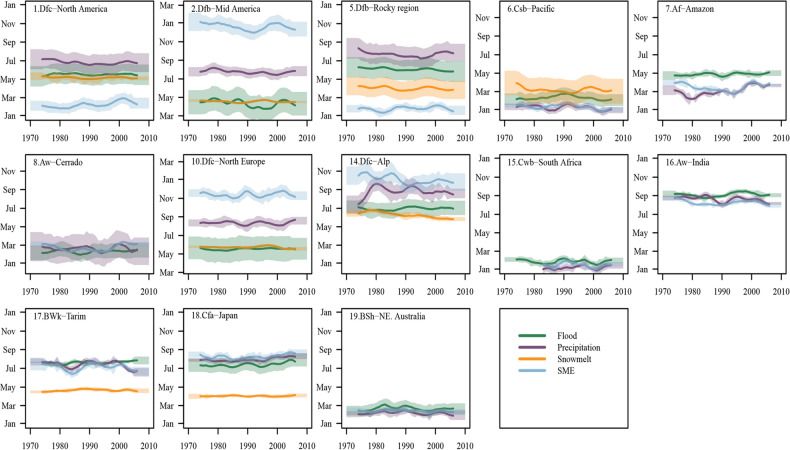
Climate change will have an impact on not only flood magnitude but also on flood timing. This paper studies the shifting in flood timing at 6167 gauging stations from 1970 to 2010, globally. The shift in flood timing and its relationship with three influential factors (maximum 7-day precipitation, soil moisture excess, and snowmelt) are investigated. There is a clear global pattern in the mean flooding date: winter (Dec-Feb) across the western Coastal America, western Europe and the Mediterranean region, summer (Jun-Aug) in the north America, the Alps, Indian Peninsula, central Asia, Japan, and austral summer (Dec-Feb) in south Africa and north Australia area. The shift in flood timing has a trend from - 22 days per decade (earlier) to 28 days per decade (delayed). Earlier floods were found extensively in the north America, Europe and northeast Australia while delayed floods were prevailing in the Amazon, Cerrado, south Africa, India and Japan. Earlier flood timing in the north America and Europe was caused by earlier snowmelt while delayed extreme soil moisture excess and precipitation have jointly led to delayed floods around the monsoon zone, including south Africa, India and Japan. This study provides an insight on the shifting mechanism of flood timing, and supports decisions on the global flood mitigation and the impact from future climate change.


Conflict of interest statement

The authors declare no competing interests.

Figures

Figure 1
Figure 1
The spatial pattern of flood timing during 1970–2010: (a) mean flood date, displayed as circular for each hotspot; (b) latitude averaged mean flood date; (c) flood concentration index around corresponding mean occurrence date; (d) latitude averaged flood concentration. Both the mean and concentration of flooding date are aggregated in 19 hotspots based on the Köeppen Climate Classification System. The names of these hotspots are listed below: 1. Dfc-North America, 2. Dfb-Mid America, 3. Dfa-Mid America, 4. Cfa-Southeast US, 5. Dfb-Rocky region, 6. Csb-Pacific,7. Am-Amazon, 8. Aw-Cerrado, 9. Cfa-Coastal, 10. Dfc-North Europe, 11. Dfb-North Eurasia, 12. Cfb-England, 13. Cfb-West Europe, 14. Dfc-Alp, 15. Cwb-South Africa, 16. Aw-India, 17. BWk-Tarim, 18. Cfa-Japan, 19. BSh-Northeast Australia) (Am/Aw is equatorial monsoon/winter dry climate, BWk/BSh is arid desert cold/hot climate, Cfa/Cfb and Csb/Cwb is warm temperate fully humid hot/warm summer and summer/winter dry warm summer climate, Dfa/Dfb/Dfc is snow fully humid hot/warm/cool summer climate).
Figure 2
Figure 2
Global distribution of the trend in observed flood timing during 1970–2010 with latitude average flooding date (gray line; for display purposes the magnitude of the flood date is scaled by a factor of 0.01) and trend in flood timing (blue line) (a). Boxplots b-f demonstrate the relations between the trend in flood timing and mean flood date in the northern hemisphere (NH) (b) and southern hemisphere (SH) (c), latitude (d), outlet elevation (e) and catchment area (f). The interquartile range, equaling the difference between the 25th and 75th percentiles, is used to characterize variability for each bin. The red lines represent a loess-curve fitted to the values. The station density was also displayed in subplot (bf). Subplot (g) shows the multiple linear regression analysis between flood timing trend with flood mean date, latitude, elevation and area.
Figure 3
Figure 3
Long-term temporal evolutions of flood timings and their influential factors for 13 hotspots with concentrate index > 0.7. Solid lines show the median timing over the entire hotspot: Green: timing of the observed floods; purple: 7-day maximum precipitation; orange: snow melting indicator and blue: timing of the calculated maximum soil moisture excess (SME). All data were subjected to a 10-year weighted moving average filter. The shaded bands indicate the timing variability within the year (± 0.5 standard deviations). Vertical axes show month of the year (note different starting months in these panels). The precipitation and SME data were started from 1979 in south africa as the CPC precipitation data was started from 1979.

References

    1. Hirabayashi Y, et al. Global flood risk under climate change. Nat. Clim. Change. 2013;3:816–821. doi: 10.1038/nclimate1911. - DOI
    1. Dottori F, et al. Increased human and economic losses from river flooding with anthropogenic warming. Nat. Clim. Change. 2018;8:781–786. doi: 10.1038/s41558-018-0257-z. - DOI
    1. Blöschl G, et al. Changing climate shifts timing of European floods. Science. 2017;357:588–590. doi: 10.1126/science.aan2506. - DOI - PubMed
    1. Winsemius HC, et al. Global drivers of future river flood risk. Nat. Clim. Change. 2016;6:381–385. doi: 10.1038/nclimate2893. - DOI
    1. Corringham TW, Ralph FM, Gershunov A, Cayan DR, Talbot CA. Atmospheric rivers drive flood damages in the western United States. Sci. Adv. 2019;5:eaax4631. doi: 10.1126/sciadv.aax4631. - DOI - PMC - PubMed

Publication types