. 2022 Nov;4(11):1532-1550.
doi: 10.1038/s42255-022-00672-z. Epub 2022 Nov 7.

A gut-derived hormone suppresses sugar appetite and regulates food choice in Drosophila

Affiliations

A gut-derived hormone suppresses sugar appetite and regulates food choice in Drosophila

Alina Malita et al. Nat Metab. 2022 Nov.

Abstract

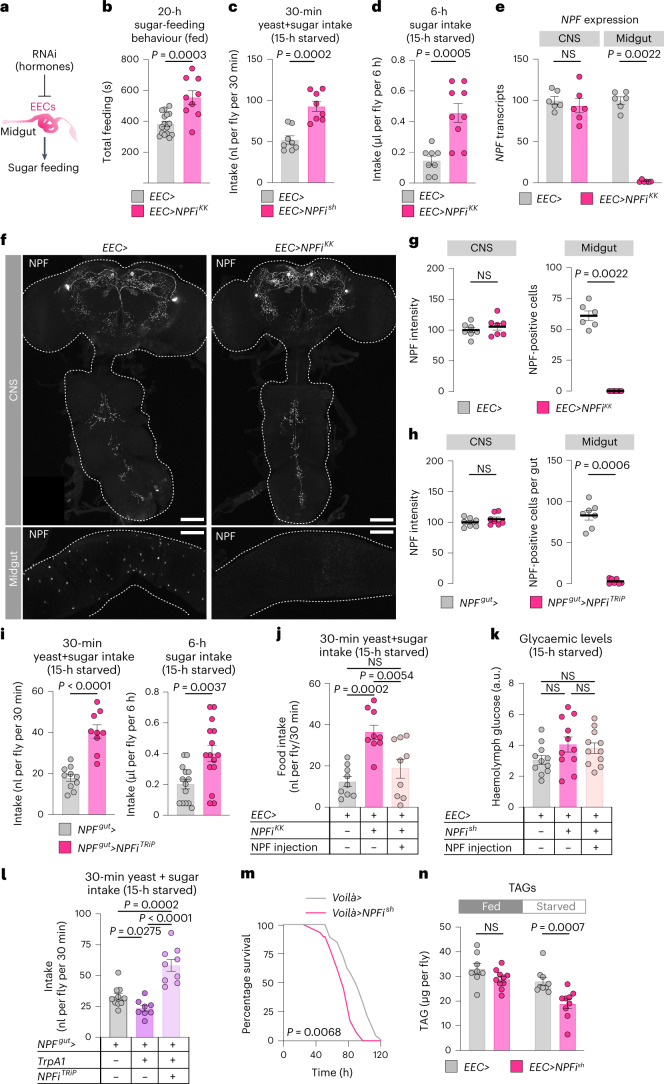
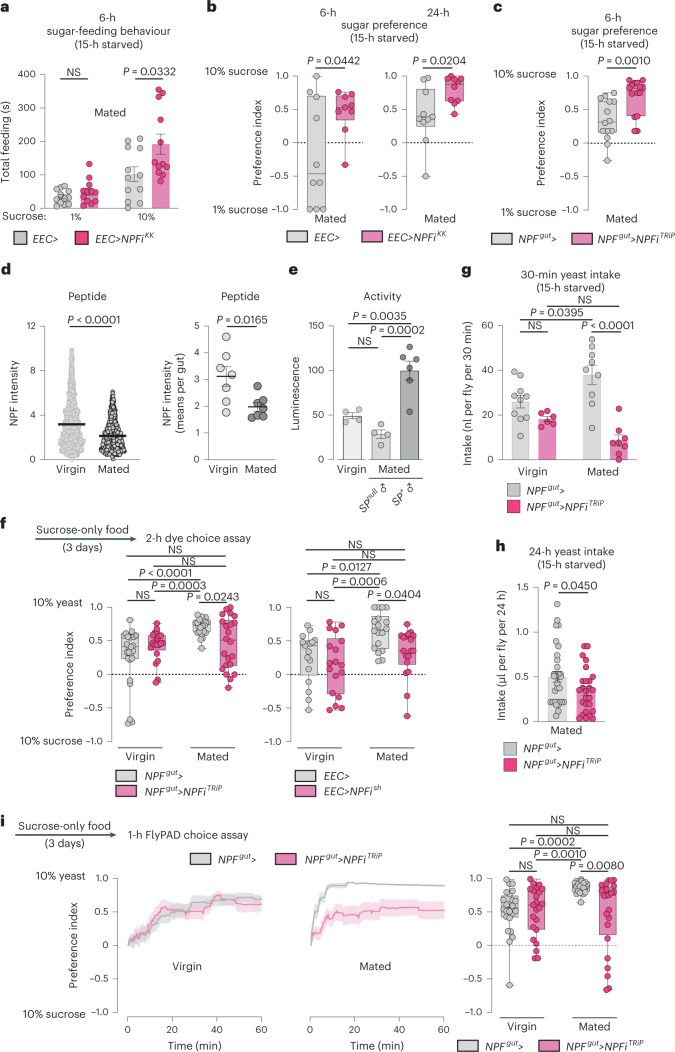
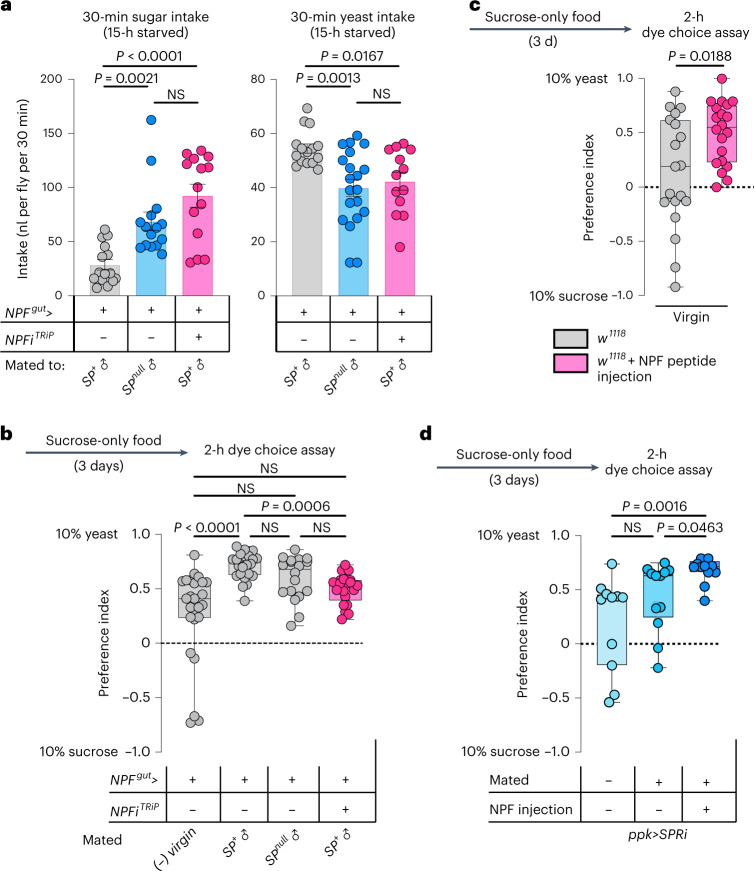
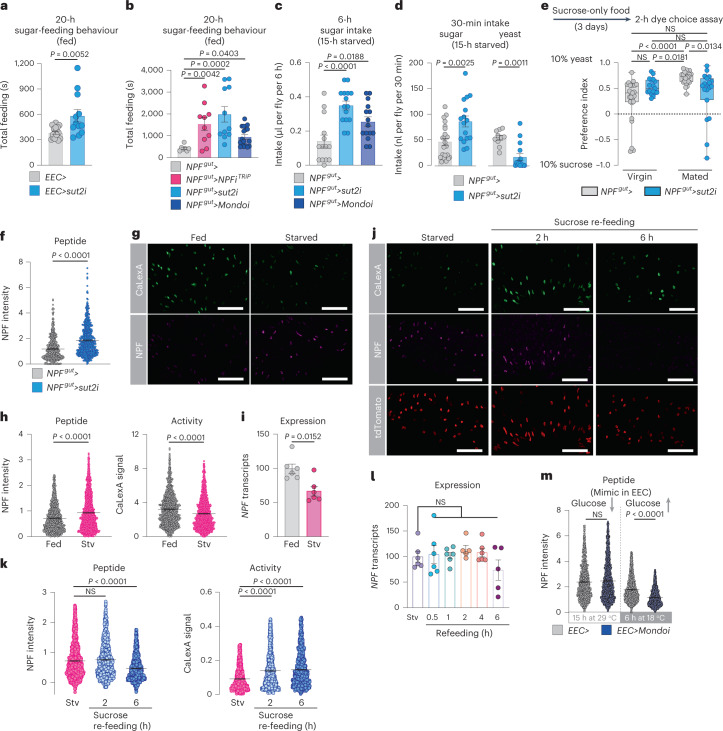
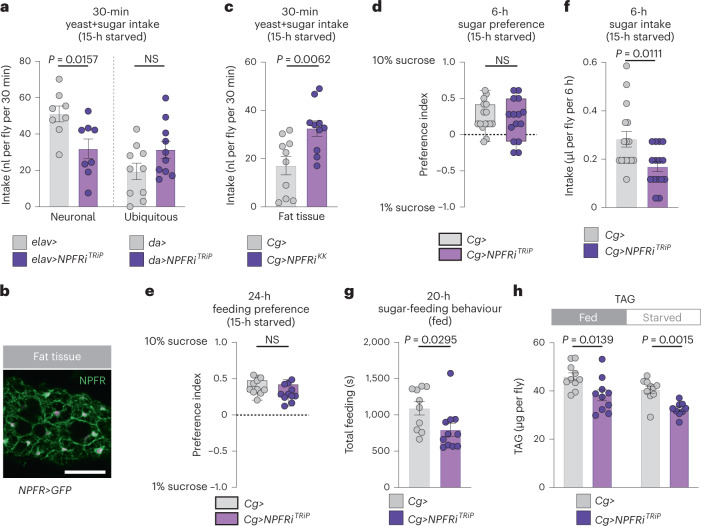
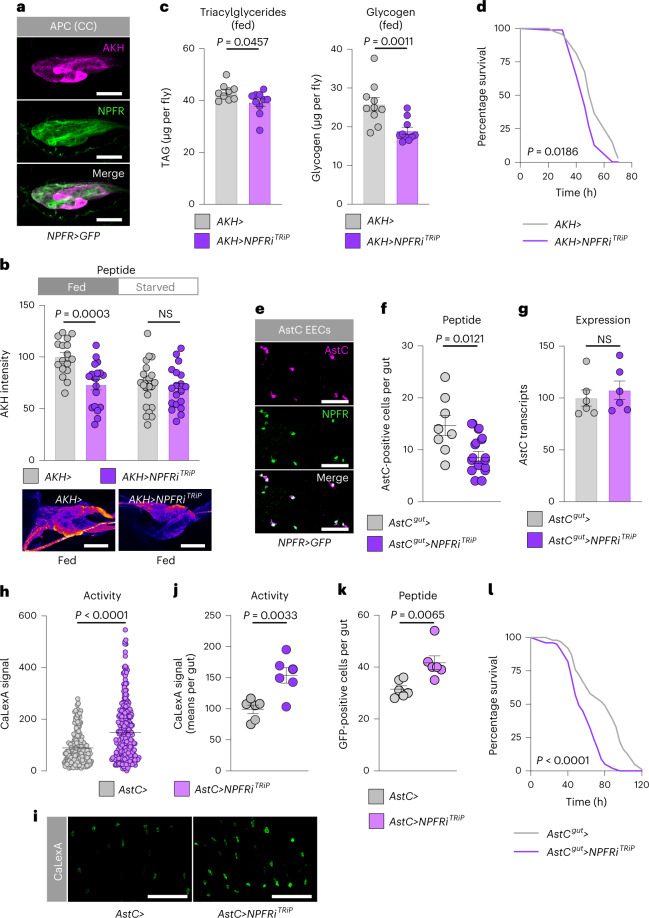
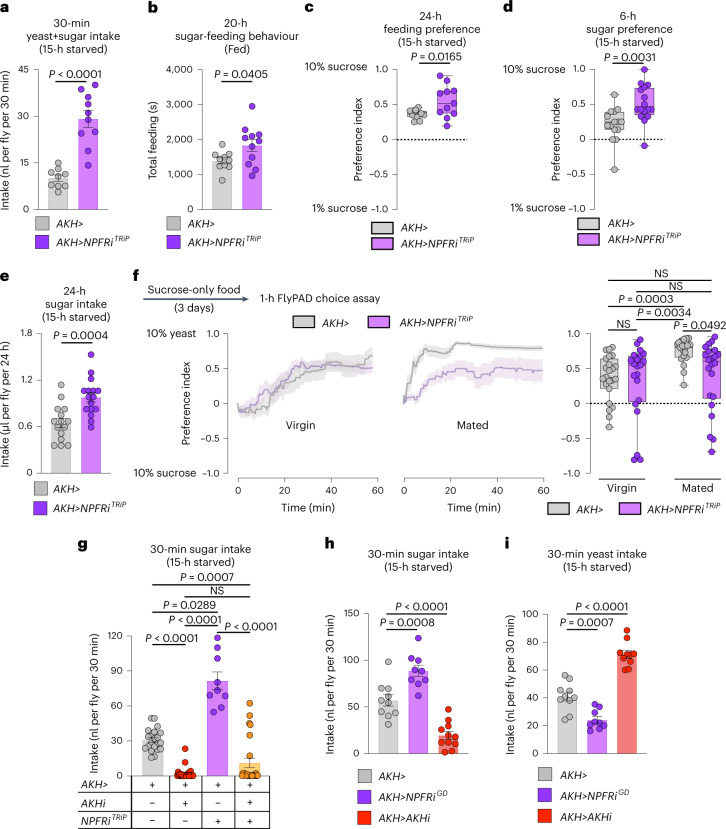
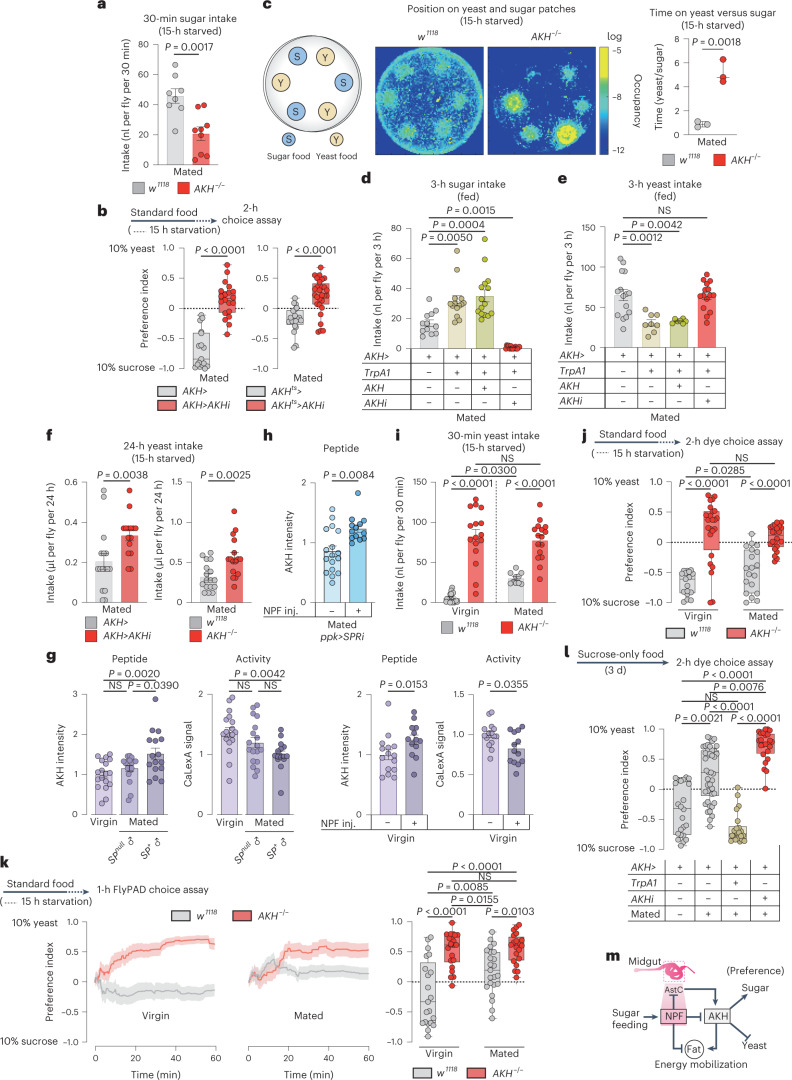
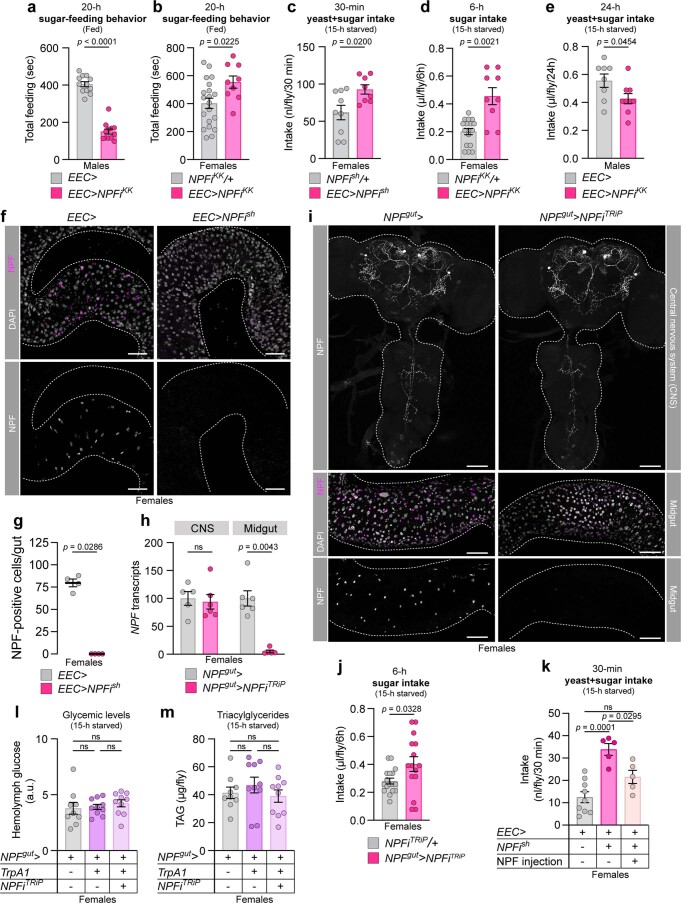
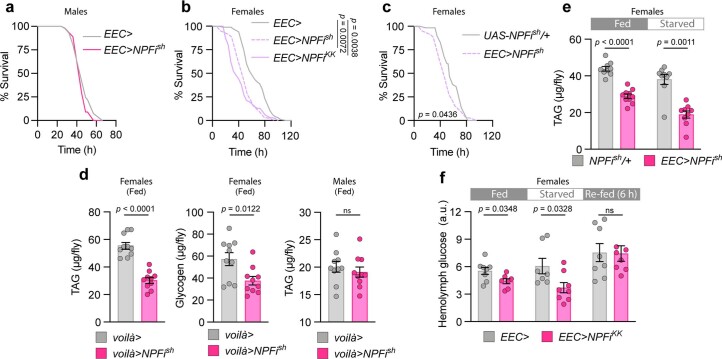
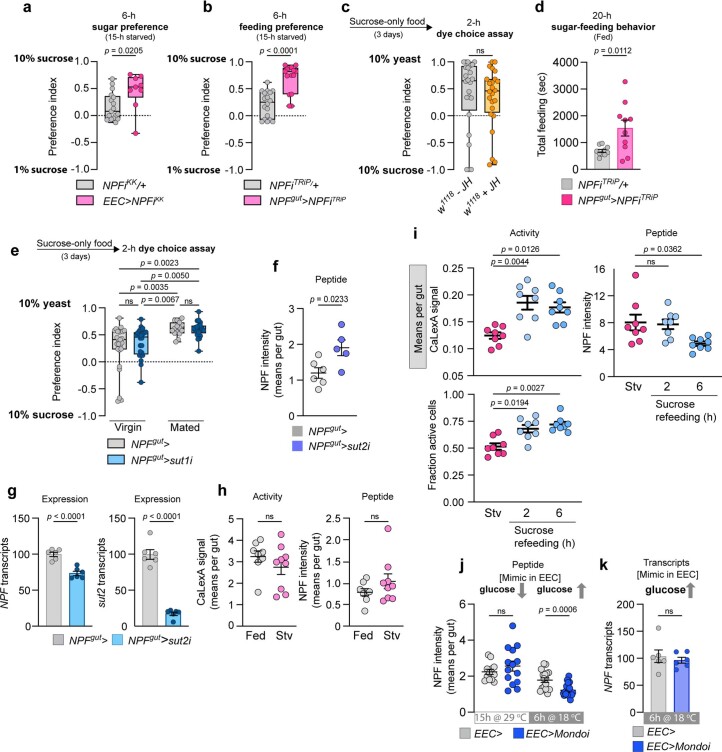
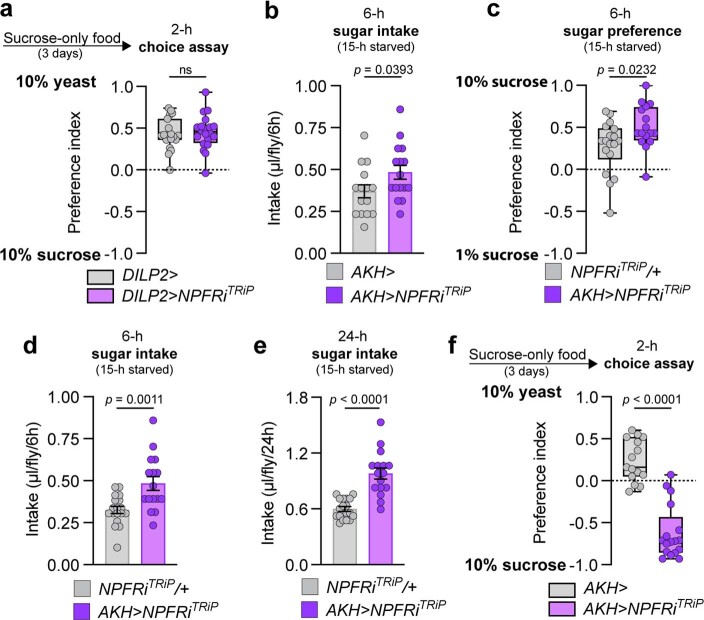
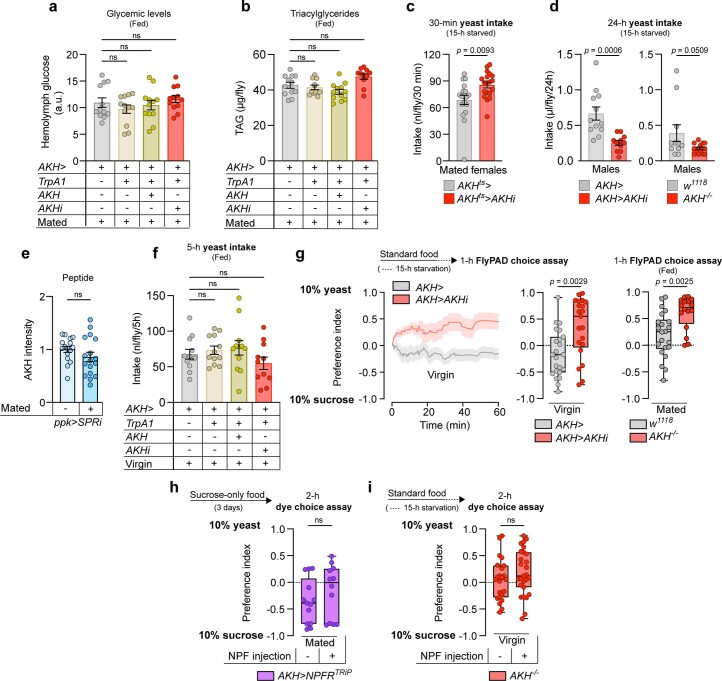
Animals must adapt their dietary choices to meet their nutritional needs. How these needs are detected and translated into nutrient-specific appetites that drive food-choice behaviours is poorly understood. Here we show that enteroendocrine cells of the adult female Drosophila midgut sense nutrients and in response release neuropeptide F (NPF), which is an ortholog of mammalian neuropeptide Y-family gut-brain hormones. Gut-derived NPF acts on glucagon-like adipokinetic hormone (AKH) signalling to induce sugar satiety and increase consumption of protein-rich food, and on adipose tissue to promote storage of ingested nutrients. Suppression of NPF-mediated gut signalling leads to overconsumption of dietary sugar while simultaneously decreasing intake of protein-rich yeast. Furthermore, gut-derived NPF has a female-specific function in promoting consumption of protein-containing food in mated females. Together, our findings suggest that gut NPF-to-AKH signalling modulates specific appetites and regulates food choice to ensure homeostatic consumption of nutrients, providing insight into the hormonal mechanisms that underlie nutrient-specific hungers.


Conflict of interest statement

The authors declare no competing interests.

Figures

Fig. 1
Fig. 1. Gut-derived NPF regulates sugar intake and metabolism in mated females.
a, Sugar feeding in mated females with RNAi-mediated knockdown of hormones and transporters in the EECs of the midgut. b, Total time feeding using FLIC; n = 16 EEC>, n = 9 EEC > NPFiKK. c,d, Consumption (c) of sugar+yeast food (9% sugar and 8% yeast) determined by dye assay, and of 10% sugar (d) measured by CAFÉ assay; c, n = 8 EEC> and EEC>NPFish; d, n = 8 EEC>, n = 9 EEC>NPFiKK. e, Conditional NPF knockdown with EEC> affects the EECs but not the CNS (brain and VNC); n = 6 biological replicates from tissues pooled from six animals for each condition. f,g, NPF immunostaining of CNS and midgut, quantified in g; n = 7 CNS, n = 6 midguts. Scale bars, 50 μm. h, Quantification of images represented in Extended Data Fig. 1i, immunostaining of NPF knockdown using the NPF> driver with pan-neuronal GAL80 (R57C10-GAL80; NPF>– together, NPFgut>) of midgut EECs and CNS; n = 7 tissues each. i, Intake measured by dye-consumption and CAFÉ assays. Left n = 10 NPFgut>, n = 9 NPFgut>NPFiTRiP; right n = 14 NPFgut>, n = 15 NPFgut>NPFiTRiP. j,k, Consumption and glycaemic levels after injection of NPF peptide into the haemolymph. j, n = 9 each. k, n = 11 each. l, Thirty-minute food intake measured by dye assay during activation of NPF+ EECs using the heat-sensitive TrpA1 channel; n = 10 NPFgut>, n = 8 NPFgut>TrpA1, n = 9 NPFgut>TrpA1, NPFiTRiP. m, Survival under starvation. n, TAG levels; n = 8 fed EEC>, n = 10 fed EEC>NPFiKK, n = 9 starved EEC>, n = 9 starved EEC>NPFiKK. All animals were mated females. Bars represent mean ± s.e.m. NS, not significant. bd,i, Two-tailed unpaired Student’s t-test. e,g,h,n, Two-tailed unpaired Mann–Whitney U-test. jl, One-way ANOVA with Tukey’s multiple-comparisons test. m, Kaplan–Meier log-rank tests. Source data
Fig. 2
Fig. 2. Mating induces gut NPF that suppresses sugar appetite and promotes intake of protein-rich yeast food in females.
a, Time spent feeding on 1 or 10% sucrose using FLIC; all n = 12 animals. b,c, Preference between 1 versus 10% sugar measured over 6 or 24 hours by CAFÉ assay. b, 6-hour preference: n = 10 EEC>, n = 9 EEC>NPFiKK. 24-hour preference: n = 10 each. c, n = 14 NPFgut>, n = 15 NPFgut>NPFiTRiP. d, Midgut NPF staining intensity in fed females on a per-cell basis and on a per-gut basis; n = 703 cells from seven guts for virgins, n = 883 cells from seven guts from mated females. e, NPF-cell activity measured in dissected midguts (two midguts per replicate) using a luciferase-based CaLexA calcium-reporter system (NPF>LexA::NFAT::VP16; LexAop-luciferase); n = 4 from fed virgins, n = 4 from fed females mated to SP-deficient males (SP0/Df(3L)delta130), n = 6 from fed females mated to SP+ males. f, Consumption preference for 10% sucrose versus 10% yeast after 3 days of yeast deprivation (3 days on sucrose-only medium) using two-choice dye assay; n = 25 NPFgut> virgins, n = 23 NPFgut>NPFiTRiP virgins, n = 24 NPFgut> mated females, n = 22 NPFgut>NPFiTRiP mated females, n = 17 EEC> virgins, n = 18 EEC>NPFish virgins, n = 18 EEC> mated females, n = 18 EEC>NPFish mated females. g, Yeast consumption determined by dye assay; virgins n = 10 NPFgut> virgins, n = 6 NPFgut>NPFiTRiP virgins, n = 9 NPFgut> mated females, n = 8 NPFgut>NPFiTRiP mated females. h, Yeast intake determined by CAFÉ; n = 32 NPFgut>, n = 26 NPFgut>NPFiTRiP. i, Cumulative behavioural preference of females for sucrose versus yeast monitored using flyPAD. Lines represent means, and shading indicates s.e.m.; n = 24 NPFgut> virgins, n = 23 NPFgut>NPFiTRiP virgins, n = 24 NPFgut> mated females, n = 24 NPFgut>NPFiTRiP mated females. Bars represent mean ± s.e.m. Box plots indicate minimum, 25th percentile, median, 75th percentile and maximum values. NS, not significant. a,c,d (left), Two-tailed unpaired Mann–Whitney U-test. b,d (right), h, Two-tailed unpaired Student’s t-test. e,f (right), g, One-way ANOVA with Tukey’s post hoc test. f (left), i, Kruskal–Wallis nonparametric ANOVA with Dunn’s multiple-comparisons test. Source data
Fig. 3
Fig. 3. NPF regulates food choice downstream of SP signalling in mated females, and exogenous NPF promotes yeast preferences in virgins.
a, Intake of sucrose or yeast measured by dye assay in females mated to SP-producing or SP-deficient males (SP0/Df(3L)delta130). Sucrose, n = 15 NPFgut> females mated to SP+ males, n = 15 NPFgut> females mated to SP-mutant (SPnull) males, n = 14 NPFgut>NPFiTRiP females mated to SP+ males. Yeast, n = 15 NPFgut> females mated to SP+ males, n = 20 NPFgut> females mated to SP-mutant males, n = 13 NPFgut>NPFiTRiP females mated to SP+ males. b, Consumption preference using two-choice dye assay; n = 25 NPFgut> virgins, n = 24 NPFgut> females mated to SP+ males, n = 18 NPFgut> females mated to SP-null males, n = 21 NPFgut>NPFiTRiP females mated to SP+ males. c,d, Consumption preference of w1118 virgin females with or without NPF injection (c) and virgin and mated females (d) (with and without NPF injections) with knockdown of SPR in Ppk+ neurons (ppk>SPRi) using two-choice dye assay. c, n = 19 w1118 virgins, n = 20 w1118 virgins with NPF injection. d, n = 11 virgin ppk>SPRi females, n = 12 mated ppk>SPRi females, n = 12 mated ppk>SPRi females with NPF injection. Bars represent mean ± s.e.m. Box plots indicate minimum, 25th percentile, median, 75th percentile and maximum values. NS, not significant. a (left), b,d, One-way Kruskal–Wallis ANOVA with Dunn’s multiple-comparisons test. a, Right, one-way ANOVA with Dunnett’s multiple-comparisons test. c, Two-tailed unpaired Mann–Whitney U-test. Source data
Fig. 4
Fig. 4. Sugar transporter 2 in the EECs regulates glucose-stimulated NPF secretion in mated females.
a,b, Feeding time measured using FLIC. a, n = 16 EEC>, n = 12 EEC>sut2i. b, n = 7 NPFgut>, n = 10 NPFgut>NPFiTRiP, n = 11 NPFgut>sut2i, n = 17 NPFgut>Mondoi. c, Sugar consumption measured by CAFÉ assay; n = 14 NPFgut>, n = 15 NPFgut>sut2i, n = 15 NPFgut>Mondoi. d, Consumption of sucrose or yeast measured by dye assay. Sucrose n = 22 NPFgut>, n = 16 NPFgut>sut2i. Yeast n = 10 NPFgut>, n = 15 NPFgut>sut2i. e, Consumption preference measured by two-choice dye-consumption assay. Virgins, n = 25 NPFgut>, n = 17 NPFgut>sut2i; mated n = 24 NPFgut>, n = 19 NPFgut>sut2i. f, Midgut NPF staining with sut2 knockdown; n = 571 cells from six guts for NPFgut>, n = 625 cells (five guts) for NPFgut>sut2i. g,h, Representative images of midgut NPF-cell activity (g), quantified in h; left shows n = 1,167 cells from eight fed guts, n = 1,394 cells from nine starved (stv) guts; right shows n = 1,209 cells from eight fed guts, n = 1,405 cells from nine starved guts. i, Midgut NPF expression; n = 6 for stv, 0.5 h, 1 h, 4 h and n = 5 for 2 h, 6 h, each samples of five guts. j, Representative images of NPF staining and cell activity in 24-h starved, 2-h sugar re-fed and 6-h sugar re-fed mated females. All measured cells are marked with tdTomato. k, Quantification of j. Eight guts per condition. Left, n = 1,297, 1,038 and 1,216 cells from starved, 2-h and 6-h re-fed animals. Right, n = 1,141, 954 and 1,151 cells from starved, 2-h re-fed and 6-h re-fed animals. l, Midgut NPF expression in mated females after re-feeding following 24-hour starvation (Stv, no re-feeding); n = 6 replicates of six midguts except n = 5 replicates for 2 and 6 h. m, NPF staining in mated females’ midguts after 15 hours’ knockdown of Mondo (29 °C inactivation of GAL80TS) and following subsequent 6-h derepression of Mondo (18 °C). 15 h at 29 °C: n = 1,595 cells/12 guts for EEC>, n = 1,840 cells/14 guts for EEC>Mondoi; 6 h at 18 °C: n = 1,948 cells/17 guts for EEC>, n = 2,194 cells/18 guts for EEC>Mondoi. All animals were mated females, except in e. Bars represent mean ± s.e.m. Box plots indicate minimum, 25th percentile, median, 75th percentile and maximum values. NS, not significant. a,d (left), Two-tailed unpaired Student’s t-test. b,e,k, One-way Kruskal–Wallis ANOVA with Dunn’s multiple-comparisons test. c,l, One-way ANOVA with Dunnett’s multiple-comparisons test. d (right), f,h,i,m, Two-tailed unpaired Mann–Whitney U-test. Scale bars, 50 μm. Source data
Fig. 5
Fig. 5. Loss of NPFR in the fat affects metabolism but does not increase preference for dietary sugar in mated females.
a, Food intake measured by dye in animals with knockdown of NPFR in the nervous system (elav>) or the entire body (da>) measured by dye assay; n = 8 elav>, n = 8 elav>NPFRiTRiP, n = 10 da>, n = 10 da>NPFRiTRiP. b, Fat-body immunostaining of NPFR>mCD8::GFP reporter. Scale bar, 50 μm c, Food intake determined by dye assay in fat-body NPFR-knockdown animals; both n = 10. d, Consumption preference for 1 versus 10% sucrose, measured by CAFÉ assay; n = 16 Cg>, n = 15 Cg>NPFRiTRiP. e, Behavioural preference for interacting with 1 versus 10% dietary sucrose measured by FLIC; n = 10 Cg>, n = 11 Cg>NPFRiTRiP. f, Sucrose intake by CAFÉ assay; n = 16 Cg>, n = 15 Cg>NPFRiTRiP. g, Time spent feeding on sucrose using FLIC; n = 10 Cg>, n = 11 Cg>NPFRiTRiP. h, Whole-body TAG levels in fed and 15-hour-starved fat-body NPFR-knockdown animals. All n = 10 except n = 9 starved Cg>NPFRiTRiP. All animals were mated females. Bars represent mean ± s.em. Box plots indicate minimum, 25th percentile, median, 75th percentile and maximum values. NS, not significant. a,ce,h (left), Two-tailed unpaired Student’s t-test. fh (right), Two-tailed unpaired Mann–Whitney U-test. Source data
Fig. 6
Fig. 6. NPFR regulates metabolism through inhibition of AKH signalling in mated females.
a, Immunohistochemistry of APCs shows NPFR>GFP reporter expression in APCs of mated females. Scale bars 20 μm. b, Quantification of AKH levels within the APCs of fed and 15-hour-starved mated females with and without NPFR knockdown in these cells; n = 17 fed AKH>, n = 19 fed AKH>NPFRiTRiP, n = 22 starved AKH>, n = 19 starved AKH>NPFRiTRiP. Representative images are shown below. Scale bars 20 μm. c, Metabolite levels in fed mated females. TAG n = 9 AKH>, n = 10 AKH>NPFRiTRiP; glycogen n = 10 AKH>, n = 10 AKH>NPFRiTRiP. d, Survival during starvation of mated females; n = 96 AKH>, n = 96 AKH>NPFRiTRiP. e, Immunohistochemistry of guts from mated female NPFR>GFP flies showing expression of NPFR reporter in AstC+ cells. Scale bars, 25 μm. f, Quantification of the number of midgut cells per gut that showed detectable AstC staining with and without NPFR knockdown in AstC+ EECs of fed mated females; n = 8 AstCgut> guts, n = 11 AstCgut>NPFRiTRiP. g, Midgut AstC transcript levels in fed mated females; each n = 6. hk, AstC+ EEC-cell activity levels (h) with representative images (i) quantified on a per-gut basis (j) and the number of AstC+ EEC cells showing detectable GFP (k), measured by calcium-reporter system (AstC>LexA::NFAT::VP16; LexAop-GFP, denoted by AstC> in the figure) with or without NPFR knockdown in the AstC+ EECs in the midgut. h, n = 182 AstC> cells, n = 255 AstC>NPFR cells; j, each n = 6 guts; k, each n = 6 guts. Scale bars, 50 μm. l, Survival during starvation of mated females; n = 153 AstCgut> animals, n = 198 AstCgut>NPFRiTRiP. All animals were mated females. Bars represent mean ± s.e.m. Box plots indicate minimum, 25th percentile, median, 75th percentile and maximum values. NS, not ignificant. b,c (left), f,g,j, Two-tailed unpaired Student’s t-test. d,l, Gehan–Breslow–Wilcoxon test. c (right), h,k, Two-tailed unpaired Mann–Whitney U-test. Source data
Fig. 7
Fig. 7. Loss of NPFR in the APCs phenocopies the gut NPF-loss feeding phenotypes in mated females.
a, Food intake measured by dye assay; n = 9 AKH>, n = 10 AKH>NPFRiTRiP. b, Time spent feeding on sucrose measured by FLIC; n = 10 AKH>, n = 11 AKH>NPFRiTRiP. c, Behavioural preference for 1 versus 10% sugar solution measured by FLIC; both n = 11. d, Consumption preference for 1 versus 10% sucrose measured by CAFÉ assay; n = 15 AKH>, n = 16 AKH>NPFRiTRiP. e, Sucrose consumption measured by CAFÉ assay; n = 15 AKH>, n = 16 AKH>NPFRiTRiP. f, Behavioural preference using flyPAD. Lines represent means, and shading indicates s.e.m.; virgins n = 23 AKH>, n = 21 AKH>NPFRiTRiP; mated n = 19 AKH>, n = 22 AKH>NPFRiTRiP. g, Rescue of sugar overconsumption induced by NPFR knockdown in the APCs through simultaneous AKH knockdown, by dye assay; n = 21 AKH>, n = 24 AKH>AKHiKK, n = 9 AKH>NPFRiTRiP, n = 24 AKH>AKHiKK, NPFRiTRiP. h,i, Sucrose (h) and yeast (i) intake measured over 30 min by dye assay. h, n = 10 AKH>, n = 9 AKH>NPFRiGD, n = 11 AKH>AKHiKK. i, n = 10 AKH>, n = 9 AKH>NPFRiGD, n = 10 AKH>AKHiKK. All animals were mated females, except in f. Bars represent mean ± s.e.m. Box plots indicate minimum, 25th percentile, median, 75th percentile and maximum values. NS, not significant. ad, Two-tailed unpaired Student’s t-test. e, Two-tailed unpaired Mann–Whitney U-test. f,g, One-way Kruskal–Wallis ANOVA with Dunn’s multiple-comparisons test. h,i, One-way ANOVA with Dunnett’s multiple-comparisons test. Source data
Fig. 8
Fig. 8. AKH promotes sugar feeding and suppresses protein intake in mated females.
a, Sugar intake by dye assay. n = 8 w1118, n = 9 AKH−/−. b, Consumption preference, n = 17 AKH>, n = 20 AKH>AKHiKK, n = 20 AKHts>, n = 28 AKHts>AKHiKK. c, Heat map of 30 min tracking of 12 females per genotype. Ratio of time spent on yeast versus sugar patches, n = 3. d,e, Sugar and yeast intake using dye assay, at 29 °C for TrpA1 activation. d, n = 12 AKH>, n = 14 AKH>TrpA1, n = 15 AKH>TrpA1+AKH, n = 15 AKH>TrpA1+AKHi. e, n = 15 AKH>, n = 8 AKH>TrpA1, n = 7 AKH>TrpA1+AKH, n = 15 AKH>TrpA1+AKHi. f, Yeast intake measured by CAFÉ assay. n = 6 AKH>, n = 15 AKH>AKHiKK, n = 17 w1118, n = 16 AKH−/−. g, APCs staining and cell activity, left two panels show n = APCs from 18 w1118 virgins, n = 18 w1118 females mated to SP-deficient males (SP0/Df(3L)delta130), n = 16 w1118 females mated to SP+ males. Right two panels show n = 15 w1118 virgins without NPF injection, n = 13 w1118 virgins with NPF injection. h, AKH staining intensity in mated females with SPR knockdown in the ppk+ neurons with or without NPF injection, n = 17 ppk>SPRi mated females, n = 13 ppk>SPRi mated females with NPF injection. i, Yeast consumption measured by dye assay, n = 18 w1118 virgins, n = 16 AKH−/− virgins, n = 10 mated w1118 females, n = 16 mated AKH−/− females. j, Consumption preference using the two-choice dye assay; n = 17 w1118 virgins, n = 24 AKH−/− virgins, n = 19 mated w1118 females, n = 22 mated AKH−/− females. k, Cumulative behavioural preference using flyPAD. Lines represent means, and shading indicates s.e.m., n = 21 w1118 virgins, n = 22 AKH−/− virgins, n = 23 mated w1118 females, n = 20 mated AKH−/− females. l, Preference measured using the two-choice dye assay at 29 °C for TrpA1 activation, n = 23 AKH> virgins, n = 42 AKH>, n = 22 AKH>TrpA1, n = 24 AKH>AKHi mated females. m, A model of the NPF-AKH axis. Bars represent mean ± s.e.m. Box plots indicate minimum, 25th percentile, media, 75th percentile and maximum. Inj., injection; NS, not significant. a,b (right), c,f, Two-tailed unpaired Student’s t-test. b (left), g (right), h, Two-tailed unpaired Mann–Whitney U-test. d,e,g (left), i,k, One-way ANOVA with Tukey’s post hoc test. j, One-way ANOVA with Dunnett’s multiple comparison test or Kruskal–Wallis with Dunn’s multiple-comparisons test. l, One-way Kruskal–Wallis ANOVA with Dunn’s multiple-comparisons test. Source data
Extended Data Fig. 1
Extended Data Fig. 1. NPF knockdown efficiently depletes NPF specifically in the midgut EECs and affects food intake.
(a) Total time feeding using FLIC; n = 12. (b) Time spent feeding determined by FLIC; n = 20 NPFiKK/+, n = 9 EEC > NPFiKK. (c) Amount of sugar+yeast solid food (9% sugar + 8% yeast) consumed, by dye assay; n = 9 NPFish/+; n = 8 EEC > NPFish. (d) Consumption of 10% sugar measured by CAFÉ assay; n = 17 NPFiKK/+ and n = 9 EEC > NPFiKK. (e) Consumption of sugar+yeast liquid food (5% sugar + 5% yeast extract) measured by CAFÉ assay; n = 8 EEC > , n = 9 EEC > NPFiKK. (f,g) NPF immunostaining in the midgut of mated females, quantified in (g); n = 4 guts. Scale bars, 50 μm. (h) Knockdown using the R57C10-GAL80, NPF > (NPFgut > ) driver with NPFiTRiP affects NPF transcripts in mated female guts but not the CNS (brain and ventral nerve cord), n = 5 NPFgut > CNS samples, n = 6 NPFgut > NPFiTRiP CNS samples, n = 6 NPFgut > midgut samples, n = 5 NPFgut > NPFiTRiP midgut samples, each replicate containing tissues from 6 animals. (i) NPF immunostaining of CNS and midguts from mated females, quantified in Fig. 1 h. Scale bars, 50 μm. (j) Consumption of 10% sugar-water measured by CAFÉ assay; n = 17 NPFiTRiP/+, n = 15 NPFgut > NPFiTRiP. (k) Food intake after injection of NPF peptide into the haemolymph measured by dye assay; n = 9 EEC > , n = 5 EEC > NPFish, n = 5 EEC > NPFish with NPF injection. (l,m) Hemolymph glucose (l) and whole-body TAG (m) levels after 30-minute incubation at 29 °C for TrpA1 activation; n = 9 NPFgut > , n = 10 NPFgut > TrpA1, n = 10 NPFgut > TrpA1 + NPFi. All females were mated. Bars represent mean±SEM. ns, non-significant. a, b, c, e, j: Two-tailed unpaired Student’s t test. d, g, h: Two-tailed unpaired Mann–Whitney U test. k: One-way ANOVA with Tukey’s multiple-comparisons test. l, m: Kruskal-Wallis nonparametric ANOVA with Dunn’s multiple-comparisons test. Source data
Extended Data Fig. 2
Extended Data Fig. 2. Enteroendocrine NPF regulates systemic metabolism and resistance to nutritional stress.
(a-c) Survival during starvation; in (a), n = 41 EEC > males, n = 45 EEC > NPFish males; in (b), n = 130 EEC > , n = 122 EEC > NPFish, n = 94 EEC > NPFiKK; in (c), n = 50 UAS-NPFish/+, n = 122 EEC > NPFish. (d) TAG and glycogen levels in animals with gut NPF knockdown during development; n = 10. (e) TAG levels in the fed condition and following 24-hour starvation; n = 9 fed NPFiKK/+, n = 10 fed EEC > NPFiKK, n = 9 starved NPFiKK/+, n = 9 starved EEC > NPFiKK. (f) Hemolymph sugar levels in the fed condition, after 24 hours’ starvation, and after 6 hours of re-feeding from the 24-hour-starved condition; n = 8 fed EEC > , n = 7 fed EEC > NPFiKK, n = 7 starved EEC > , n = 8 starved EEC > NPFiKK, n = 8 re-fed EEC > , n = 7 re-fed EEC > NPFiKK. All females were mated. Bars represent mean±SEM. ns, non-significant. a, b, c: compared using Gehan-Breslow-Wilcoxon test. d, e (left), f: Two-tailed unpaired Student’s t test. e (right): Two-tailed unpaired Mann-Whitney U test. Source data
Extended Data Fig. 3
Extended Data Fig. 3. EEC-specific loss of NPF affects feeding and is influenced by sugar sensing.
(a,b) Consumption preference for 1% vs. 10% sugar-water, measured by CAFÉ assay; n = 17 NPFiKK/+ animals, n = 9 EEC > NPFiKK, n = 18 NPFiTRiP/+, n = 15 NPFgut > NPFiTRiP. (c) Consumption preference of virgin female flies with or without JH treatment (methoprene); n = 24 each. (d) Feeding time on 10% sucrose measured by FLIC; n = 10 NPFiTRiP/+ animals, n = 10 NPFgut > NPFiTRiP. (e) Preference of virgin and mated females, measured by two-choice dye consumption assay; n = 25 NPFgut > virgins, n = 24 NPFgut > sut1i virgins, n = 15 NPFgut > mated females, n = 22 NPFgut > sut1i mated females. (f) Midgut NPF staining intensity with sut2 knockdown in NPF+ EECs on a per-gut basis; n = 6 guts for NPFgut > , n = 5 guts for NPFgut > sut2i. (g) Transcript levels of NPF (left) and sut2 (right) in midguts from fed mated females; n = 6 replicates containing five tissues each. (h) NPF intensity and NPF-cell activity (CaLexA) in fed and 24-h-starved animals on a per-gut basis; n = 8 for fed, n = 9 for 24-hours starved. (i) NPF intensity, NPF-cell activity (CaLexA), and fraction of CaLexA-active cells in 24-h-starved and 2-h- and 6-h-sugar-re-fed mated females measured by calcium-LexA reporter system, aggregated on a per-gut basis; n = 8 guts per condition. (j) NPF staining intensity in midguts of mated females with 15 hours’ EEC knockdown of Mondo (29 oC inactivation of GAL80TS) and following 6-hour re-activation of Mondo expression (18 oC to renature GAL80TS) on a per-gut basis; 15 h at 29 oC: n = 12 EEC > , n = 14 EEC > Mondoi; 6 h at 18 oC: n = 17 EEC > , n = 18 EEC > Mondoi. (k) Transcript levels of NPF in midguts from fed mated females; n = 6 samples of five tissues each. All animals were mated females, except in (e). Bars represent mean±SEM. Box plots indicate minimum, 25th percentile, median, 75th percentile, and maximum values. ns, non-significant. a, b, c, h, j, k: Two-tailed unpaired Mann-Whitney U test. d, f, g: Two-tailed unpaired Student’s t test. e, i: One-way Kruskal-Wallis ANOVA with Dunn’s multiple-comparisons test. Source data
Extended Data Fig. 4
Extended Data Fig. 4. Knockdown of NPFR in the fat body leads to increased food intake after starvation, reduced starvation resistance, and lower glycogen stores.
(a) Food intake measured by dye assay (medium containing 9% sugar and 8% yeast); n = 8 Cg > , n = 10 Cg > NPFRiTRiP. (b) Survival during starvation (n = 100 Cg > , n = 50 Cg > NPFRiTRiP). (c) Glycogen levels in fed and 15-hour-starved females; all n = 10. All animals were mated females. Bars represent mean±SEM. ns, non-significant. a, c: Two-tailed unpaired Student’s t test. b: Gehan-Breslow-Wilcoxon test. Source data
Extended Data Fig. 5
Extended Data Fig. 5. Knockdown of NPFR in the AKH-producing cells leads to increased preference for and intake of dietary sugar.
(a) Consumption preference using two-choice dye assay; n = 19 DILP2 > , n = 20 DILP2 > NPFRiTRiP. (b) Consumption of 10% sucrose measured by CAFÉ assay; n = 15 AKH > , n = 16 AKH > NPFRiTRiP. (c) Consumption preference for 1% vs. 10% sucrose solution measured by CAFÉ assay; n = 18 NPFRiTRiP/+, n = 16 AKH > NPFRiTRiP. (d,e) Consumption of 10% sucrose measured over 6 hours and 24 hours by CAFÉ assay; n = 18 NPFRiTRiP/+, n = 16 AKH > NPFRiTRiP. (f) Consumption preference using two-choice dye assay; n = 15 AKH > , n = 17 AKH > NPFRiTRiP. All animals were mated females. Bars represent mean±SEM. Box plots indicate minimum, 25th percentile, median, 75th percentile, and maximum values. ns, non-significant. a, d, e, f: Two-tailed unpaired Mann-Whitney U test. b, c: Two-tailed unpaired Student’s t test. Source data
Extended Data Fig. 6
Extended Data Fig. 6. Alteration of AKH signaling leads to increased yeast intake in females, not males, without metabolic effects, indicating sexual dimorphism in AKH effects on feeding preferences.
(a,b). Hemolymph glucose and TAG levels in mated females at 29 °C for TrpA1 activation; (a) all n = 12, (b) n = 12 AKH > , n = 11 AKH > TrpA1, n = 12 AKH > TrpA1 + AKH, n = 11 AKH > TrpA1 + AKHi. (c) Yeast consumption measured by dye assay in mated female flies; n = 18 AKHts > , n = 19 AKHts > AKHiKK. (d) Yeast intake of males measured over 24 hours by CAFÉ assay. Left panel, AKH knockdown; right panel, AKH mutant; n = 12 AKH > , n = 11 AKH > AKHiKK, n = 11 w1118, n = 15 AKH-/-. (e) AKH staining intensity in virgin and mated females with SPR knockdown in the ppk+ neurons; n = 16 ppk > SPRi virgins, n = 17 ppk > SPRi mated females. Note that animals were injected with hemolymph-like buffer without NPF peptide. (f) Yeast consumption measured in fed virgin females using dye assay, at 29 °C for TrpA1 activation; n = 12 AKH > , n = 12 AKH > TrpA1, n = 12 AKH > TrpA1 + AKH, n = 11 AKH > TrpA1 + AKHi). (g) Cumulative behavioural preference of virgin females after 15 hours of starvation or of fed mated females using flyPAD. Lines represent the mean and shading indicates SEM. Virgins: n = 23 AKH > , n = 21 AKH > AKHiKK. Mated females: n = 22 w1118, n = 16 AKH-/-. (h,i) Injection of NPF peptide into the hemolymph of 3-days-yeast-deprived mated females with NPFR knockdown in the APCs (h) or 15-h starved AKH mutant virgin females (i) using two-choice dye assay; n = 13 AKH > NPFRiTRiP, n = 12 AKH > NPFRiTRiP with NPF injection, n = 23 AKH-/-, n = 27 AKH-/- with NPF injection. Bars represent mean±SEM. Box plots indicate minimum, 25th percentile, median, 75th percentile, and maximum values. ns, non-significant. a, b, f: One-way ANOVA with Tukey’s multiple-comparisons test. c, e, g, h, i: Two-tailed unpaired Mann-Whitney U test. d: Two-tailed unpaired Student’s t test. Source data

Comment in

Similar articles

Cited by

References

    1. Itskov PM, Ribeiro C. The dilemmas of the gourmet fly: the molecular and neuronal mechanisms of feeding and nutrient decision making in Drosophila. Front Neurosci. 2013;7:12. - PMC - PubMed
    1. Koyama T, Texada MJ, Halberg KA, Rewitz K. Metabolism and growth adaptation to environmental conditions in Drosophila. Cell. Mol. Life Sci. 2020;77:4523–4551. - PMC - PubMed
    1. Richter CP. Increased salt appetite in adrenalectomized rats. Am. J. Physiol. 1936;115:155–161.
    1. Richter CP. Total self regulatory functions of animals and human beings. Harvey Lect. Ser. 1943;38:63–103.
    1. Khan, M. S. et al. Protein appetite at the interface between nutrient sensing and physiological homeostasis. Nutrients10.3390/nu13114103 (2021). - PMC - PubMed

Publication types

LinkOut - more resources