. 2023 Apr;41(4):569-576.
doi: 10.1038/s41587-022-01519-4. Epub 2022 Nov 7.

MINSTED nanoscopy enters the Ångström localization range

Affiliations

MINSTED nanoscopy enters the Ångström localization range

Michael Weber et al. Nat Biotechnol. 2023 Apr.

Abstract

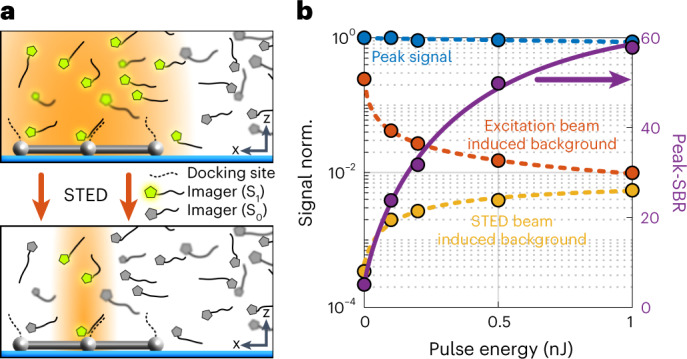
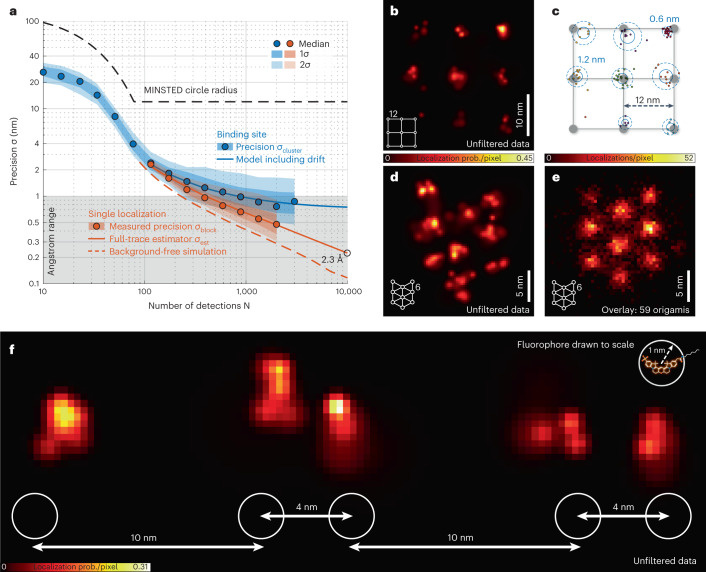
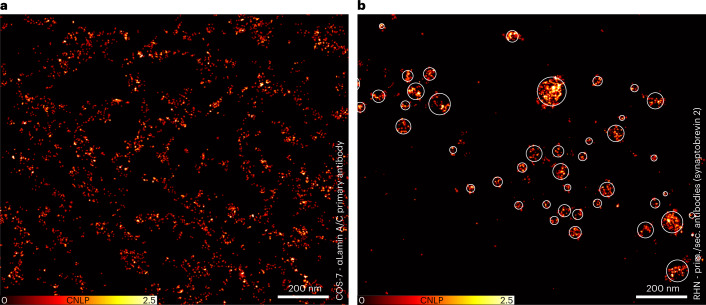
Super-resolution techniques have achieved localization precisions in the nanometer regime. Here we report all-optical, room temperature localization of fluorophores with precision in the Ångström range. We built on the concept of MINSTED nanoscopy where precision is increased by encircling the fluorophore with the low-intensity central region of a stimulated emission depletion (STED) donut beam while constantly increasing the absolute donut power. By blue-shifting the STED beam and separating fluorophores by on/off switching, individual fluorophores bound to a DNA strand are localized with σ = 4.7 Å, corresponding to a fraction of the fluorophore size, with only 2,000 detected photons. MINSTED fluorescence nanoscopy with single-digit nanometer resolution is exemplified by imaging nuclear pore complexes and the distribution of nuclear lamin in mammalian cells labeled by transient DNA hybridization. Because our experiments yield a localization precision σ = 2.3 Å, estimated for 10,000 detected photons, we anticipate that MINSTED will open up new areas of application in the study of macromolecular complexes in cells.


Conflict of interest statement

The Max Planck Society holds patents on selected procedures and embodiments of MINSTED, benefitting H.v.d.E., M L., M.W. and S.W.H. The remaining authors declare no competing interests.

Figures

Fig. 1
Fig. 1. Blue-shifted MINSTED.
a, Qualitative fluorescence and absorption spectra of the fluorophore Cy3B, including our selection of wavelength for excitation (560 nm, green) and de-excitation by stimulated emission (636 nm, red). Reaching well into the emission peak, the cross-section for stimulated emission amounts to 28% of its global maximum, at the expense of slight ‘direct’ excitation of ground state Cy3B fluorophores by the donut-shaped STED beam (inset). b, Blue-shifting the wavelength of the donut (lower donut has shorter wavelength) for a given power sharpens the central peak of the effective PSF of the STED microscope but gives rise to a pedestal. c, The pedestal leads to weak fluorescence from bystander fluorophores, thus compromising the contrast in standard STED imaging (left). Because only one fluorophore is active in MINSTED, the pedestal is ineffectual (right), meaning that the benefits of the blue-shifted STED wavelength can be exploited. d, Schematic of the MINSTED setup: originating from a 636-nm emitting laser diode, the STED 1.4-ns pulses are amplified by a Pr3+ doped fiber pumped with 450-nm laser diode, deflected by a dichroic mirror (DM1), converted into a donut by a phase plate and aligned with a laser emitting 200-ps pulses for excitation at 560 nm. The co-aligned beams are steered in the focal plane of the objective lens by an EOD, whereas the quarter-wave plate (λ/4) ensures circular polarization. Fluorescence collected from the sample is de-scanned, spatially filtered by a pinhole (PH) and detected.
Fig. 2
Fig. 2. Contrast and resolution of blue-shifted STED.
a, Confocal and STED comparison images of cellular vimentin immunolabeled with Cy3B using 636-nm wavelength for STED. Note the haze around the vimentin fiber images due to the E-PSF pedestal. b, Corresponding fluorescence image produced by ‘direct’ excitation with the STED beam. In both a and b, a STED pulse energy of 0.5 nJ was applied. c, E-PSF with central profile and 24-nm FWHM at STED pulse energy E = 1 nJ, measured with immobilized single Cy3B molecules. d, FWHM of E-PSF as a function of E; FWHM measured with standard 775-nm STED beam on Atto 647N molecules is displayed for comparison.
Fig. 3
Fig. 3. Combining STED with on/off switching and labeling by DNA hybridization.
a, Fluorophores (pentagons in gray and highlighted in green when able to fluoresce) attached to single-stranded DNA diffusing in solution, sporadically binding to molecular targets having complementary DNA strands; here the target is a DNA origami represented by gray spheres and sticks. The region in which fluorescence is possible (that is, E-PSF region) is shown in orange for the confocal case (top panel) and the STED case (lower panel). Suppression of the fluorescence of the quickly diffusing fluorophores by STED increases the ratio between the fluorescence signal of bound (on) and diffusing (off) fluorophores. The increased on/off ratio enhances the detection of single bound fluorophores. Conversely, it can be used to increase the concentration of diffusing fluorophores so to increase the imaging speed. b, Peak fluorescence from single DNA-bound Cy3B fluorophores (blue), fluorescence from diffusing fluorophores with excitation and STED, subtracted the STED-only signal. This is considered as the signal produced from the center peak of the E-PSF by the diffusing fluorophores (red), and STED beam induced fluorescence of the diffusing fluorophores (orange) as a function of the STED pulse energy E. The SBR increases by a factor >10 over that of confocal microscopy due to application of E = 1-nJ STED pulses.
Fig. 4
Fig. 4. Localization precision and resolution in MINSTED nanoscopy.
a, Localization precision (points: median; shaded areas: ±1 and ±2 standard deviations) measured from many consecutive binding events on clustered binding sites (blue) on DNA origami grids of 12-nm periodicity and for each binding event individually (red). Blue points and shades are displayed only if computed from at least ten clusters. The red solid line shows the estimated localization precision for the individual events; resulting from that, instabilities are considered to reconstruct the cluster data (blue solid line). Simulated localizations without background are shown as the red dashed line. b, MINSTED image of rectangular binding site pattern of 12-nm periodicity and the pertinent localization distribution in c. Each localization is represented by its estimated position. Blue circles correspond to 1 (solid) and 2 (dashed) standard deviations of the estimated binding site position. The cluster identity is color-coded. d, MINSTED image of 3 × 3 hexagonal DNA origami with internal distances of 6 nm. e, Overlay of 59 MINSTED images of the origami pattern from d, completely resolving the periodically arranged bindings of 6-nm mutual distance. The data were filtered according to Supplementary Table 1. f, Binding sites of 4-nm distance are fully resolved by MINSTED; sketch of the underlying origami design is shown below. The circles of 2-nm diameter represent the extent of the Cy3B molecules whose structure is drawn to scale (upper-right corner) to highlight the relationship between the localization precision and the fluorophore size.
Fig. 5
Fig. 5. Blue-shifted MINSTED imaging of nuclear pores.
a, MINSTED image of the nuclear surface of a HeLa P2 cell expressing nuclear pore protein NUP96 endogenously tagged with sfGFP and labeled with nanobody against GFP, offering a DNA binding site for hybridization with a complementary DNA strand labeled with the fluorophore Cy3B. bd, Excerpts of individual NPC images from a, as indicated in the boxed region, highlighting the median localization precision of 0.9 nm. As NUP96 occurs in four copies per one-eighth of the eight-fold rotationally symmetric NPC, each ‘corner’ is expected to harbor up to four binding sites, which agrees well with the several individual dots in the images. e, Occupancy of the NPC’s eight asymmetric subunits displays a mean of 6.8. f, The average diameter formed by the Cy3B signal distribution is 112 ± 6 nm. g, NUP96 protein structure model extracted from cryo-ET data of NPCs from cryo-milled DLD-1 cells. The 2D projected positions of the NUP96 C-termini are marked by dots in green (DLD-1), cyan (isolated HeLa NPCs) and magenta (cryo-milled HEK293 NPCs). h, Overlay image of 81 HeLa NPC MINSTED images renders the NPC’s expected eight-fold symmetry, with each corner displaying an elongation along the circumference, indicative of the slightly staggered arrangement of the NUP96 polypeptides adjacent to each other in each of the NPC’s octagonal subunits. i, Coverage of the obtained MINSTED localizations relative to the cryo-ET data, considering different distances between NUP96 and fluorophore (same colors as in g). j, Superimposition of the DLD-1 cryo-ET model and MINSTED overlay, considering a NUP96-to-fluorophore distance of 7 nm. ad were rendered by displaying the individual localizations by Gaussian functions with an amplitude of unity and a standard deviation corresponding to the localization precision (Methods); we denote this as the cumulative normalized localization probability (CNLP).
Fig. 6
Fig. 6. Blue-shifted MINSTED imaging of lamin and synaptic vesicles.
a, Imaging of lamin A/C exemplifies the application of MINSTED at high labeling densities. b, MINSTED image of synaptic vesicles in neurons represented by primary and secondary antibody-tagged synaptobrevin 2. The shown clusters of single fluorophore events yield images of tagged synaptic vesicles that appear as entities of 37 ± 24 nm in diameter (4σ). Images were rendered by displaying the individual localizations by Gaussian functions with standard deviation corresponding to the localization precision (Methods). CNLP, cumulative normalized localization probability.

Comment in

  • Optical microscopy gets down to angstroms.
    Tortarolo G, Manley S. Tortarolo G, et al. Nat Biotechnol. 2023 Apr;41(4):473-474. doi: 10.1038/s41587-022-01544-3. Nat Biotechnol. 2023. PMID: 36344839 No abstract available.

References

    1. Hell SW, Wichmann J. Breaking the diffraction resolution limit by stimulated emission: stimulated-emission-depletion fluorescence microscopy. Opt. Lett. 1994;19:780–782. doi: 10.1364/OL.19.000780. - DOI - PubMed
    1. Balzarotti F, et al. Nanometer resolution imaging and tracking of fluorescent molecules with minimal photon fluxes. Science. 2017;355:606–612. doi: 10.1126/science.aak9913. - DOI - PubMed
    1. Weber M, et al. MINSTED fluorescence localization and nanoscopy. Nat. Photonics. 2021;15:361–366. doi: 10.1038/s41566-021-00774-2. - DOI - PMC - PubMed
    1. Rust MJ, Bates M, Zhuang X. Sub-diffraction-limit imaging by stochastic optical reconstruction microscopy (STORM) Nat. Methods. 2006;3:793–796. doi: 10.1038/nmeth929. - DOI - PMC - PubMed
    1. Weisenburger S, et al. Cryogenic optical localization provides 3D protein structure data with Angstrom resolution. Nat. Methods. 2017;14:141–144. doi: 10.1038/nmeth.4141. - DOI - PubMed

Publication types