

Unveiling a hotspot of genetic diversity in southern Italy for the endangered Hermann's tortoise Testudo hermanni
- PMID: 36344915
- PMCID: PMC9641751
- DOI: 10.1186/s12862-022-02075-w
Unveiling a hotspot of genetic diversity in southern Italy for the endangered Hermann's tortoise Testudo hermanni
Abstract
Background: Hotspots of intraspecific genetic diversity represent invaluable resources for species to cope with environmental changes, and their identification is increasingly recognized as a major goal of conservation ecology research. However, even for iconic and endangered species, conservation strategies are often planned without thorough information on the geographic patterns of genetic variation. Here, we investigated the spatial patterns of genetic variation of the endangered Hermann's tortoise Testudo hermanni in the Italian Peninsula by genotyping 174 individuals at 7 microsatellite loci, with the aim to contribute to planning effective conservation strategies.
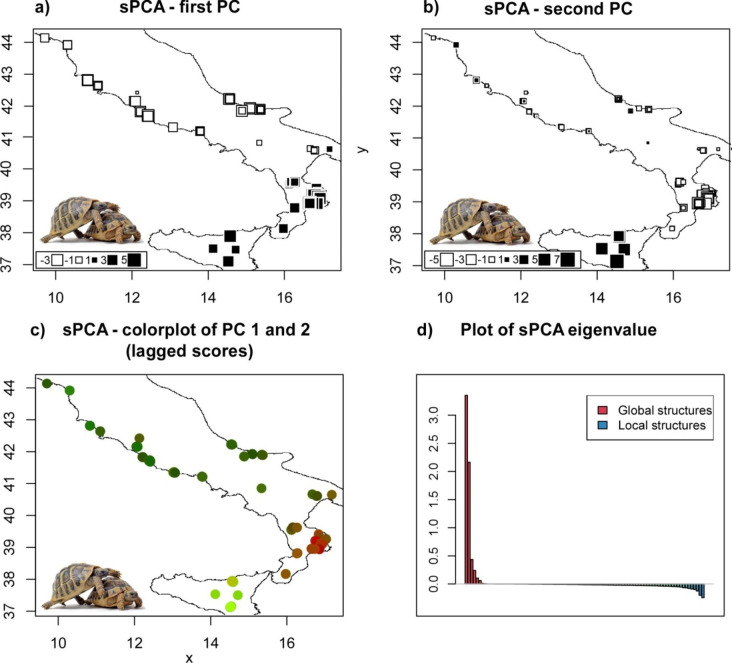
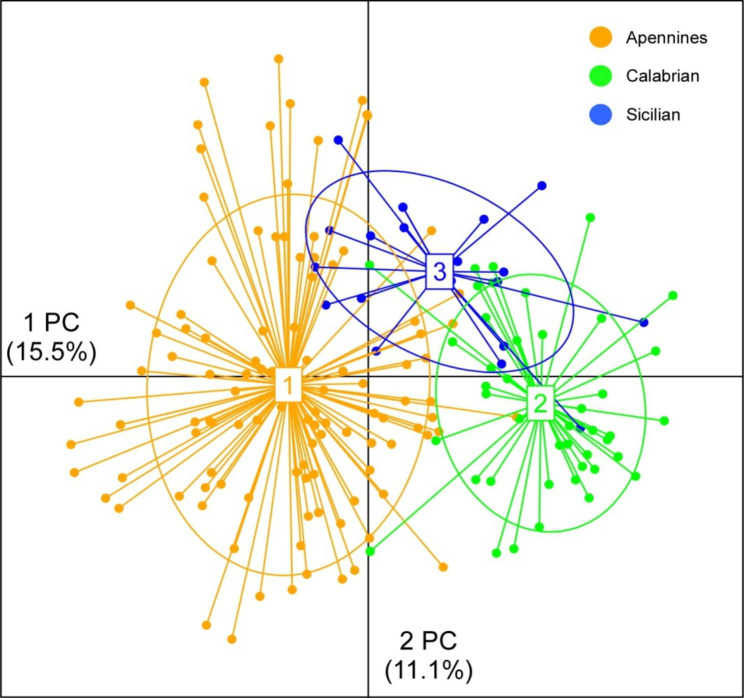
Results: Ordination-based and Bayesian clustering analyses consistently identified three main genetic clusters, one spread in the central and northern part of the peninsula, and two restricted to southern Italy and Sicily, respectively. The highest levels of genetic diversity were found in populations of the southern cluster and, in particular, at the northern edges of its distribution (He > 0.6, Ar > 2.8 ), that correspond to areas of putative secondary contact and admixture between distinct lineages. Our results clearly identify a hotspot of genetic diversity for the Hermann's tortoise in southern Italy.
Conclusion: We inferred the evolutionary history and the spatial patterns of genetic variation of the Hermann's tortoise in the Italian Peninsula. We identified three main genetic clusters along the peninsula and a hotspot of intraspecific diversity in southern Italy. Our results underline the urgent need for conservation actions to warrant the long-term persistence of viable tortoise populations in this area. Furthrmore, these data add further evidence to the role of southern Italy as a biodiversity hotspot for temperate fauna, claiming for higher consideration of this area in large scale conservation programs.
Keywords: Biodiversity hotspots; Conservation genetics; Genetic structure; Italian Peninsula; Phylogeography; Threatened species.
© 2022. The Author(s).
Conflict of interest statement
The Authors declare no competing interests.
Figures

Similar articles
-
Genetic variation and population structure in the endangered Hermann's tortoise: the roles of geography and human-mediated processes.J Hered. 2014 Jan-Feb;105(1):70-81. doi: 10.1093/jhered/est071. Epub 2013 Oct 23. J Hered. 2014. PMID: 24154535
-
Mapping the geographic origin of captive and confiscated Hermann's tortoises: A genetic toolkit for conservation and forensic analyses.Forensic Sci Int Genet. 2021 Mar;51:102447. doi: 10.1016/j.fsigen.2020.102447. Epub 2020 Dec 25. Forensic Sci Int Genet. 2021. PMID: 33401133
-
Hematological values for adult eastern Hermann's tortoise (Testudo hermanni boettgeri) in semi-natural conditions.J Vet Diagn Invest. 2015 Jan;27(1):68-73. doi: 10.1177/1040638714561251. J Vet Diagn Invest. 2015. PMID: 25525140
-
Multiple paternity and sperm storage in captive Hermann's tortoises, Testudo hermanni boettgeri determined from amniotic fluid adhering to the eggshell.Mol Cell Probes. 2015 Aug;29(4):254-7. doi: 10.1016/j.mcp.2015.05.009. Epub 2015 May 21. Mol Cell Probes. 2015. PMID: 26003400
-
Morphological Divergence of Hermann's Tortoise (Testudo hermanni boettgeri Mojsisovits, 1889) in Albania.Animals (Basel). 2021 Jan 9;11(1):134. doi: 10.3390/ani11010134. Animals (Basel). 2021. PMID: 33435316 Free PMC article.
References
-
- Petit RJ, Aguinagalde I, de Beaulieu J-L, Bittkau C, Brewer S, Cheddadi R, et al. Glacial refugia: hotspots but not melting pots of genetic diversity. Science. 2003;300:1563–5. - PubMed
-
- Zachos FE, Habel JC. Biodiversity hotspots: distribution and protection of conservation priority areas. Springer Science & Business Media; 2011.
-
- Lande R, Shannon S. The role of genetic variation in adaptation and population persistence in a changing environment. Evolution. 1996;50:434. - PubMed
Publication types
MeSH terms
LinkOut - more resources
Full Text Sources
Research Materials
Miscellaneous