. 2022 Nov 7;23(1):234.
doi: 10.1186/s13059-022-02807-7.

Mapping responsive genomic elements to heat stress in a maize diversity panel

Affiliations

Mapping responsive genomic elements to heat stress in a maize diversity panel

Zhikai Liang et al. Genome Biol. .

Abstract

Background: Many plant species exhibit genetic variation for coping with environmental stress. However, there are still limited approaches to effectively uncover the genomic region that regulates distinct responsive patterns of the gene across multiple varieties within the same species under abiotic stress.

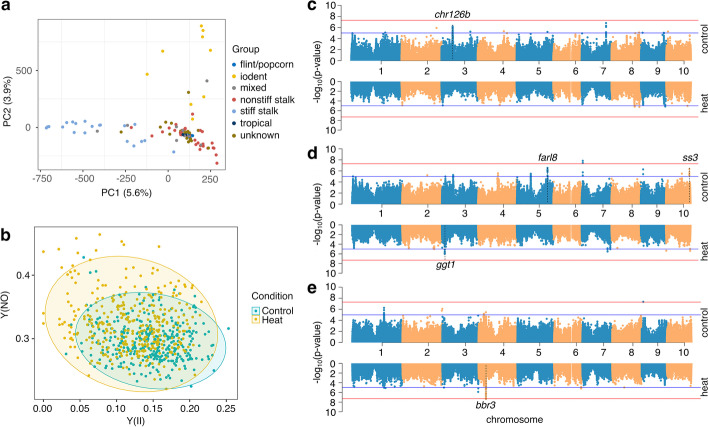
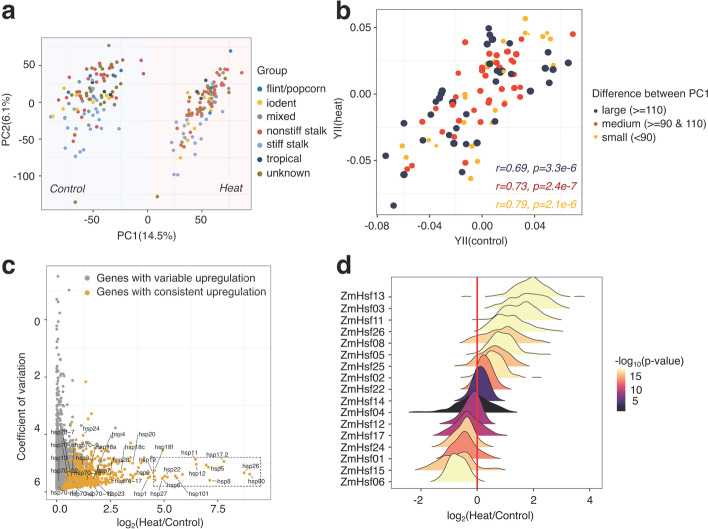
Results: By analyzing the transcriptomes of more than 100 maize inbreds, we reveal many cis- and trans-acting eQTLs that influence the expression response to heat stress. The cis-acting eQTLs in response to heat stress are identified in genes with differential responses to heat stress between genotypes as well as genes that are only expressed under heat stress. The cis-acting variants for heat stress-responsive expression likely result from distinct promoter activities, and the differential heat responses of the alleles are confirmed for selected genes using transient expression assays. Global footprinting of transcription factor binding is performed in control and heat stress conditions to document regions with heat-enriched transcription factor binding occupancies.

Conclusions: Footprints enriched near proximal regions of characterized heat-responsive genes in a large association panel can be utilized for prioritizing functional genomic regions that regulate genotype-specific responses under heat stress.

Keywords: Chromatin footprints; Heat stress; Maize; Response eGene; Response eQTL.


Conflict of interest statement

The authors declared that they have no competing interests.

Figures

Fig. 1
Fig. 1
Phenotypic responses to heat stress within a maize diversity panel. a Genotypic variants segregated 102 genotypes (including 5 flint/popcorn, 9 iodent, 9 mixed, 32 non-stiff stalk, 20 stiff stalk, 3 tropical, and 24 unknown) employed in this study using principal component analysis. b Plants showed a distinct pattern using two photosynthetic parameters—Y(NO) and Y(II)—measured under control and heat conditions. c Associated loci were detected under control and heat conditions using GWAS for Y(NPQ). Two thresholds including 2.2e−6 (blue) and 1.1e−7 (red) were applied for detecting significantly associated loci; d Same as c for Y(NO); e Same as c for Y(II)
Fig. 2
Fig. 2
Transcriptomic diversity of studied maize genotypes between heat and control conditions. a The PCA analysis separated expressions of identical genotypes in control and heat conditions using normalized read counts of expressed genes. b Genotypes with variable levels of absolute PC1 differences were split into three classes: large, medium, and small. The correlation of BLUPs generated from Y(II) in control and heat condition was separately calculated. c Across 102 studied genotypes, we identified upregulated genes based on the fold change of median expression value between heat and control. We then visualized these upregulated genes based on their coefficient of variations and log2 fold change of heat to control. Heat shock proteins were labeled in this graph and the blocking area demonstrated a clustered region with heat shock proteins. d Distributions of log2 fold changes of heat-to-control normalized expression values for heat shock factors identified in this study
Fig. 3
Fig. 3
Detected responsive genes and eQTLs in the studied maize diversity panel. a Correlation of effect sizes of selected top significant cis-eQTLs versus identified responsive eQTLs (reQTLs). b Distribution of cis-eQTLs nearby annotated genes. Control cis-eQTLs represented cis-eQTLs identified using control expression data and heat cis-eQTLs represented cis-eQTLs identified using heat expression data. The y-axis indicated the proportion of each cis-eQTL class. TSS: transcription start sites; TTS: transcription terminal sites. c Log2 fold changes between heat and control for identified responsive genes (reGenes). The x-axis indicated log2 fold changes of expressions of genes carrying reference allele between heat and control. The y-axis indicated log2 fold changes of expressions of gene carrying alternative alleles between heat and control. The CPM of 1 was added to both denominator and numerator to the ratio to enable the calculation. Based on the ratio of median expression in heat to control, reGenes were subclassified into RefControl, RefHeat, AltControl, and AltHeat. d–g Four cases show different responsive genes. Associated SNP in each subpanel was indicated as “SChr_Pos.” For example, “S4_80278057” was the SNP located on 80,278,057 bp position of chromosome 4. h Connected curve indicates the significant p-value of interacted term between SNPs and targeted reGene (bold). The heatmap shows the pairwise correlation of SNPs in the displayed genomic region. Blue star indicates the top selected cis-eQTL for genome-wide reQTL identification analysis. i Same as the panel h, but showing gene Zm00001d030549
Fig. 4
Fig. 4
Utilization of TF footprints to identify heat response cis-regulatory elements. a An example of differential TF footprints near a B73 heat-responsive gene. Raw read coverages were normalized by RPGC (reads per genomic content) methods. b Same as a, but for another heat-responsive gene, Zm00001d016255 (ZmHSF13). c Normalized MOA-seq signals near 1kb extended regions of putative summits of heat-enriched TF footprints in three biological replicates under control and heat conditions. d Compared 793 commonly upregulated genes with 11,501 background genes for presence and absence of heat-enriched TF footprints. e Comparisons of interaction terms between SNPs located inside and outside of defined TF footprints located within different categories of reGenes and their 1-kb flanking regions. The definition of RefControl, RefHeat, AltControl, and AltHeat were the same as Fig. 3c. ** indicates p-value < 1e−2 and ns indicates insignificant
Fig. 5
Fig. 5
Validations of allele-specific regulatory genomic regions for reGenes. a–c The genome browsers showed MOA-seq signals of reGenes between heat and control in B73 genome coordinates. MOA-seq genome coverage was normalized using the RPGC methods to make tracks comparable. Zm00001d005114; Zm00001d017187; Zm00001d042183; d–f Expressions of assessed reGenes in genotypes associated with the detected reQTL as reference allele or alternative allele under control and heat condition. Zm00001d005114; Zm00001d0171873; Zm00001d04218; g–h Raw read ratios of g Mo17- or h Oh43-specific allele to B73-specific allele of Zm00001d005114 or Zm00001d042183 in the hybrid MB or OB under control and heat condition (n=3). i–k Around 2kb putative promoter region per reGene was amplified separately from B73 genotypes and relative alternative genotypes for the dual luciferase assay (n=3). i Promoters amplified from Zm00001d005114 and Zm00014a020759. j Promoters amplified from Zm00001d017187 and Zm00035ab255850. k Promoters amplified from Zm00001d042183 and Zm00039ab143500

References

    1. Des Marais DL, Hernandez KM, Juenger TE. Genotype-by-environment interaction and plasticity: Exploring genomic responses of plants to the abiotic environment. Annu Rev Ecol Evol Syst. 2013;44:5–29.
    1. Tigchelaar M, Battisti DS, Naylor RL, Ray DK. Future warming increases global maize yield variability with implications for food security. Proc Natl Acad Sci U S A. 2018;115:6644–6649. - PMC - PubMed
    1. Niu S, et al. Heat stress after pollination reduces kernel number in maize by insufficient assimilates. Front Genet. 2021;12:728166. - PMC - PubMed
    1. Lizaso JI, et al. Impact of high temperatures in maize: phenology and yield components. Field Crop Res. 2018;216:129–140.
    1. Fahad S, et al. Crop Production under Drought and Heat Stress: Plant Responses and Management Options. Front Plant Sci. 2017;8:1147. - PMC - PubMed

Publication types

MeSH terms

Substances

LinkOut - more resources