. 2023 Feb 24;192(3):397-407.
doi: 10.1093/aje/kwac193.

Physical Activity Trends Among Adults in a National Mobile Health Program: A Population-Based Cohort Study of 411,528 Adults

Affiliations

Physical Activity Trends Among Adults in a National Mobile Health Program: A Population-Based Cohort Study of 411,528 Adults

Gregory Ang et al. Am J Epidemiol. .

Abstract

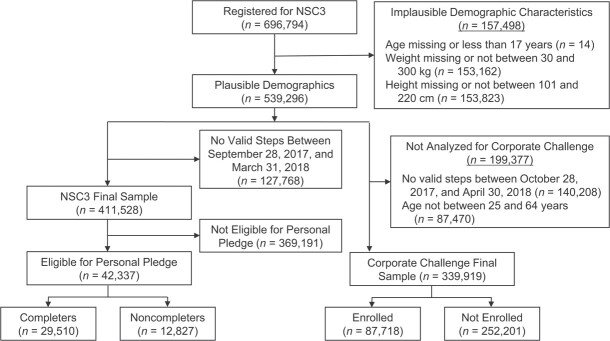
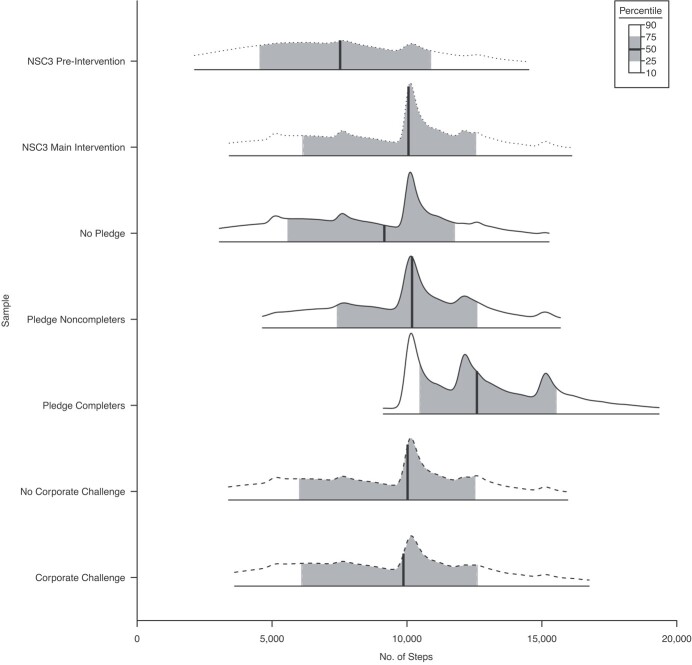
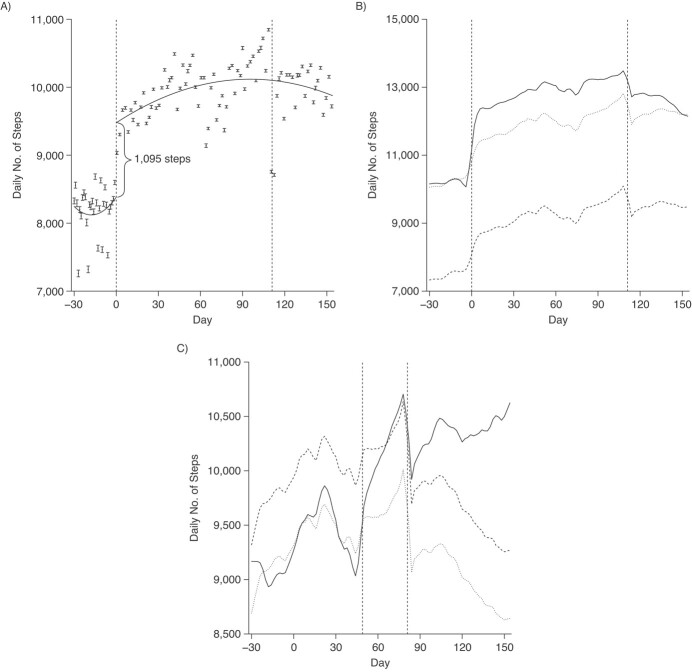
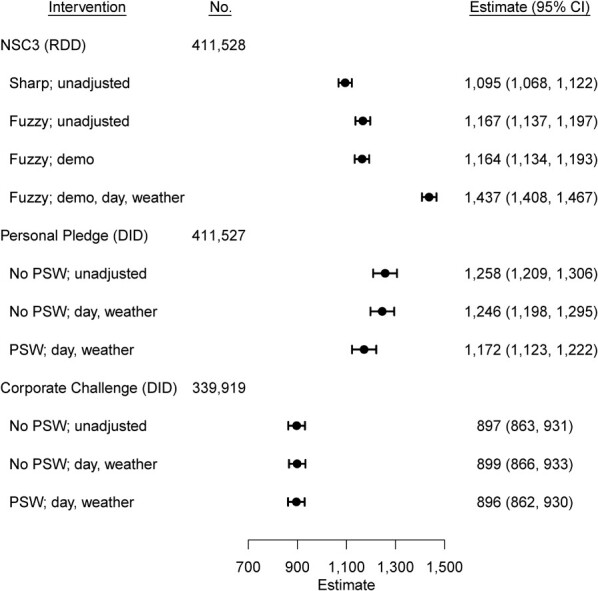
Physical inactivity is a global public health challenge, and effective, large-scale interventions are needed. We examined the effectiveness of a population-wide mobile health (mHealth) intervention in Singapore, National Steps Challenge Season 3 (NSC3) and 2 booster challenges (Personal Pledge and Corporate Challenge). The study includes 411,528 participants. We used regression discontinuity design and difference-in-difference with fixed-effects regression to examine the association of NSC3 and the additional booster challenges on daily step counts. Participants tended to be female (58.5%), with an average age of 41.5 years (standard deviation, 13.9) and body mass index (weight (kg)/height (m)2) of 23.8 (standard deviation, 4.5). We observed that NSC3 was associated with a mean increase of 1,437 steps (95% confidence interval (CI): 1,408, 1,467) per day. Enrollments in Personal Pledge and Corporate Challenge were associated with additional mean increases of 1,172 (95% CI: 1,123, 1,222) and 896 (95% CI: 862, 930) steps per day, respectively. For NSC3, the associated mean increase in the step counts across different sex and age groups varied, with greater increases for female participants and those in the oldest age group. We provide real-world evidence suggesting that NSC3 was associated with improvements in participants' step counts. Results suggest NSC3 is an effective and appealing population-wide mHealth physical activity intervention.

Keywords: difference-in-difference; mHealth; mobile health; nationwide program; physical activity; regression discontinuity design.


Figures

Figure 1
Figure 1
Flow diagram for data identification and access for National Steps Challenge Season 3 (NSC3), Personal Pledge, and Corporate Challenge, Singapore, 2017–2018. For NSC3 and Personal Pledge, the pre-intervention period was from September 28, 2017, to October 27, 2017 (days −30 to −1), and the intervention period was from October 28, 2017, to March 31, 2018 (days 0–154). n = 411,528 participants had at least 1 step count record between September 28, 2017, and March 31, 2018 (days −30 to 154). For Corporate Challenge, the pre-intervention period was from October 28, 2017, to January 14, 2018 (days 0–78), and the intervention period was from January 15, 2018, to April 30, 2018 (days 79–184). Following Organisation for Economic Co-operation and Development (48) classifications, participants were split into 3 groups: ages 15–24 years (those just entering the labor market following education), ages 25–54 (those in their prime working lives), and ages 55–64 (those passing the peak of their career and approaching retirement). n = 339,919 participants aged 25–64 had at least 1 step record between October 28, 2017, and April 30, 2018 (days 0–184).
Figure 2
Figure 2
Distribution of daily step counts for National Steps Challenge Season 3 (NSC3) pre-intervention (n = 165,320), NSC3 main intervention (n = 395,428), Personal Pledge (no pledge (non–Pledge participants, n = 353,105), Pledge noncompleters (n = 12,812), Pledge completers (n = 29,510)), and Corporate Challenge (not enrolled (n = 196,344) and enrolled (n = 69,574)) during relevant intervention periods, Singapore, 2017–2018. The bars show the 10th, 25th, 50th (median), 75th, and 90th percentiles of the distribution, and 96.1% of NSC3 participants, 95.6% of non–Pledge participants, 99.9% of Pledge noncompleters, 100% of Pledge completers, 77.9% of non–Corporate Challenge participants, and 79.3% of Corporate Challenge participants had data during the intervention periods.
Figure 3
Figure 3
Steps trends in National Steps Challenge Season 3 (NSC3), Singapore, 2017–2018. A) Regression discontinuity design plot of daily step counts with quadratic time trends from September 28, 2017, to March 31, 2018 (days −30 to 154), n = 411,528. B) Daily steps mean trend of participants in Personal Pledge and not in Personal Pledge from September 28, 2017, to March 31, 2018 (days −30 to 154), n = 411,527. C) Daily steps mean trend of participants in Corporate Challenge and not in Corporate Challenge from October 28, 2017, to April 30, 2018 (days 0 to 184), n = 339,919. For (A), the observations are binned, and 95% nonparametric confidence intervals are computed (49). The solid boxes in the middle of the error bar represent the mean; the “whiskers” represent the 95% confidence interval. The solid line is the prediction based on the mean from the sharp regression discontinuity design model. For (B) and (C), the solid line is the mean trend of the participants who enrolled in the Personal Pledge (or Corporate Challenge). The dashed line is the mean trend of the participants who did not enroll in the Personal Pledge (or Corporate Challenge). The dotted line is the mean trend of the participants who did not enroll in the Personal Pledge (or Corporate Challenge) shifted downward by the difference between the two means at the start of Personal Pledge (Corporate Challenge). The increase in steps from Personal Pledge (or Corporate Challenge) is the difference between the solid line and the dotted line. One participant was dropped because information on whether they took part in the Personal Pledge and Corporate Challenge was not available. An additional participant was dropped for the Corporate Challenge as the registration date was after the start date. Key dates: NSC3 started on October 28, 2017, and ended on March 31, 2018 (days 0 to 154); Lunar New Year started on February 16, 2018, and ended on February 17, 2018 (days 111 to 112); Personal Pledge started on October 28, 2017, and ended on March 31, 2018 (days 0 to 154); Corporate Challenge started on January 15, 2018, and ended on April 30, 2018 (days 79 to 184).
Figure 4
Figure 4
Estimated steps increase using regression discontinuity design (RDD) of National Steps Challenge Season 3 (NSC3) daily step counts from September 28, 2017, to March 31, 2018 (days −30 to 154), difference-in-difference (DID) with propensity score–weighted (PSW) fixed-effects regression of Personal Pledge daily step counts from September 28, 2017, to March 31, 2018 (days −30 to 154), and difference-in-difference with propensity score weighted fixed-effects regression of Corporate Challenge daily step counts from October 28, 2017, to April 30, 2018 (days 0 to 184), adjusting for different covariates. The covariates are demographic characteristics (demo: age group, sex, body mass index group); day (day of the week); weather (maximum temperature, log (1 + rainfall)). 95% confidence intervals (CIs) were constructed using standard errors clustered at the participant level. Sharp RDD assumes that every participant signed up on the start date of NSC3, October 28, 2017 (day 0). In contrast, fuzzy RDD relaxes this assumption by allowing participants to register at any time during the NSC3 intervention period. Fixed-effects regression controls for all time-invariant variables, such as demographic characteristics. One participant was dropped because information on whether they took part in Personal Pledge and Corporate Challenge was not available. An additional participant was dropped for the Corporate Challenge as the registration date was after the start date.

Similar articles

Cited by

References

    1. Lee IM, Bauman AE, Blair SN, et al. . Annual deaths attributable to physical inactivity: whither the missing 2 million? Lancet. 2013;381(9871):992–993. - PubMed
    1. Lee IM, Shiroma EJ, Lobelo F, et al. . Effect of physical inactivity on major non-communicable diseases worldwide: an analysis of burden of disease and life expectancy. Lancet. 2012;380(9838):219–229. - PMC - PubMed
    1. Bull FC, Al-Ansari SS, Biddle S, et al. . World Health Organization 2020 guidelines on physical activity and sedentary behaviour. Br J Sports Med. 2020;54(24):1451–1462. - PMC - PubMed
    1. Guthold R, Stevens GA, Riley LM, et al. . Worldwide trends in insufficient physical activity from 2001 to 2016: a pooled analysis of 358 population-based surveys with 1.9 million participants. Lancet Glob Health. 2018;6(10):e1077–e1086. - PubMed
    1. World Health Organization . Global Action Plan on Physical Activity 2018–2030: More Active People for a Healthier World .Geneva, Switzerland: World Health Organization; 2018. http://apps.who.int/iris/bitstream/handle/10665/272722/9789241514187-eng.... Accessed May 25, 2022.

Publication types