

Unruptured brain arteriovenous malformations causing seizures localize to one common brain network
- PMID: 36345215
- PMCID: PMC10100023
- DOI: 10.1002/jnr.25142
Unruptured brain arteriovenous malformations causing seizures localize to one common brain network
Abstract
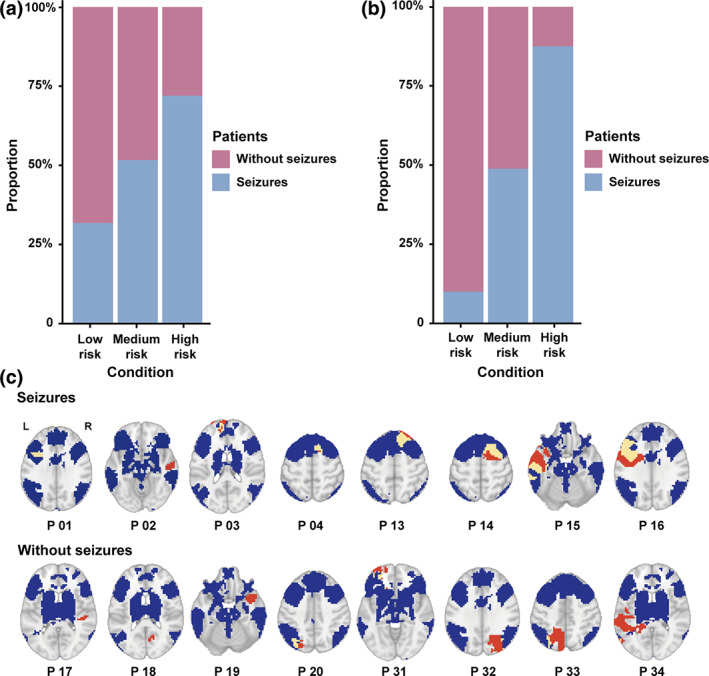
Seizures are a frequent symptom of unruptured brain arteriovenous malformations (bAVMs). However, the brain regions responsible for these seizures remain unclear. To identify the brain regions causally involved in bAVM-related seizures, we retrospectively reviewed 220 patients with unruptured bAVMs. Using voxel-based lesion-symptom mapping (VLSM) analyses, we tested whether individual brain regions were associated with unruptured bAVM-related seizures. The result revealed that unruptured bAVMs causing seizures are anatomically heterogeneous at the voxel level. Subsequently, lesion network mapping (LNM) analyses was performed to determine whether bAVMs causing seizures belonged to a distributed brain network. LNM analyses indicated that these lesions were located in a functional network characterized by connectivity to the left caudate and precuneus. Moreover, the discrimination performance of the identified seizure network was evaluated in discovery set by calculating the individualized network damage score and was tested in validation set. Based on the calculated network damage scores, patients were divided into low-, medium-, and high-risk groups. The prevalence of seizures significantly differed among the three risk categories in both discovery (p = .003) and validation set (p = .004). Finally, we calculated the percentage of voxels in the canonical resting-state networks that overlapped with the seizure-susceptible brain regions to investigate the involvement of resting-state networks. With an involvement percentage over 50%, the frontoparietal control (82.9%), limbic function (76.7%), and default mode network (69.3%) were considered to be impacted in bAVM-related seizures. Our study identified the seizure-susceptible brain regions for unruptured bAVMs, which could be a plausible neuroimaging biomarker in predicting possible seizures.
Keywords: brain arteriovenous malformations; lesion network mapping; seizures; voxel-based lesion-symptom mapping.
© 2022 The Authors. Journal of Neuroscience Research published by Wiley Periodicals LLC.
Conflict of interest statement
The authors declare no conflict of interest.
Figures


References
-
- Alexander‐Bloch, A. F. , Shou, H. , Liu, S. , Satterthwaite, T. D. , Glahn, D. C. , Shinohara, R. T. , Vandekar, S. N. , & Raznahan, A. (2018). On testing for spatial correspondence between maps of human brain structure and function. NeuroImage, 178, 540–551. 10.1016/j.neuroimage.2018.05.070 - DOI - PMC - PubMed
-
- Benson, J. C. , Chiu, S. , Flemming, K. , Nasr, D. M. , Lanzino, G. , & Brinjikji, W. (2020). MR characteristics of unruptured intracranial arteriovenous malformations associated with seizure as initial clinical presentation. Journal of NeuroInterventional Surgery, 12(2), 186–191. 10.1136/neurintsurg-2019-015021 - DOI - PubMed
-
- Blumenfeld, H. , McNally, K. A. , Vanderhill, S. D. , Paige, A. L. , Chung, R. , Davis, K. , Norden, A. D. , Stokking, R. , Studholme, C. , Novotny, E. J., Jr. , Zubal, I. G. , & Spencer, S. S. (2004). Positive and negative network correlations in temporal lobe epilepsy. Cerebral Cortex, 14(8), 892–902. 10.1093/cercor/bhh048 - DOI - PubMed
-
- Blumenfeld, H. , Varghese, G. I. , Purcaro, M. J. , Motelow, J. E. , Enev, M. , McNally, K. A. , Levin, A. R. , Hirsch, L. J. , Tikofsky, R. , Zubal, I. G. , Paige, A. L. , & Spencer, S. S. (2009). Cortical and subcortical networks in human secondarily generalized tonic‐clonic seizures. Brain, 132(Pt 4), 999–1012. 10.1093/brain/awp028 - DOI - PMC - PubMed
Publication types
MeSH terms
LinkOut - more resources
Full Text Sources
Medical
