

Forecasting on Covid-19 infection waves using a rough set filter driven moving average models
- PMID: 36345324
- PMCID: PMC9628244
- DOI: 10.1016/j.asoc.2022.109750
Forecasting on Covid-19 infection waves using a rough set filter driven moving average models
Abstract
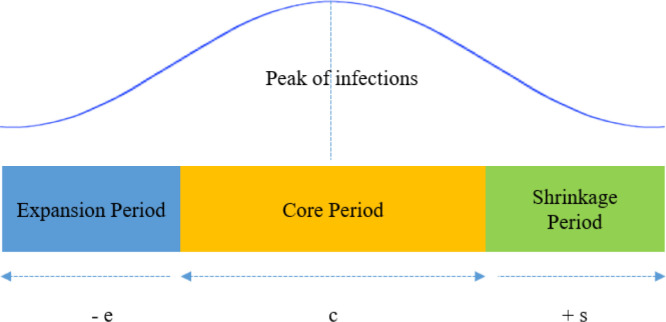
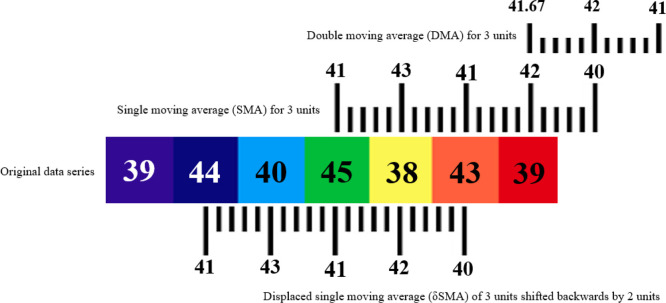
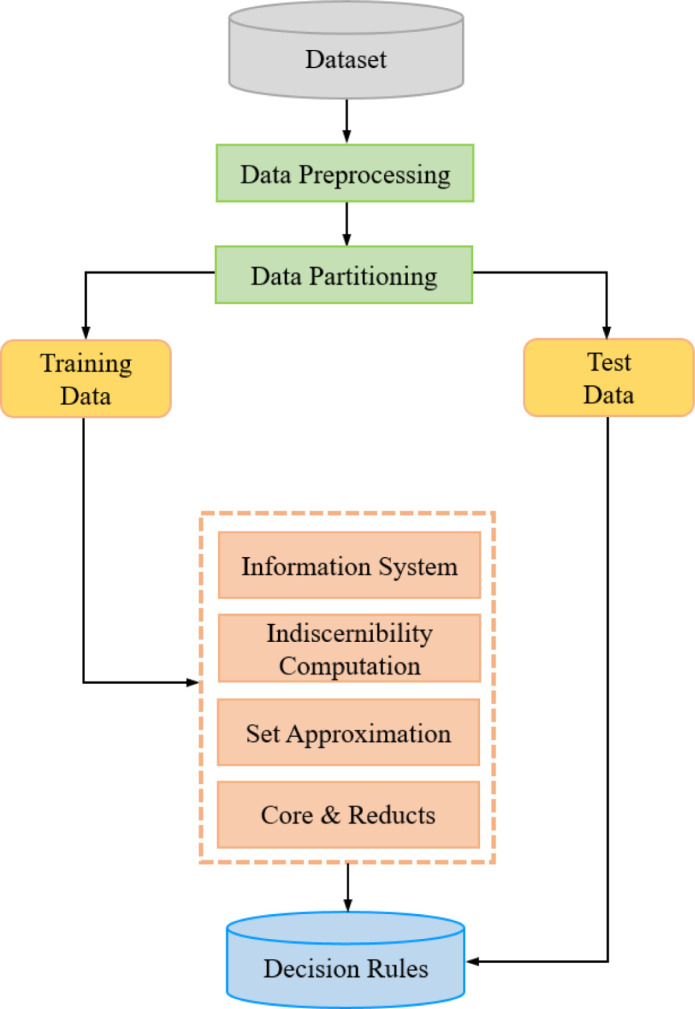
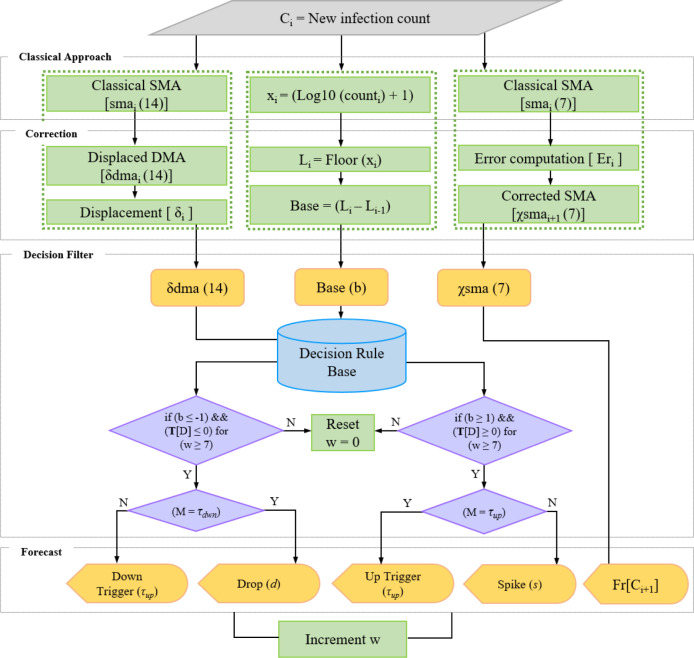
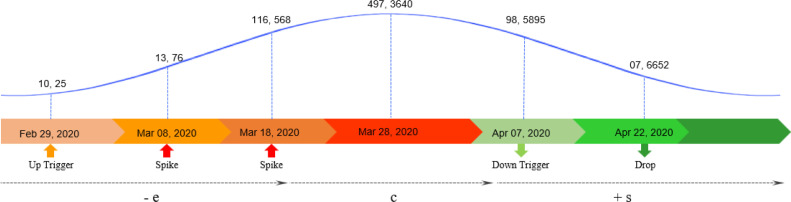
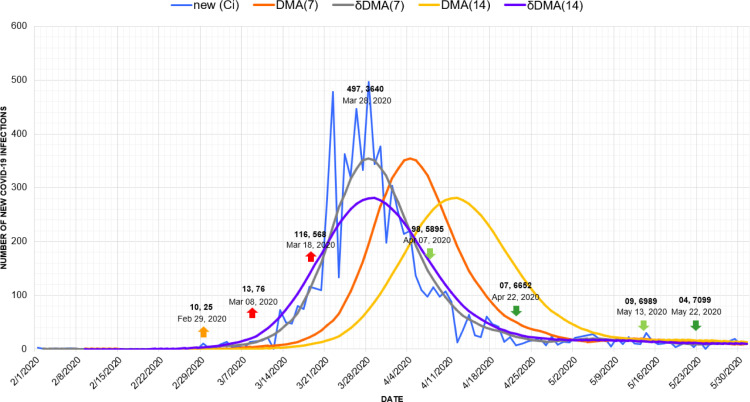
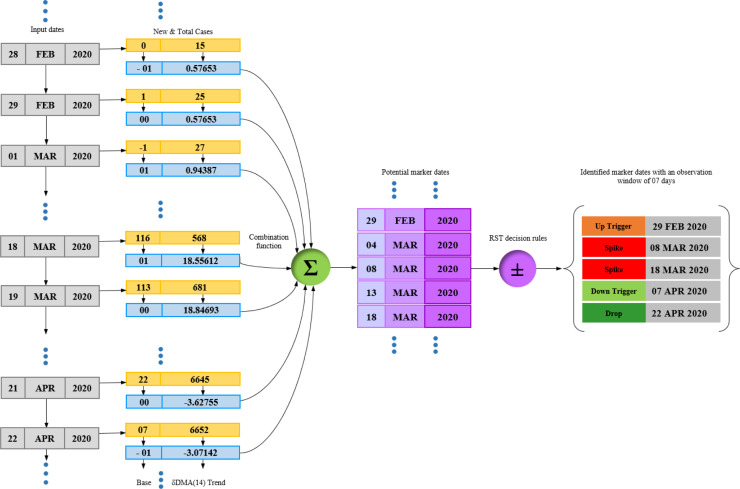
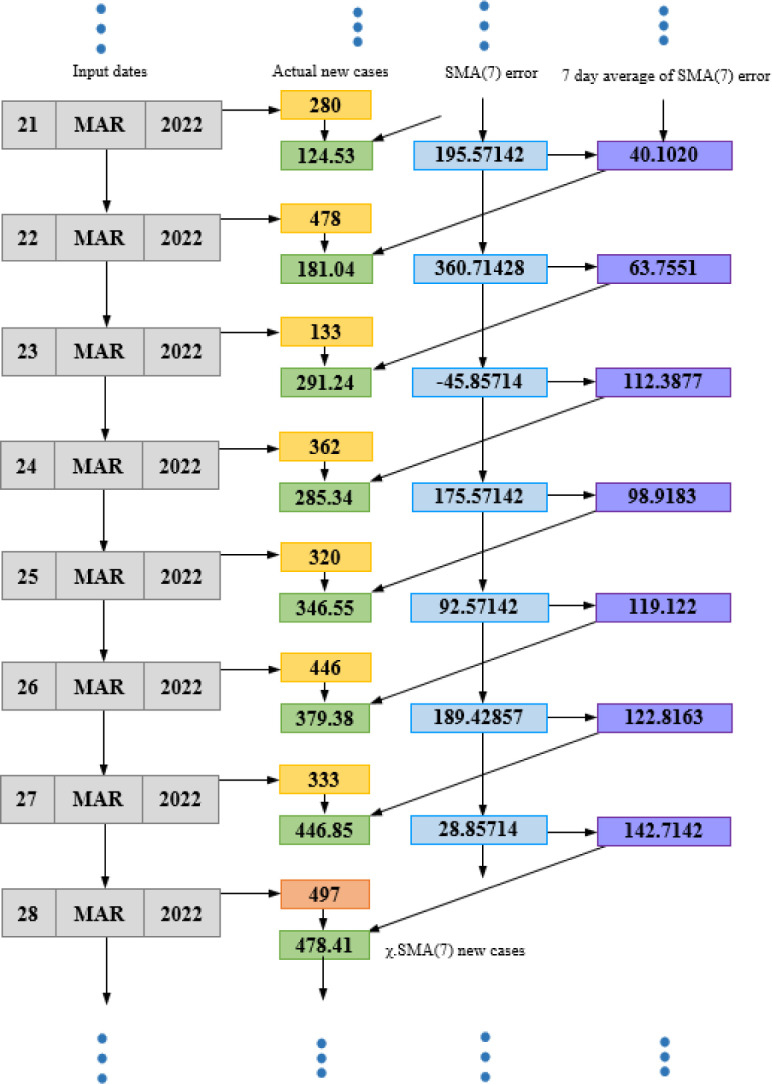
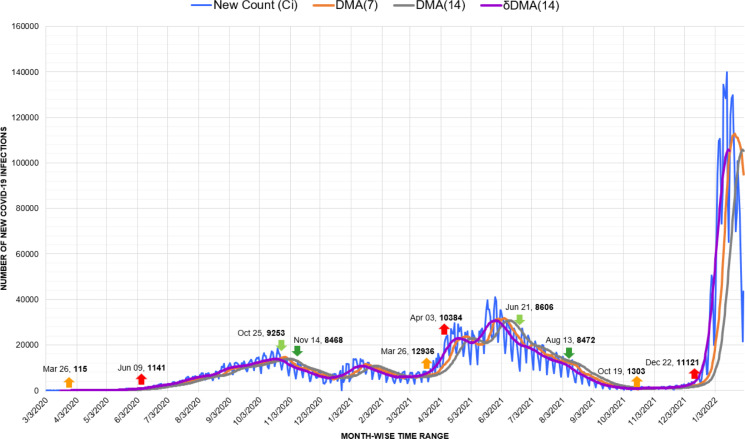
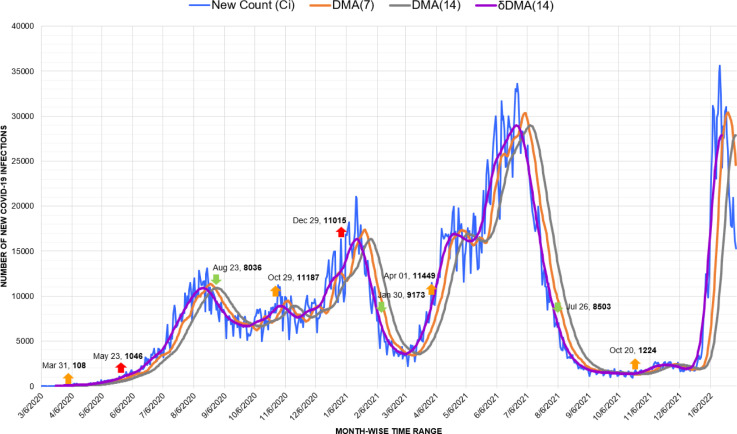
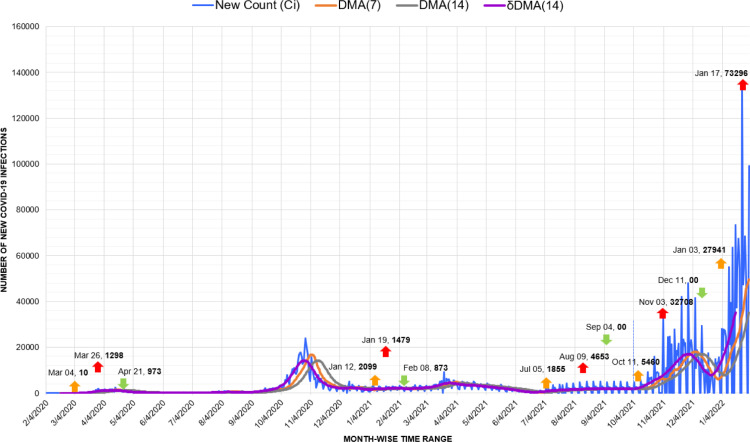
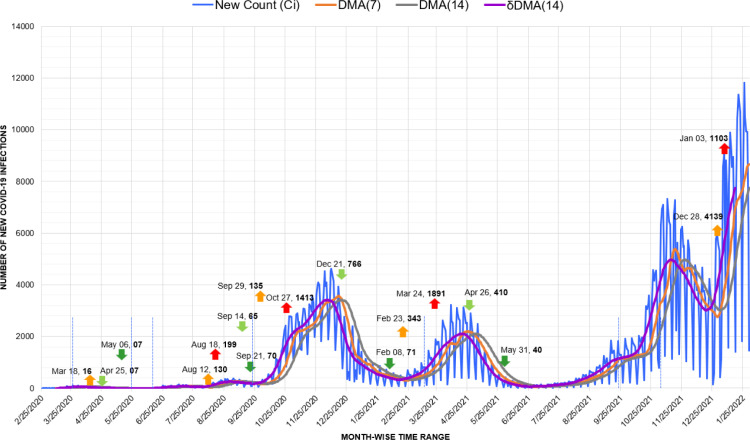
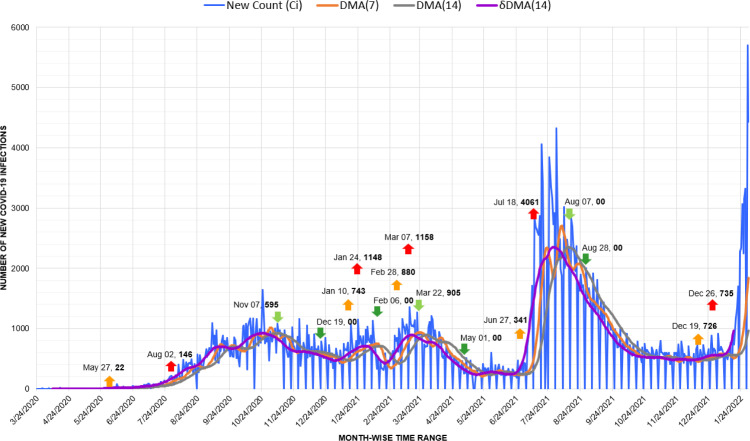
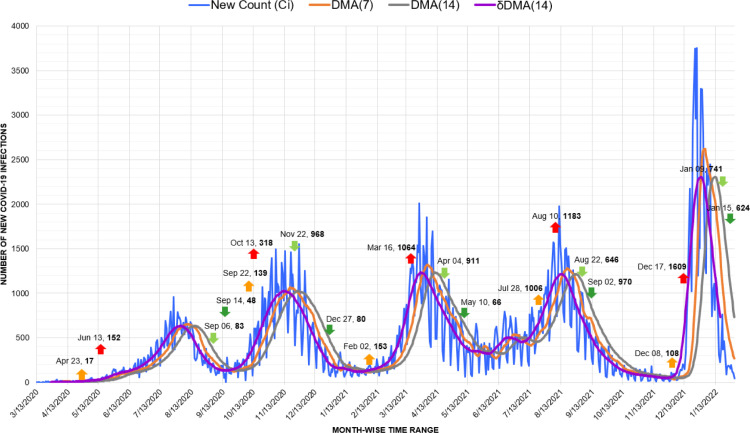
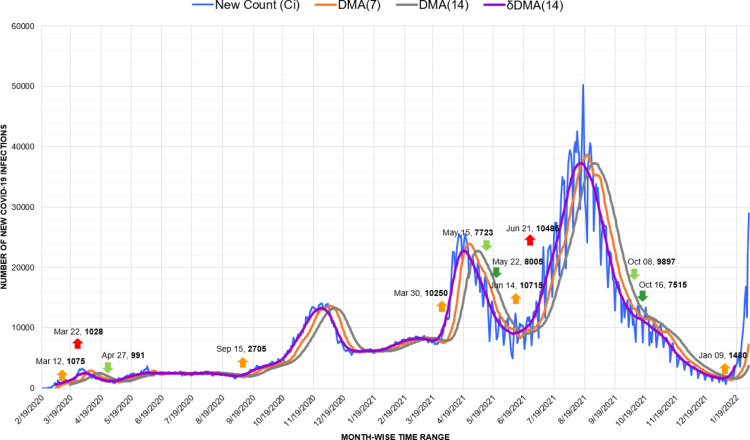
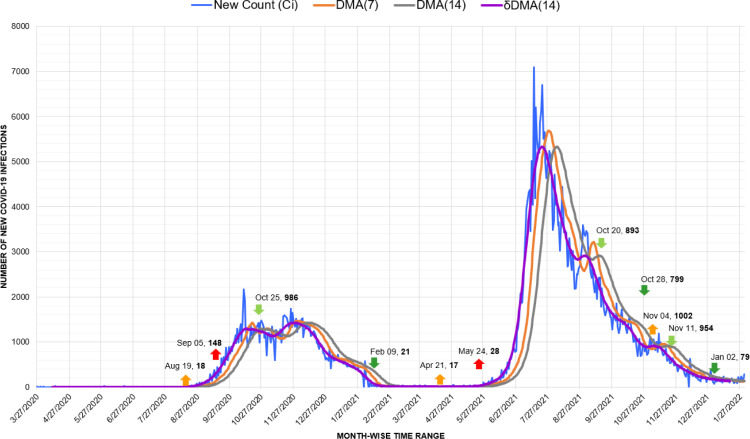
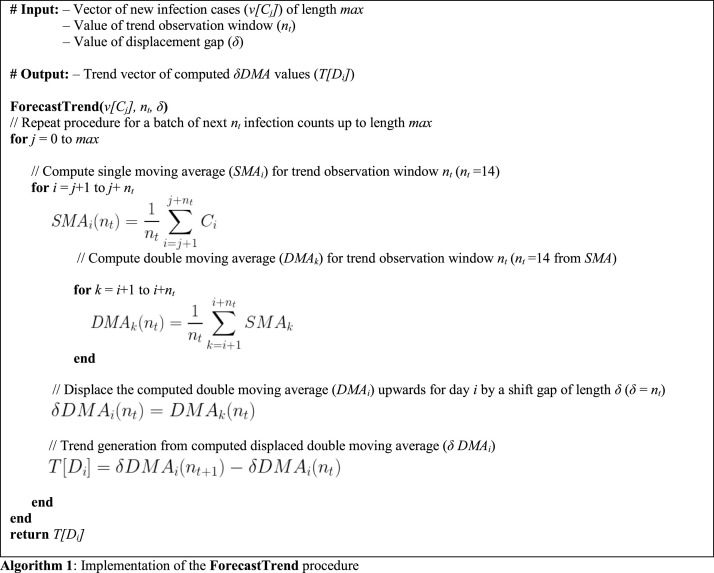
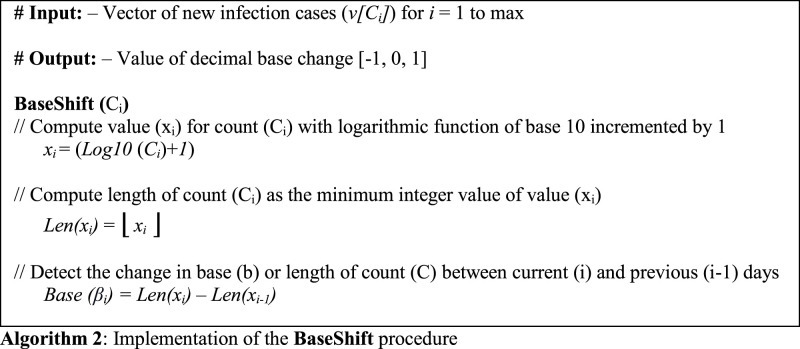
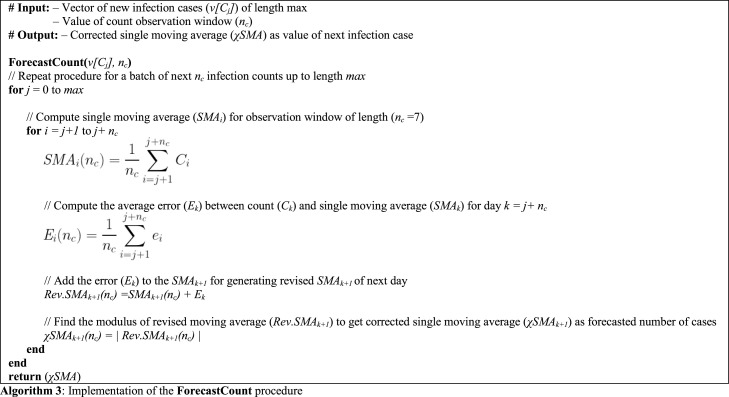
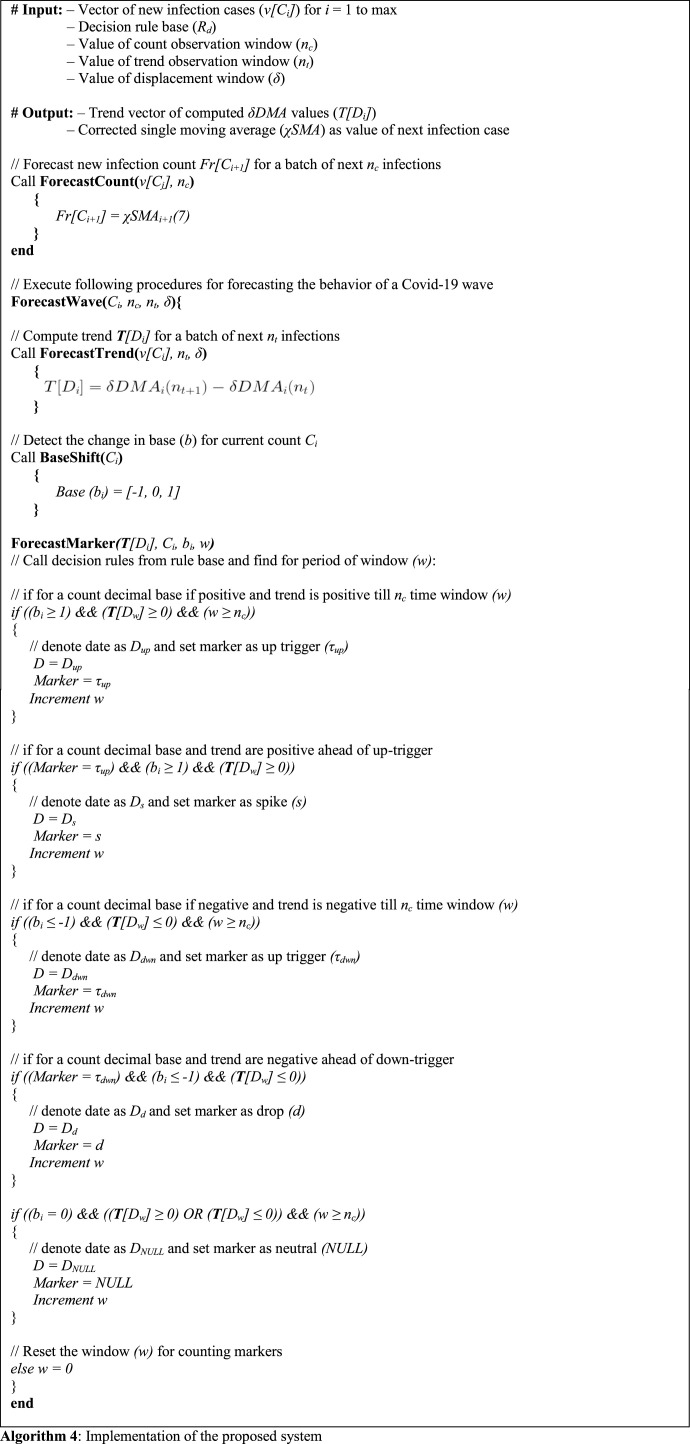
The pandemic outbreak of severe acute respiratory syndrome caused by the Coronavirus 2 disease in 2019, also known as SARS-COV-2 and COVID-19, has claimed over 5.6 million lives till now. The highly infectious nature of the Covid-19 virus has resulted into multiple massive upsurges in counts of new infections termed as 'waves.' These waves consist of numerous rising and falling counts of Covid-19 infection cases with changing dates that confuse analysts and researchers. Due to this confusion, the detection of emergence or drop of Covid waves is currently a subject of intensive research. Hence, we propose an algorithmic framework to forecast the upcoming details of Covid-19 infection waves for a region. The framework consists of a displaced double moving average ( DMA) algorithm for forecasting the start, rise, fall, and end of a Covid-19 wave. The forecast is generated by detection of potential dates with specific counts called 'markers.' This detection of markers is guided by decision rules generated through rough set theory. We also propose a novel 'corrected moving average' ( SMA) technique to forecast the upcoming count of new infections in a region. We implement our proposed framework on a database of Covid-19 infection specifics fetched from 12 countries, namely: Argentina, Colombia, New Zealand, Australia, Cuba, Jamaica, Belgium, Croatia, Libya, Kenya, Iran, and Myanmar. The database consists of day-wise time series of new and total infection counts from the date of first case till 31st January 2022 in each of the countries mentioned above. The DMA algorithm outperforms other baseline techniques in forecasting the rise and fall of Covid-19 waves with a forecast precision of 94.08%. The SMA algorithm also surpasses its counterparts in predicting the counts of new Covid-19 infections for the next day with the least mean absolute percentage error (MAPE) of 36.65%. Our proposed framework can be deployed to forecast the upcoming trends and counts of new Covid-19 infection cases under a minimum observation window of 7 days with high accuracy. With no perceptible impact of countermeasures on the pandemic until now, these forecasts will prove supportive to the administration and medical bodies in scaling and allotment of medical infrastructure and healthcare facilities.
Keywords: Covid-19; Forecast; Moving average; Pandemic; Rough set.
© 2022 Elsevier B.V. All rights reserved.
Conflict of interest statement
The authors declare that they have no known competing financial interests or personal relationships that could have appeared to influence the work reported in this paper.
Figures
Similar articles
-
Short-Range Forecasting of COVID-19 During Early Onset at County, Health District, and State Geographic Levels Using Seven Methods: Comparative Forecasting Study.J Med Internet Res. 2021 Mar 23;23(3):e24925. doi: 10.2196/24925. J Med Internet Res. 2021. PMID: 33621186 Free PMC article.
-
Application of one-, three-, and seven-day forecasts during early onset on the COVID-19 epidemic dataset using moving average, autoregressive, autoregressive moving average, autoregressive integrated moving average, and naïve forecasting methods.Data Brief. 2021 Apr;35:106759. doi: 10.1016/j.dib.2021.106759. Epub 2021 Jan 15. Data Brief. 2021. PMID: 33521186 Free PMC article.
-
A COVID-19 Pandemic Artificial Intelligence-Based System With Deep Learning Forecasting and Automatic Statistical Data Acquisition: Development and Implementation Study.J Med Internet Res. 2021 May 20;23(5):e27806. doi: 10.2196/27806. J Med Internet Res. 2021. PMID: 33900932 Free PMC article.
-
Travel-related control measures to contain the COVID-19 pandemic: a rapid review.Cochrane Database Syst Rev. 2020 Oct 5;10:CD013717. doi: 10.1002/14651858.CD013717. Cochrane Database Syst Rev. 2020. Update in: Cochrane Database Syst Rev. 2021 Mar 25;3:CD013717. doi: 10.1002/14651858.CD013717.pub2. PMID: 33502002 Updated.
-
Forecasting COVID-19 pandemic: Unknown unknowns and predictive monitoring.Technol Forecast Soc Change. 2021 May;166:120602. doi: 10.1016/j.techfore.2021.120602. Epub 2021 Jan 19. Technol Forecast Soc Change. 2021. PMID: 33495665 Free PMC article. Review.
References
-
- Maital S., Barzani E. The global economic impact of Covid-19: A summary of research. Samuel Neaman Inst. Natl. Policy Res. 2020;2020:1–12.
-
- de Villiers C.B., Blackburn L., Cook S., Janus J. 2021. Sars-cov-2 variants. https://www.finddx.org/wp-content/uploads/2021/03/COVID-variants-report-....
LinkOut - more resources
Full Text Sources
Miscellaneous