. 2022 Oct 17;25(11):105378.
doi: 10.1016/j.isci.2022.105378. eCollection 2022 Nov 18.

Longitudinal monitoring of individual infection progression in Drosophila melanogaster

Affiliations

Longitudinal monitoring of individual infection progression in Drosophila melanogaster

Bryan A Ramirez-Corona et al. iScience. .

Abstract

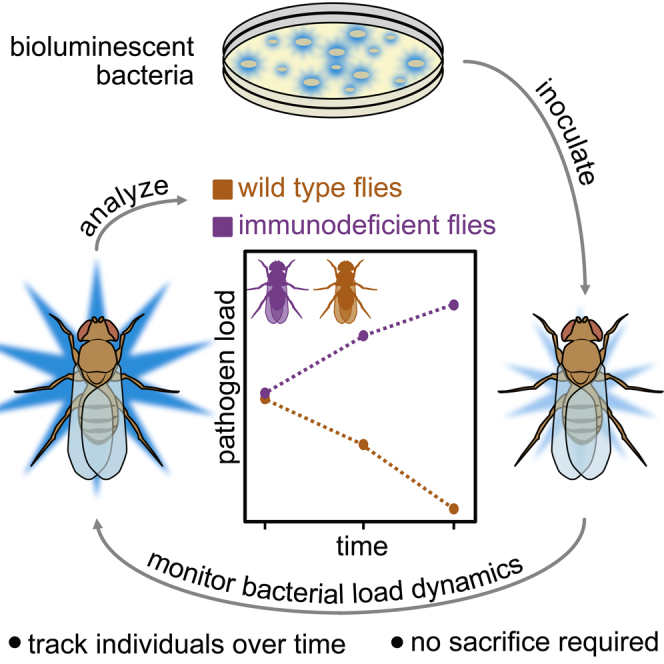
The innate immune system is critical for infection survival. Drosophila melanogaster is a key model for understanding the evolution and dynamics of innate immunity. Current toolsets for fly infection studies are limited in throughput and, because of their destructive nature, cannot generate longitudinal measurements in individual animals. We report a bioluminescent imaging strategy enabling non-invasive characterization of pathogen load. By using Escherichia coli expressing the ilux operon, we demonstrate that photon flux from autobioluminescent bacteria can be used to monitor pathogen loads in individual, living flies. Because animal sacrifice is not necessary to estimate pathogen load, stochastic responses to infection can be characterized in individuals over time. The high temporal resolution of bioluminescence imaging enables visualization of the dynamics of microbial clearance on the hours time-scale. This non-invasive imaging strategy provides a simple and scalable platform to observe changes in pathogen load in vivo over time.

Keywords: Microbiology; Optical imaging.


Conflict of interest statement

All authors declare no competing interests.

Figures

None
Graphical abstract
Figure 1
Figure 1
A method for non-invasive tracking of pathogen load over time (A) Previous methods for determining pathogen load require animal sacrifice. Larger cohorts are required for experiments as several flies must be sacrificed at the desired time points to check infection progression and clearance. (B) This work presents a non-invasive method to track pathogen load over time using bioluminescence. Thus, all flies can be individually monitored over time, allowing for a more comprehensive view of immune response.
Figure 2
Figure 2
Photon flux is monotonically related to bacterial concentration (A) ilux-E.coli were serially diluted in liquid cultures and assayed for photon output. Higher concentrations of bacteria yield higher photon fluxes. Plot shows eight measurements per OD (four biological replicates across two experiments). Well images are representative of the biological replicates. The color scale is in units of photons/second/cm2/steradian. The gray box shows the limit of detection of the imaging instrument. (B) Wild-type flies were injected with different concentrations of ilux-E.coli and assayed for light emission immediately after. CFUs per fly were measured by homogenization of injected flies. A monotonic relationship was observed between radiance and CFUs injected. The graph shows data of 36 biological replicates per infection concentration, across two experiments. Well images above each graph are representative of images of the injected flies. In both experiments, radiance was summed over the entire well to yield flux (photons/second) using the Living Image software.
Figure 3
Figure 3
Bioluminescence can be used to track changes in pathogen load over time (A) Representative well images for different concentrations of bacteria injected in wild-type flies over four days. Higher initial concentrations were cleared to low, but detectable concentrations. Low initial concentrations were cleared below the limit of detection for the imaging instrument. Well images are representative of 48 injected individuals, 12 biological replicates per infection concentration. (B) Average clearance patterns for different concentrations of ilux-E.coli injected in individual flies over time. Photon counts were summed over the entire well where flies resided. The gray box shows the limit of detection of the imaging instrument. Solid colored line represents the average of the cohort. The gray band represents the standard deviation over replicates, dots represent one individual. (C) Individuals display varied routes toward infection clearance, suggesting stochasticity plays a role in infection dynamics. Black dotted line represents the average, and the gray band represents the standard deviation. The gray box shows the limit of detection of the imaging instrument. Solid lines represent routes individuals took toward infection clearance.
Figure 4
Figure 4
Longitudinal tracking of individual flies is possible in wild-type and immune deficient genotypes (A) Representative images of radiance measurements for wild-type (wt) and imd10191 injected with 34 nl of OD = 6 ilux-E.coli. Images show the first 8 h, after which most imd10191 flies perished. Images are representative of 24 injected individuals, 12 biological replicates per genotype. (B) Comparison of population level integrated total flux. The box plots for each genotype at each time point show the median, first and third quartiles, and 1.5 times the inter-quartile range. Time points showing a significant difference (p < 0.05) in means between the two lines are demarked with an asterisk (Welch two-sample t-test). Immunodeficient lines received a 37% lower dose of infection than wt flies because of experimental variation. This significance was lost by hour 1, with imd10191 bacterial load surpassing that of wild-type by hour 2. Data comprise 12 injected individuals. (C) Comparison of wt and imd10191 individual tracks. Individual variation of immune response and pathogen clearance was observed in living flies (solid lines). Deaths are marked by red triangles, and the lines end. The blue dotted line shows the average of the cohort, whereas dark gray lines show the individual paths toward clearance or death. Death histogram shows the pathogen load on death as estimated by total integrated flux. The red line on the imd10191graph also demarcates the average of these values. The light gray line indicates a fly that received a lower-than-average initial dose and that was filtered out in the subsequent analysis. Data shown comprise 12 injected individuals.
Figure 5
Figure 5
Lower initial infection dose yields more variation in time of death of immune-deficient flies Both wild-type (wt) and imd10191 flies were injected with 34 nL of OD = 0.06 ilux-E.coli (n = 48 for each genotype). (A) Representative images of radiance measurements for wt and imd10191 flies injected with ilux-E.coli. Images are representative for 96 individuals (48 biological replicates per genotype) and are shown in 5-h intervals for the first 45 h of infection. (B) Summary of integrated total flux values for the living wt and imd10191 in 5-h intervals for the first 45 h. The box plot for each genotype at each time point shows the median, first and third quartiles, and 1.5 times the inter-quartile range. Timepoints showing a significant difference (p < 0.05) in means between the two lines are demarked with an asterisk (Welch two-sample t-test). By hour 5, the lines show differences in the ability to fight off infection with wild-type flies clearing the infection and imd10191 flies with much higher bacterial loads. (C) Histogram displaying time of death statistics for imd10191 flies. The majority of imd10191 flies died at hour 32, when integrated total flux reached its peak. Death data were compiled from 48 imd10191 individuals.
Figure 6
Figure 6
Individual infection tracking of immune deficient flies shows variation in time to death (A) Individual tracks of infection in live imd10191 flies (black lines, n = 48); deaths are marked as a red triangle and the end of the line. All flies died by hour 48 and the mean radiance on death was 18.6 × 106 (solid red line). Threshold of accurate detection is demarcated with a gray box. The histogram shows the distribution of integrated photon flux (serving as a proxy for pathogen count) of imd10191 flies on death. (B) Individual tracks of infection separated by clusters. Clusters were assigned via hierarchical clustering using Euclidean dissimilarity. Four distinct groups were assigned with cluster 2 and 3 containing the majority of samples (cluster 2 = 29, cluster 3 = 13) and clusters 1 and 4 containing 3 samples each. Data are for 48 imd10191 individuals. (C) Spearman rank correlation (ρ) and the 95% bootstrapped confidence interval (CI) between initial flux and time of death for imd10191 flies. (D) Spearman rank correlation and CI between total flux at hour 20 and time of death. (E) Spearman rank correlation and CI between the log transformed area under the curve (AUC) up until hour 20 and the time of death. The curve here refers to the flux (p/s) versus time curve. In all cases CI of Spearman correlation coefficients were computed by bootstrapping 10,000 synthetic datasets and computing the correlations on these datasets. 2.5 and 97.5 percentile values of the sampled correlations are reported.
Figure 7
Figure 7
Individual infection tracking of wild-type (wt) flies shows two distinct pathways towards bacterial clearance (A) Individual tracks of infection in live flies (black lines). No flies died during this time course. Threshold of accurate detection demarcated with a gray box. (B) Individual tracks of infection are grouped by the presence of a secondary peak during the infection process. Although all flies showed a decrease in bacterial load by the 48-h mark, a subset of flies (n = 10) showed an increase in bacterial load between 10 and 25 h (magenta lines). Dashed lines represent the mean trajectory for the genotype. The noise in some of the later time points is due to a shortening of the acquisition time for these animals, which were housed in the same plate as the highly luminescent immunodeficient animals shown in Figure 6.

References

    1. Alst A.J.V., LeVeque R.M., Martin N., DiRita V.J. JoVE; 2022. JoVE Science Education Database. Microbiology. Growth Curves: Generating Growth Curves Using Colony Forming Units and Optical Density Measurements.
    1. Ayres J.S., Schneider D.S. A signaling protease required for melanization in Drosophila affects resistance and tolerance of infections. PLoS Biol. 2008;6:2764–2773. doi: 10.1371/journal.pbio.0060305. - DOI - PMC - PubMed
    1. Ayres J.S., Freitag N., Schneider D.S. Identification of Drosophila mutants altering defense of and endurance to Listeria monocytogenes infection. Genetics. 2008;178:1807–1815. doi: 10.1534/genetics.107.083782. - DOI - PMC - PubMed
    1. Brandes C., Plautz J.D., Stanewsky R., Jamison C.F., Straume M., Wood K.V., Kay S.A., Hall J.C. Novel features of Drosophila period transcription revealed by real-time luciferase reporting. Neuron. 1996;16:687–692. doi: 10.1016/S0896-6273(00)80088-4. - DOI - PubMed
    1. Brent M.M., Oster I.I. Nutritional substitution -- a new approach to microbial control for Drosophila cultures. Drosoph. Inf. Serv. 1974;52:155–157.