. 2022;2(1):25.
doi: 10.1186/s44149-022-00053-9. Epub 2022 Nov 3.

Altered gene expression in human brain microvascular endothelial cells in response to the infection of influenza H1N1 virus

Affiliations

Altered gene expression in human brain microvascular endothelial cells in response to the infection of influenza H1N1 virus

Doaa Higazy et al. Anim Dis. 2022.

Abstract

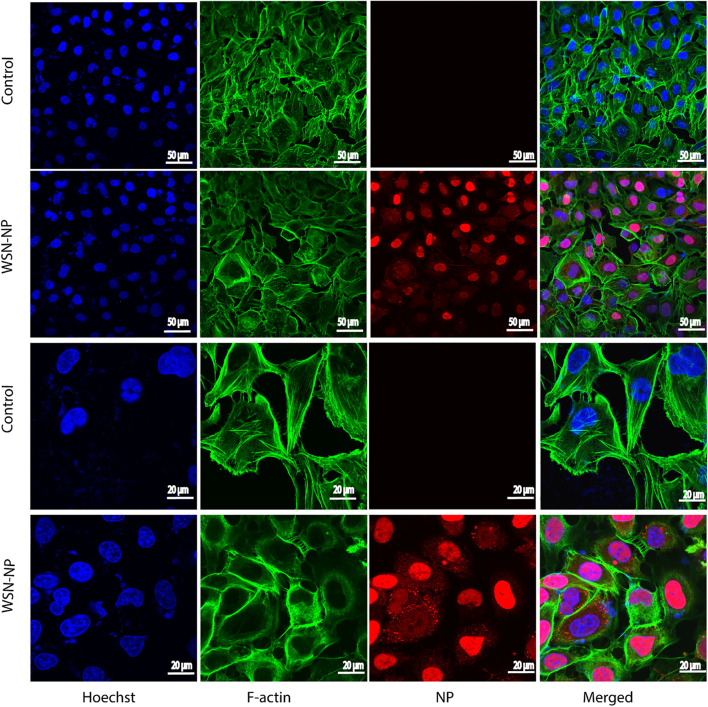
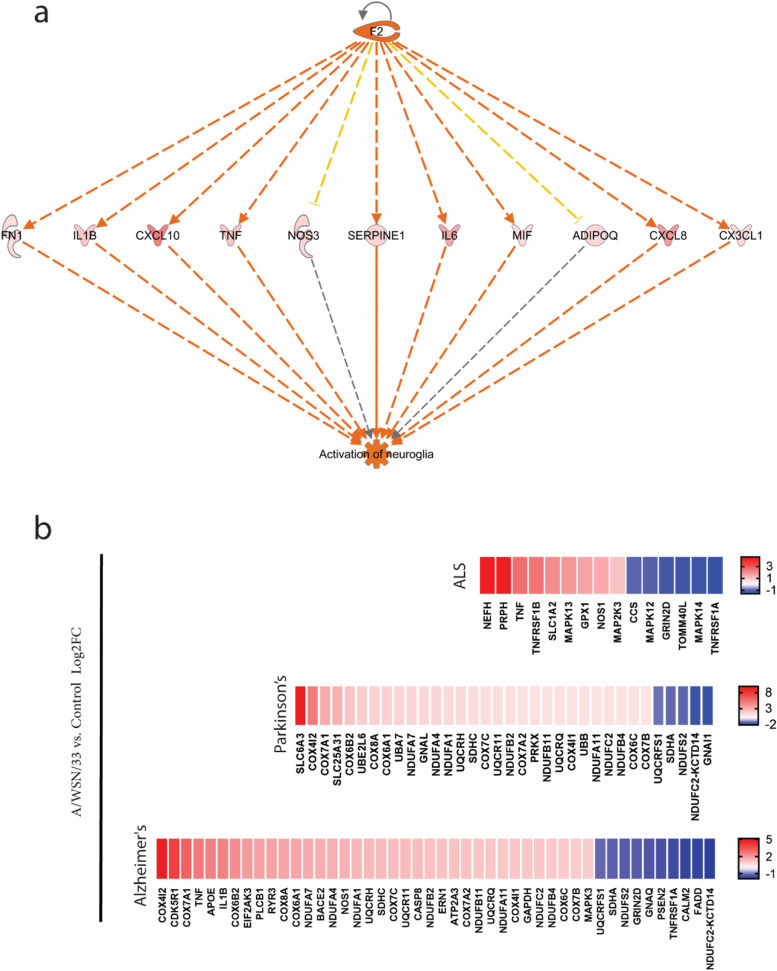
Influenza viruses not only cause respiratory illness, but also have been reported to elicit neurological manifestations following acute viral infection. The central nervous system (CNS) has a specific defense mechanism against pathogens structured by cerebral microvasculature lined with brain endothelial cells to form the blood-brain barrier (BBB). To investigate the response of human brain microvascular endothelial cells (hBMECs) to the Influenza A virus (IAV), we inoculated the cells with the A/WSN/33 (H1N1) virus. We then conducted an RNAseq experiment to determine the changes in gene expression levels and the activated disease pathways following infection. The analysis revealed an effective activation of the innate immune defense by inducing the pattern recognition receptors (PRRs). Along with the production of proinflammatory cytokines, we detected an upregulation of interferons and interferon-stimulated genes, such as IFN-β/λ, ISG15, CXCL11, CXCL3 and IL-6, etc. Moreover, infected hBMECs exhibited a disruption in the cytoskeletal structure both on the transcriptomic and cytological levels. The RNAseq analysis showed different pathways and candidate genes associated with the neuroactive ligand-receptor interaction, neuroinflammation, and neurodegenerative diseases, together with a predicted activation of the neuroglia. Likewise, some genes linked with the mitochondrial structure and function displayed a significantly altered expression. En masse, this data supports that hBMECs could be infected by the IAV, which induces the innate and inflammatory immune response. The results suggest that the influenza virus infection could potentially induce a subsequent aggravation of neurological disorders.

Supplementary information: The online version contains supplementary material available at 10.1186/s44149-022-00053-9.

Keywords: Blood–brain barrier; CNS; Influenza A virus (IAV); Neurodegenerative diseases; RNAseq; hBMECs.


Conflict of interest statement

Competing interestsAuthor Min Cui was not involved in the journal’s review or decisions related to this manuscript. The authors declare that they have no competing interests.

Figures

Fig. 1
Fig. 1
Influenza virus entry and infection to human brain microvascular endothelial cells (hBMECs). a Phase-contrast (Ph) microscopy visualization of hBMECs morphology infected by A/WSN/33 (H1N1) at 0.1 multiplicity of infection (MOI). b RNA extracted from hBMECs and targeted by RT-qPCR to detect NP gene expression at different time points, error bars indicate standard deviation. c the cells were lysed for NP detection by western blotting at indicated time points post-infection. Data were shown as means ± SEM from three experiments, and statistical significance analyzed by t-test * p < 0.05, *** p < 0.001
Fig. 2
Fig. 2
Immunoflourence for human brain microvascular endothelial cells (hBMECs) at 12 hpi with Influenza A virus. hBMECs were mock-treated or infected with A/WSN/33 (H1N1) virus at 0.1 MOI. After 12 h, the cells were stained with anti-NP (red), Phalloidin for F-actin (green), and Hoechst for nucleic acid stain (Blue). Images were captured by confocal microscopy. The column “Merged” is generated by the machine software, which is produced by positioning the “red”, “green” and “blue” fluorescence of the same cells within the same optical plane: scale bar 50, 20 µM
Fig. 3
Fig. 3
Transcriptomic analysis of human brain microvascular endothelial cells (hBMECs) following infection with Influenza A virus. a Volcano plot of host genes differentially expressed at 12 hpi (padj < 0.05) and ± 2 log2FC change. Each dot represents a gene. The red, blue, green, and black dots represent the differentially expressed genes within the selected p-value (padj < 0.05) and log2FC ± 2, the p-value, the log2FC, and non-significant genes, respectively. b Heatmap of the top 20 genes induced in hBMECs treated with the A/WSN/33 compared to the control cells at 12 hpi (padj < 0.05), the genes are listed on the Y-axis. Each column represents one sample, the control cells are represented in three columns (replicates), and the same case is for the treatment. The overall number of differentially expressed genes is 5,500, among which 3,712 were up-regulated and 1,788 were down-regulated (|log2FC|≥ 1; padj < 0.05) A list of the differentially expressed genes is available in Supplementary file 2
Fig. 4
Fig. 4
Functional enrichment analysis of the Differentially expressed genes in human brain microvascular endothelial cells (hBMECs) at 12 hpi. Gene ontology terms plotted in the order of gene ratio, the size of the dots depicts the number of the gene counts that were significantly enriched in the GO list, the dot color represents the p-adjusted value (padj ≤ 0.05)
Fig. 5
Fig. 5
GSEA plots for enriched genes regulating the cytoskeleton structure. a GSEA plot indicating the negative running enrichment score for the “regulation of microtubule cytoskeleton organization” (NES = -2.3, padj = 0.01) (b) with a number of the down-regulated genes participating in the process displayed in the form of a heatmap. c GSEA plot showing the positive running enrichment score activating the “actin cytoskeleton organization” (NES = 1.31, padj = 0.02) (d) with a list of the top activated genes shown in a heatmap. Black bars underneath the graph present the rank positions of genes from the gene set. The green line refers to the enrichment profile. GSEA, gene set enrichment analysis
Fig. 6
Fig. 6
ORA gene ontology results from innate DB. Each pie chart represents the top six GO terms of the (CC) cellular components, (BP) biological processes, and (MF) molecular functions (padj ≤ 0.05)
Fig. 7
Fig. 7
KEGG Pathway analysis. KEGG-based GSEA pathways are plotted in the order of gene ratios. The dots' size depicts the count number of the genes significantly differentiated in the KEGG pathway list, and the color represents the p-adjusted value (padj ≤ 0.05). GSEA, gene set enrichment analysis
Fig. 8
Fig. 8
GSEA plots of enriched KEGG pathways. a GSEA plots indicating the running enrichment score for gene expression signature of ‘cytokine-cytokine receptor interaction’ (NES = 1.89, padj = 0.0001), and its associated top up-regaulted genes (b) visualized in a heatmap, in addition to the GSEA plot for the (c) ‘neuroactive ligand-receptor interaction’ pathway (NES = 1.76, padj = 0.0001) and its associated top activated genes (d). Black bars underneath the graph present the rank positions of genes from the gene set, the green line refers to the enrichment profile. GO, KEGG and GSEA were performed by the R package clusterProfiler; R package DOSE; R package org.HS.eg.db. and visualized by the R package Enrichplot and R package ggplot2
Fig. 9
Fig. 9
Regulation of induced immune genes expression in human brain microvascular endothelial cells (hBMECs) following influenza A virus infection. a Canonical pathway of the “Interferon signaling” for the genes differentially expressed in hBMECs 12 hpi, genes that are significantly up-regulated are shown in red. The intensity of red corresponds to an increase in fold change levels of the cells infected with A/WSN/33 (H1N1) compared to the control cells z-score = 4.2. White nodes specify genes with no significant gene expression at 12 hpi. The pathway was generated with IPA (Ingenuity pathways system). b quantification of gene expression by (RT-qPCR) for IFN-λ 2/3 (c) ISG15, and d IFN-β. (b-d) the hBMECs were infected with A/WSN/33 (H1N1) at MOI 0.1, and the target genes were quantified by relative quantification qPCR. statistical-significance analyzed by t-test * p < 0.05, ** p < 0.01, and **** p < 0.0001. e Mechanistic network by IPA for the upstream regulators interacting with IFN-β, which enables to discover plausible sets of connected upstream regulators that can work together to elicit the gene expression changes observed in our dataset
Fig. 10
Fig. 10
Altered mitochondrial gene expression of human brain microvascular endothelial cells (hBMECs). a quantification of gene expression by (RT-qPCR) showing the fold change increase or decrease for four mitochondrial genes expression NDUSF2, SDHA, CASP14 and UQCRFS1 within the infected hBMECs cells at 12 hpi compared to the control cells. statistical-significance analyzed by t-test * p < 0.05, ** p < 0.01, *** p < 0.001, and **** p < 0.0001. b the GSEA running enrichment score for the suppression of ‘mitochondrial protein complex’ (NES = -2.4, padj = 0.025) enriched GO term and c its top downregulated genes. d indicates the GESA plot for negative running enrichment score of ‘mitochondrial gene expression’ (NES = -4.2, padj = 0.009) and e the top participating downregulated genes visualized in a heatmap. Black bars underneath the graph present the rank positions of genes from the gene set, the green line refers to the enrichment profile
Fig. 11
Fig. 11
Enrichment analysis indicating neurological disorders. a The IPA regulator effects analysis shows that the F2 upstream regulator and its downstream effects indicate a potential activation for the neuroglia in hBMECs at 12 hpi. The regulator effects algorithm generates hypotheses that explain how the activation or inhibition of regulators leads to an increase or decrease of function. b the heatmaps reveal the genes participating in neurodegenerative disease pathways enriched and sorted according to Log2FC ratios in the DEGs list

Similar articles

Cited by

References

    1. Ahmed, Muhammad Umer, Muhammad Hanif, Mukarram Jamat Ali, Muhammad Adnan Haider, Danish Kherani, Gul Muhammad Memon, Amin H. Karim, and Abdul Sattar. 2020. Neurological Manifestations of COVID-19 (SARS-CoV-2): A Review. Front Neurol 11: 518. - PMC - PubMed
    1. Amarante-Mendes, Gustavo P., Sandy Adjemian, Laura Migliari Branco, Larissa C. Zanetti, Ricardo Weinlich, and Karina R. Bortoluci. 2018. 'Pattern Recognition Receptors and the Host Cell Death Molecular Machinery', Frontiers in Immunology, 9. - PMC - PubMed
    1. Anthony DC, Couch Y, Losey P, Evans MC. The systemic response to brain injury and disease. Brain, Behavior, and Immunity. 2012;26:534–540. doi: 10.1016/j.bbi.2011.10.011. - DOI - PubMed
    1. Arbour N, Day R, Newcombe J, Talbot PJ. Neuroinvasion by human respiratory coronaviruses. Journal of Virology. 2000;74:8913–8921. doi: 10.1128/JVI.74.19.8913-8921.2000. - DOI - PMC - PubMed
    1. Aronsson F, Karlsson H, Ljunggren HG, Kristensson K. Persistence of the influenza A/WSN/33 virus RNA at midbrain levels of immunodefective mice. Journal of Neurovirology. 2001;7:117–124. doi: 10.1080/13550280152058771. - DOI - PubMed

LinkOut - more resources