

Climate and socioeconomic drivers of biomass burning and carbon emissions from fires in tropical dry forests: A Pantropical analysis
- PMID: 36345650
- PMCID: PMC10098545
- DOI: 10.1111/gcb.16516
Climate and socioeconomic drivers of biomass burning and carbon emissions from fires in tropical dry forests: A Pantropical analysis
Abstract
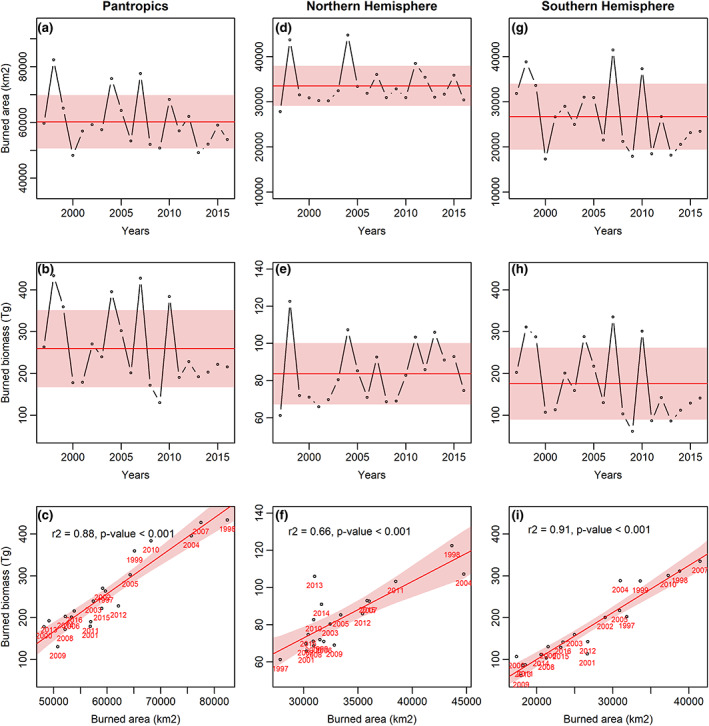
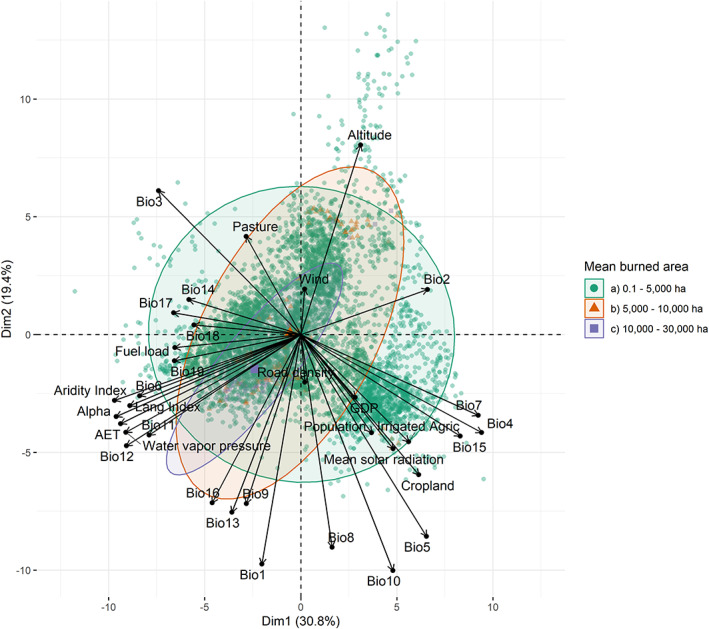
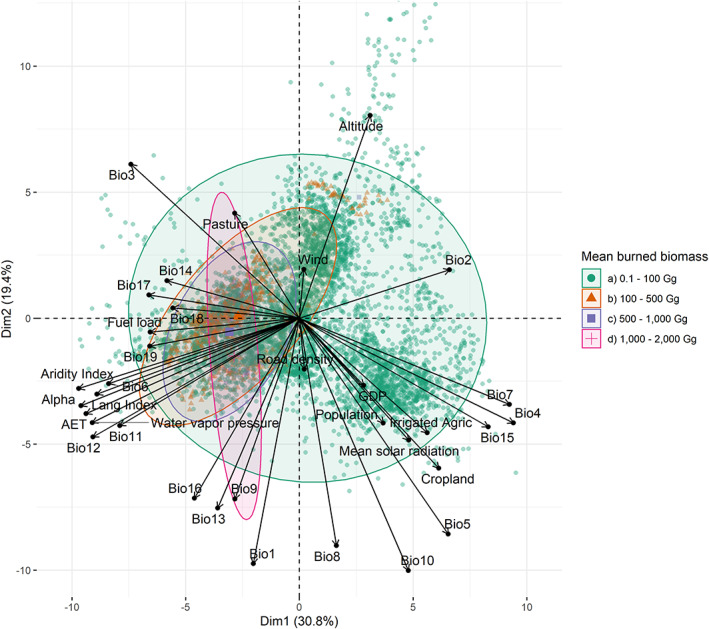
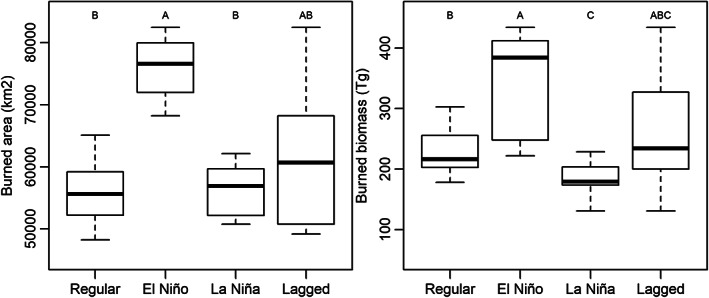
Global burned area has declined by nearly one quarter between 1998 and 2015. Drylands contain a large proportion of these global fires but there are important differences within the drylands, for example, savannas and tropical dry forests (TDF). Savannas, a biome fire-prone and fire-adapted, have reduced the burned area, while the fire in the TDF is one of the most critical factors impacting biodiversity and carbon emissions. Moreover, under climate change scenarios TDF is expected to increase its current extent and raise the risk of fires. Despite regional and global scale effects, and the influence of this ecosystem on the global carbon cycle, little effort has been dedicated to studying the influence of climate (seasonality and extreme events) and socioeconomic conditions of fire regimen in TDF. Here we use the Global Fire Emissions Database and, climate and socioeconomic metrics to better understand long-term factors explaining the variation in burned area and biomass in TDF at Pantropical scale. On average, fires affected 1.4% of the total TDF' area (60,208 km2 ) and burned 24.4% (259.6 Tg) of the global burned biomass annually at Pantropical scales. Climate modulators largely influence local and regional fire regimes. Inter-annual variation in fire regime is shaped by El Niño and La Niña. During the El Niño and the forthcoming year of La Niña, there is an increment in extension (35.2% and 10.3%) and carbon emissions (42.9% and 10.6%). Socioeconomic indicators such as land-management and population were modulators of the size of both, burned area and carbon emissions. Moreover, fires may reduce the capability to reach the target of "half protected species" in the globe, that is, high-severity fires are recorded in ecoregions classified as nature could reach half protected. These observations may contribute to improving fire-management.
El área global quemada se redujo en casi una cuarta parte entre 1998 y 2015. Los bosques secos contienen una gran proporción de esos incendios globales, pero existen diferencias importantes dentro de ellos, por ejemplo, las sabanas y los bosques secos tropicales (SBC). Las sabanas, son un bioma propenso y adaptado al fuego, y que en los últimos años han reducido su área quemada. Mientras que el fuego en la SBC es uno de los factores más críticos que impactan la biodiversidad y las emisiones de carbono. Además, bajo escenarios de cambio climático, se espera que la SBC aumente su extensión actual y aumente el riesgo de incendios. A pesar de los efectos a escala regional y global, y la influencia de este ecosistema en el ciclo global del carbono, se le ha dedicado poco esfuerzo a estudiar la influencia del clima (estacionalidad y eventos extremos) y las condiciones socioeconómicas del régimen de incendios. Aquí usamos la base de datos global de emisiones de incendios y métricas climáticas y socioeconómicas para comprender mejor los factores a largo plazo que explican la variación en el área quemada y la biomasa a escala Pantropical. En promedio, los incendios afectaron el 1,4% del área total de la SBC (60 208 km2 ) y quemaron el 24,4% (259,6 Tg) de la biomasa global quemada anualmente a escala Pantropical. Los moduladores climáticos influyen en gran medida en los regímenes de incendios locales y regionales. La variación interanual del régimen de incendios está determinada por El Niño y La Niña. Durante El Niño y el año subsecuente de La Niña, se produce un incremento en la extensión (35,2% y 10,3%) y en las emisiones de carbono (42,9% y 10,6%). Los indicadores socioeconómicos como la gestión de la tierra y la población fueron moduladores del tamaño tanto del área quemada como de las emisiones de carbono. Además, los incendios pueden reducir la capacidad de alcanzar el objetivo de “protección de la mitad de las especies” en el mundo, es decir, los incendios de alta gravedad se registran en ecorregiones clasificadas como naturaleza que podría alcanzar la protección de la mitad de su biodiversidad. Estas observaciones pueden contribuir a mejorar la gestión de incendios.
Keywords: El Niño/southern oscillation; La Niña; burned area; carbon emissions; climate and socioeconomic drivers; drought; fire; human factors.
© 2022 The Authors. Global Change Biology published by John Wiley & Sons Ltd.
Conflict of interest statement
The authors declare that they have no known competing financial interests or personal relationships that could have appeared to influence the work reported in this paper.
Figures
Similar articles
-
El Niño-southern oscillation effect on a fire regime in northeastern Mexico has changed over time.Ecology. 2010 Jun;91(6):1660-71. doi: 10.1890/09-0845.1. Ecology. 2010. PMID: 20583708
-
Biomass consumption by surface fires across Earth's most fire prone continent.Glob Chang Biol. 2019 Jan;25(1):254-268. doi: 10.1111/gcb.14460. Epub 2018 Nov 6. Glob Chang Biol. 2019. PMID: 30270480
-
Multi-season climate synchronized historical fires in dry forests (1650-1900), northern Rockies, U.S.A.Ecology. 2008 Mar;89(3):705-16. doi: 10.1890/06-2047.1. Ecology. 2008. PMID: 18459334
-
Fire in Australian savannas: from leaf to landscape.Glob Chang Biol. 2015 Jan;21(1):62-81. doi: 10.1111/gcb.12686. Epub 2014 Sep 9. Glob Chang Biol. 2015. PMID: 25044767 Free PMC article. Review.
-
Reassessment of carbon emissions from fires and a new estimate of net carbon uptake in Russian forests in 2001-2021.Sci Total Environ. 2022 Nov 10;846:157322. doi: 10.1016/j.scitotenv.2022.157322. Epub 2022 Jul 22. Sci Total Environ. 2022. PMID: 35872207 Review.
Cited by
-
Anthropogenic short-lived halogens increase human exposure to mercury contamination due to enhanced mercury oxidation over continents.Proc Natl Acad Sci U S A. 2024 Mar 19;121(12):e2315058121. doi: 10.1073/pnas.2315058121. Epub 2024 Mar 11. Proc Natl Acad Sci U S A. 2024. PMID: 38466839 Free PMC article.
References
-
- Adams, M. A. (2013). Mega‐fires, tipping points and ecosystem services: Managing forests and woodlands in an uncertain future. Forest, Ecology and Management, 294, 250–261.
-
- Akagi, S. K. , Yokelson, R. J. , Wiedinmeyer, C. , Alvarado, M. J. , Reid, J. S. , Karl, T. , Crounse, J. D. , & Wennberg, P. O. (2011). Emission factors for open and domestic biomass burning for use in atmospheric models. Atmospheric Chemistry and Physics Discussions, 11(9), 27532–27602. 10.5194/acp-11-4039-2011 - DOI
-
- Alboukadel, K. (2020). Factoextra: Extract and visualize the results of multivariate data analyses .
-
- Aldersley, A. , Murray, S. J. , & Cornell, S. E. (2011). Global and regional analysis of climate and human drivers of wildfire. Science of the Total Environment, 409, 3472–3481. - PubMed
MeSH terms
Substances
Grants and funding
LinkOut - more resources
Full Text Sources
Other Literature Sources
Miscellaneous
