

Sex differences and risk factors for bleeding in Alagille syndrome
- PMID: 36345711
- PMCID: PMC9728057
- DOI: 10.15252/emmm.202215809
Sex differences and risk factors for bleeding in Alagille syndrome
Abstract
Spontaneous bleeds are a leading cause of death in the pediatric JAG1-related liver disease Alagille syndrome (ALGS). We asked whether there are sex differences in bleeding events in patients, whether Jag1Ndr/Ndr mice display bleeds or vascular defects, and whether discovered vascular pathology can be confirmed in patients non-invasively. We performed a systematic review of patients with ALGS and vascular events following PRISMA guidelines, in the context of patient sex, and found significantly more girls than boys reported with spontaneous intracranial hemorrhage. We investigated vascular development, homeostasis, and bleeding in Jag1Ndr/Ndr mice, using retina as a model. Jag1Ndr/Ndr mice displayed sporadic brain bleeds, a thin skull, tortuous blood vessels, sparse arterial smooth muscle cell coverage in multiple organs, which could be aggravated by hypertension, and sex-specific venous defects. Importantly, we demonstrated that retinographs from patients display similar characteristics with significantly increased vascular tortuosity. In conclusion, there are clinically important sex differences in vascular disease in ALGS, and retinography allows non-invasive vascular analysis in patients. Finally, Jag1Ndr/Ndr mice represent a new model for vascular compromise in ALGS.
Keywords: Alagille syndrome; Bleeding; Jagged1; Notch; Vasculature.
© 2022 The Authors. Published under the terms of the CC BY 4.0 license.
Figures
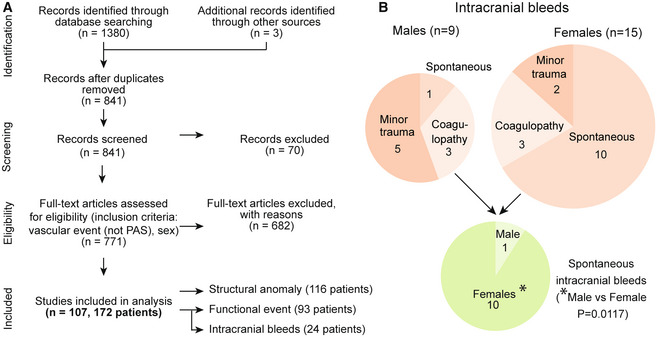
Systematic review search strategy following PRISMA guidelines. For detailed flow chart see Appendix Supplementary Methods. ALGS, Alagille syndrome; PAS, pulmonary artery stenosis.
Schematic depicting intracranial bleeds (n = 24, Binominal test in 9 males vs 15 females, ns, P = 0.2295). They were reported as a consequence of either minor head trauma or coagulopathy, or they were spontaneous (pie charts denote reported patient numbers). Pie chart depicting the number of spontaneous intracranial bleeds (male n = 1, females n = 10, Binominal test *P = 0.0117). For details of intracranial bleeds and references, see Table 1.
- A
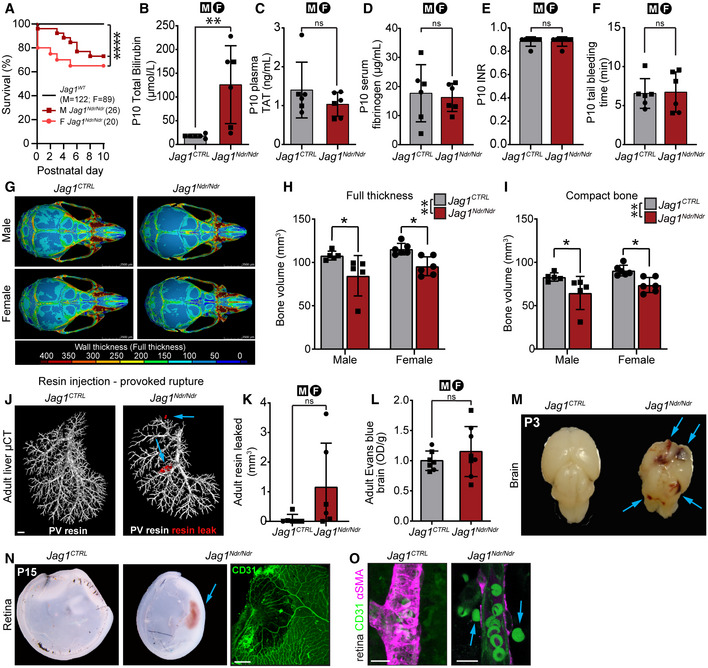
Pup survival analysis between P0 and P10, by sex. Each dot represents the absolute percent of remaining animals per group (Jag1 CTRL n = 211, male Jag1 Ndr/Ndr n = 26, female Jag1 Ndr/Ndr n = 20, log‐rank test, ****P < 0.0001).
- B
P10 plasma total bilirubin levels (n = 6 per group, unpaired t‐test, **P = 0.0091).
- C
P10 plasma thrombin antithrombin levels (n = 6 per group, unpaired t‐test, ns, P = 0.2788).
- D
P10 serum fibrinogen levels (n = 6 per group, unpaired t‐test, ns, P = 0.7585).
- E
P10 whole blood prothrombin time (INR; n = 6 per group, unpaired t‐test, ns, P > 0.9999).
- F
P10 tail bleeding time (n = 6 per group, unpaired t‐test, ns, P = 0.8916).
- G–I
μCT of P30 skulls. (G) Color map depicting wall thickness. Scale bar 3.5 mm. (H) Skull full thickness volume (n = 5‐6 per group, two‐way ANOVA. Interaction P = 0.7595; Sex P = 0.1164, Genotype **P = 0.0012. Šídák's multiple comparisons test: Male Jag1 +/+ vs Jag1 Ndr/Ndr *P = 0.0227; Female Jag1 +/+ vs Jag1 Ndr/Ndr * P = 0.034), (I) Compact bone total volume (n = 5‐6 per group, two‐way ANOVA. Interaction P = 0.8631; Sex P = 0.0901, Genotype **P = 0.0014. Šídák's multiple comparisons test: Male Jag1 +/+ vs Jag1 Ndr/Ndr *P = 0.0305; Female Jag1 +/+ vs Jag1 Ndr/Ndr *P = 0.0307).
- J, K
(J) Provoked vascular accidents induced by portal vein resin injection, with (K) resin leakage quantification outside of blood vessels (red) in adult mice (n = 6 per group, unpaired t‐test, ns, P = 0.1088). Scale bar 1 mm.
- L
Adult brain Evans blue assay (Jag1 CTRL n = 7, Jag1 Ndr/Ndr n = 8, unpaired t‐test, ns, P = 0.3807).
- M
Hemorrhagic P3 Jag1 Ndr/Ndr brain (n = 2/83 Jag1 Ndr/Ndr mice, sex n.d.).
- N
Hemorrhagic P15 Jag1 Ndr/Ndr retina. Scale bar 20 μm. Sex n.d.
- O
Red blood cells (green outside P10 Jag1 Ndr/Ndr retinal arteriole. Scale bar 10 μm.
- A
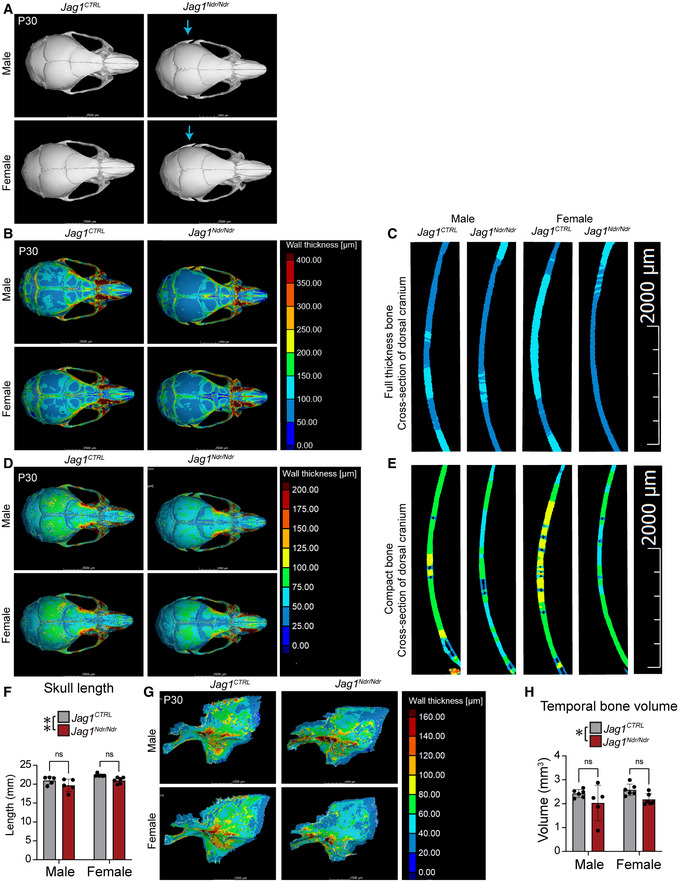
Micro computed tomography (μCT) of P30 skulls. Blue arrow marks side skull protrusions in Jag1 Ndr/Ndr mice.
- B, C
(B) Color map displaying skull full thickness. (C) Cross‐section of dorsal cranium in fully segmented skull.
- D, E
(D) Color map displaying cranial compact bone thickness. (E) Cross‐section of dorsal cranium of segmented compact bones.
- F
Skull length from occipital bone to nasal bone (measured in mid line), (n = 5‐6 per group, Two‐way ANOVA followed by Šídák's multiple comparison test, Interaction P = 0.9309, Sex P = 0.0069, Genotype **P = 0.0071).
- G, H
(G) Segmented temporal bone. (H) Temporal bone volume (n = 5‐6 per group, Two‐way ANOVA followed by Šídák's multiple comparison test, Interaction P = 0.9960, Sex P = 0.3691, Genotype *P = 0.0249).
- A–C
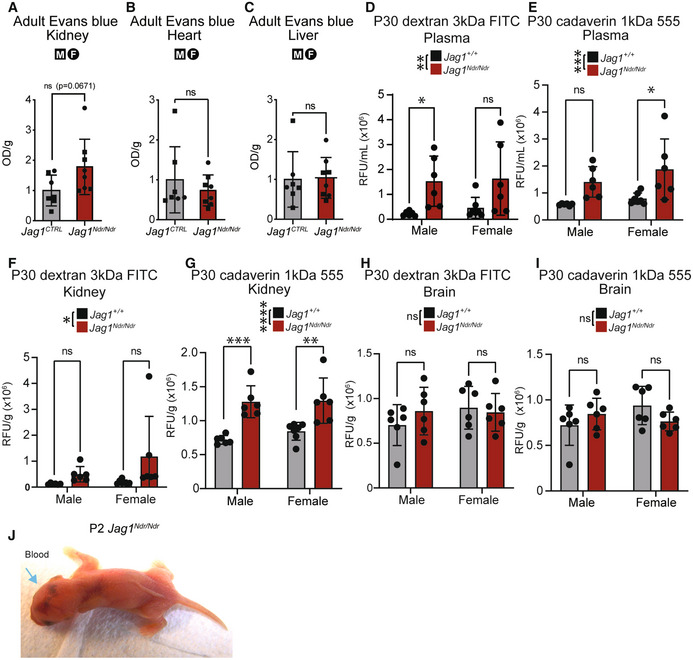
Relative vascular leakage as assessed by Evans blue extracted from adult (A) kidney (P = 0.0671, ns), (B) heart (P = 0.4316, ns), and (C) liver (P = 0.8988, ns) of Jag1 CTRL and Jag1 Ndr/Ndr adult mice (n = 7‐8 per group, Unpaired t‐test).
- D, E
Relative fluorescence in P30 plasma (D) of 3 kDa Dextran FITC (Two‐way ANOVA on biological replicates/individual mice, followed by Šídák's multiple comparison test; Interaction P = 0.08663, Sex P = 0.6541, Genotype **P = 0.0025) or (E) 1 kDa Cadaverin 555 (Two‐way ANOVA on biological replicates/individual mice followed by Šídák's multiple comparison test; Interaction P = 0.625, Sex P = 0.186, Genotype ***P = 0.0009).
- F, G
Relative vascular permeability in P30 kidney assessed by relative fluorescence of (F) 3 kDa Dextran FITC (Two‐way ANOVA on biological replicates/individual mice, followed by Šídák's multiple comparison test; Interaction P = 0.3296, Sex P = 0.2374, Genotype *P = 0.0384) (G) or 1 kDa Cadaverin 555 (Two‐way ANOVA on biological replicates/individual mice, followed by Šídák's multiple comparison test; Interaction P = 0.5308, Sex P = 0.4112, Genotype ****P < 0.0001).
- H, I
Relative vascular permeability in P30 brain assessed by relative fluorescence of (H) 3 kDa Dextran FITC (Two‐way ANOVA on biological replicates/individual mice, followed by Šídák's multiple comparison test; Interaction P = 0.2942, Sex P = 0.3624, Genotype P = 0.591) or (I) 1 kDa Cadaverin 555 (Two‐way ANOVA on biological replicates/individual mice, followed by Šídák's multiple comparison test; Interaction P = 0.0596, Sex P = 0.3806, Genotype P = 0.7301).
- J
Hemorrhages in brain and body of one Jag1 Ndr/Ndr pup at P2, corresponding to brain data in Fig 2M, brain dissected out the next day at P3
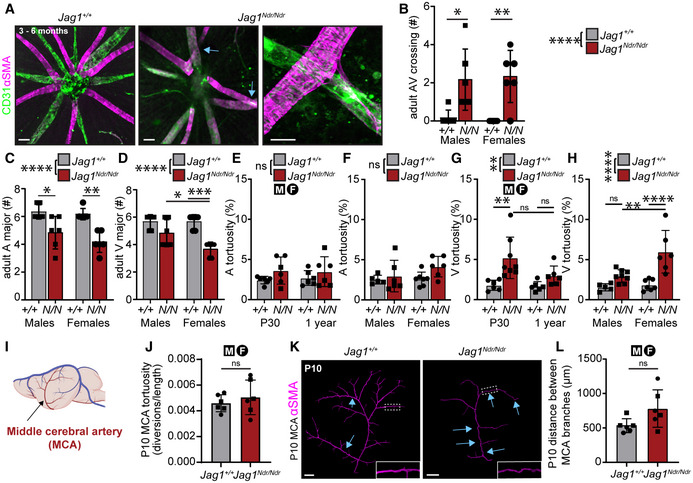
- A, B
(A) Radial arrangement of arterioles (magenta) and venules (green) from the optic nerve. Blue arrows label arteriovenous crossings. Magnification of crossing shows compression/narrowing of the underlying vein. Scale bar left and middle panels 50 μm, and right panel 20 μm. (B) Arteriovenous crossings number per retina (n = 6 per group, two‐way ANOVA with Tukey's multiple comparisons test. Interaction P = 0.7074, Sex P ≥ 0.9999, Genotype ****P ≤ 0.0001, Tukey's multiple comparisons test: Male:Jag1 +/+ vs. Male:Jag1 Ndr/Ndr *P = 0.0201; Female:Jag1 +/+ vs. Female:Jag1 Ndr/Ndr **P = 0.0061).
- C, D
(C) Number of major arterioles (n = 6 per group, two‐way ANOVA with Tukey's multiple comparisons test. Interaction P = 0.4353, Sex P = 0.1995, Genotype ****P ≤ 0.0001, Tukey's multiple comparisons test: Male:Jag1 +/+ vs. Male:Jag1 Ndr/Ndr *P = 0.0146; Female:Jag1 +/+ vs. Female:Jag1 Ndr/Ndr **P = 0.0011) and (D) venules (n = 6 per group, two‐way ANOVA with Tukey's multiple comparisons test. Interaction P = 0.044, Sex P = 0.044, Genotype ****P ≤ 0.0001, Tukey's multiple comparisons test: Male: Jag1 Ndr/Ndr vs. Female:Jag1 Ndr/Ndr *P = 0.0302; Female:Jag1 +/+ vs. Female:Jag1 Ndr/Ndr ***P = 0.0002).
- E, F
(E) Arterial tortuosity at P30 and 1 year, irrespective of sex (n = 6 per group, two‐way ANOVA, not significant). (F) Arterial tortuosity in male and female mice, irrespective of age (n = 5‐7, two‐way ANOVA, not significant).
- G, H
(G) Venous tortuosity at P30 and 1 year, irrespective of sex (n = 6‐8 per group, two‐way ANOVA with Tukey's multiple comparisons test. Interaction P = 0.1166, Age P = 0.0787, Genotype **P = 0.0013. Tukey's multiple comparisons test: P30:Jag1 +/+ vs. P30:Jag1 Ndr/Ndr **P = 0.004; P30:Jag1 Ndr/Ndr vs. 1 year:Jag1 Ndr/Ndr P = 0.0802; 1 year:Jag1 +/+ vs. 1 year:Jag1 Ndr/Ndr P = 0.5066). (H) Venous tortuosity in male and female mice, irrespective of age (n = 5‐7, two‐way ANOVA with Tukey's multiple comparisons test. Interaction *P = 0.0223, Sex **P = 0.007, Genotype ***P ≤ 0.0001. Tukey's multiple comparisons test: Male:Jag1 +/+ vs. Male:Jag1 Ndr/Ndr P = 0.3247, Male:Jag1 Ndr/Ndr vs. Female:Jag1 Ndr/Ndr **P = 0.0031, Female:Jag1 +/+ vs. Female:Jag1 Ndr/Ndr ****P = 0.0001).
- I–L
(I) Schematic of middle cerebral artery (MCA) in mouse brain (Image from Biorender). (J) Tortuosity of MCA, as assessed by number of diversions per length (n = 6, t‐test ns). (K) Visualization of MCA with alpha smooth muscle cell actin (αSMA) showed stereotype vasculature in 6 of 6 Jag1 +/+ animals, but 2 of 6 Jag1 Ndr/Ndr animals showed highly divergent MCA architecture (blue arrows). Scale bar 500 μm. (L) Distances between arterial branches in MCA at P10 (unpaired t‐test, not significant).
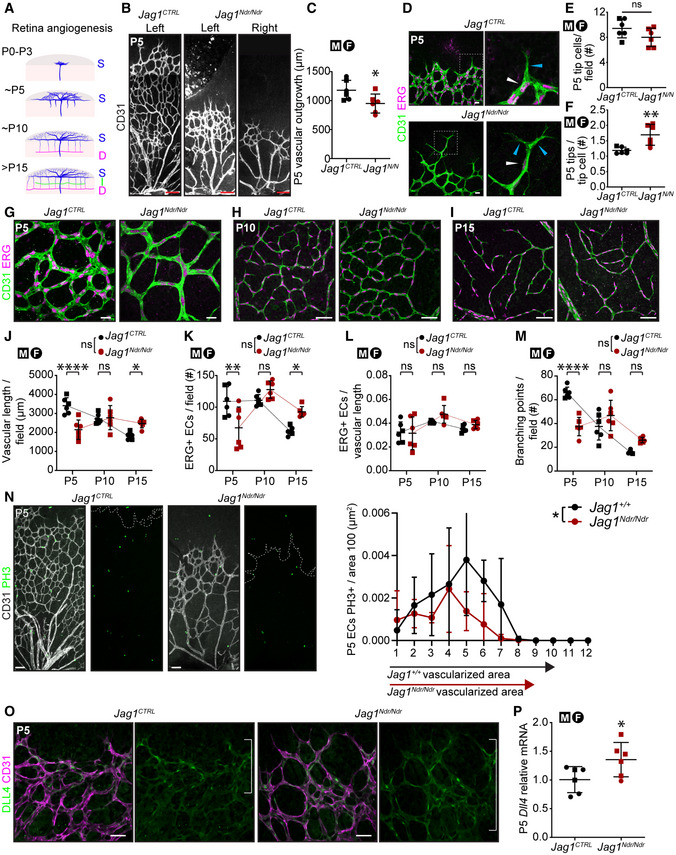
- A
Schematic depicting retinal angiogenesis between P0 and P15. S, superficial; I, intermediate; D, deep capillary plexus.
- B–F
(B) P5 retinal vascular outgrowth, (C) quantified (n = 6 per group, unpaired t‐test, *P = 0.0388). Scale bar 100 μm. (D) P5 vascular front with tip cells (boxed region). White arrowhead points to ERG+ tip cell nucleus, (E) quantified (n = 6, unpaired t‐test, P = 0.1281, ns), blue arrowheads point to tips (bundles of filopodia) of tip cell (F) quantified (n = 6, unpaired t‐test, **P = 0.0059). Scale bar 20 μm.
- G–M
Retinal vasculature at (G) P5, (H) P10, (I) P15. Scale bar (G) 50 μm, (H, I) 20 μm. Retinal blood vessel remodeling quantification at P5, P10, and P15 (J) vascular length per field (Two‐way ANOVA on biological replicates/individual mice. Interaction ****P < 0.0001, Age ***P = 0.0006, Genotype P = 0.2023. Šídák's multiple comparison test: P5 Jag1 CTRL vs. Jag1 Ndr/Ndr ****P < 0.0001; P15 Jag1 CTRL vs. Jag1 Ndr/Ndr *P = 0.0233), (K) number of ERG+ cells per field (Two‐way ANOVA on biological replicates/individual mice. Interaction ****P < 0.0001, Age ****P < 0.0001, Genotype P = 0.7656. Šídák's multiple comparison test: P5 Jag1 CTRL vs Jag1 Ndr/Ndr **P = 0.0013; P15 Jag1 CTRL vs Jag1 Ndr/Ndr *P = 0.0217), (L) number of ERG+ cells per vascular length (Two‐way ANOVA on biological replicates/individual mice. Interaction P = 0.4617, Age **P = 0.0018, Genotype P = 0.2235), (M) number of branching points per field (n = 6 per group, Two‐way ANOVA on biological replicates/individual mice. Interaction ****P < 0.0001, Age ****P < 0.0001, Genotype P = 0.2719. Šídák's multiple comparison test: P5 Jag1 CTRL vs. Jag1 Ndr/Ndr ****P < 0.0001).
- N
Immunofluorescence of PH3+ proliferating CD31+ endothelial cells at P5. The dotted line labels the edge of the vascular front. Quantification of the number of proliferating cells per radial zone, normalized to area size at P5 (n = 4, Two‐way ANOVA on biological replicates/individual mice. Interaction P = 0.3044, Zone ****P < 0.0001, Genotype *P = 0.0165). Scale bar 50 μm.
- O, P
(O) Delta like 4 in P5 vasculature. Scale bar 20 μm. White brackets denote high DLL4 activity. (P) Dll4 relative mRNA levels in whole retina lysates (n = 6, unpaired t‐test, *P = 0.0461).
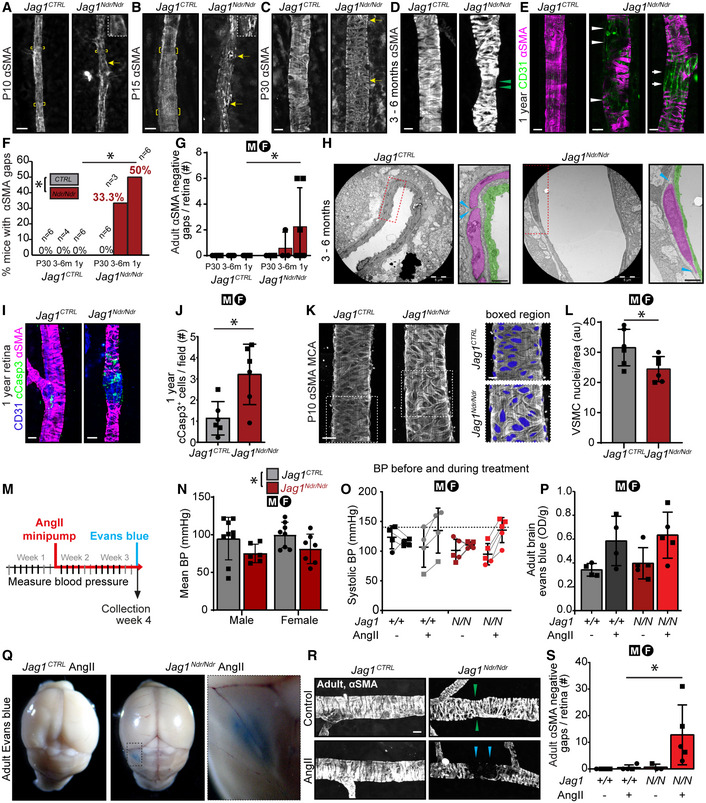
- A–E
αSMA coverage of (A) P10, (B) P15, (C) P30, (D) 3–6‐month‐old and (E) 1‐year‐old retinal arterioles. Brackets in A, B denote perpendicular VSMCs around arteriole. Yellow arrows in A, B, C. indicate VSMCs with an orientation parallel to the blood vessel. Green arrowheads in D denote stenosis. White arrowheads in E label αSMA‐negative gaps and white arrows an aneurysm. Cropped images were placed on black background for esthetic purposes. Scale bars 10 μm.
- F, G
(F) Incidence of α SMA negative gaps on arteries by age (Two‐way ANOVA with Šídák's multiple comparisons test). (G) Number of α SMA negative gaps per retina and mouse by age (Two‐way ANOVA with Šídák's multiple comparisons test. Dots represent biological replicates/individual retinas/mice. Two‐way ANOVA not significant. Šídák's multiple comparisons test: 1 year Jag1 +/+ vs. 1 year Jag1 Ndr/Ndr *P = 0.0189).
- H
Transmission electron microscopy of retinal arterioles. VSMCs color‐coded in magenta, EC in green. Scale bar 5 μm, boxed region 1 μm. Blue arrowheads denote the edges of VSMCs.
- I, J
(I) One‐year‐old retinal arteriolar cCasp3+ apoptotic cells. Scale bar 10 μm. (J) cCasp3+ cells per field (n = 6 per group, unpaired t‐test, *P = 0.0109).
- K, L
(K) Left panel aSMA coverage of MCA of P10 mice. Scale bar 20 μm. Right panel magnification of area where number of nuclei was counted. Nuclei were color‐coded blue. Scale bar 10 μm. (L) MCA vascular smooth muscle cell nuclei quantification (n = 6 per group, unpaired t‐test, *P = 0.0421).
- M–S
(M) Experimental set up for AngII treatment. (N) Blood pressure (BP) before treatment in male and female Jag1 CTRL and Jag1 Ndr/Ndr mice. Each dot represents one animal/one biological replicate. (Two‐way ANOVA Interaction P = 0.9407, Sex P = 0.4957, Genotype *P = 0.0207. Šídák's multiple comparisons test not significant). (O) Blood pressure increase in Jag1 CTRL and Jag1 Ndr/Ndr mice treated with vehicle or AngII for 2 weeks (Jag1 +/+ ctrl n = 4, Jag1 +/+ AngII n = 4, Jag1 Ndr/Ndr ctrl n = 5, Jag1 Ndr/Ndr AngII n = 5, two‐way ANOVA, with Šídák's multiple comparisons). (P) Detection of Evans blue leakage in brain in Jag1 CTRL and Jag1 Ndr/Ndr mice with or without AngII treatment. (Jag1 +/+ ctrl n = 4, Jag1 +/+ AngII n = 4, Jag1 Ndr/Ndr ctrl n = 5, Jag1 Ndr/Ndr AngII n = 5, two‐way ANOVA, with Šídák's multiple comparison. Interaction P = 0.9687, Treatment **P = 0.007, Genotype P = 0.5058). (Q) One Jag1 Ndr/Ndr mouse (male) displayed a macroscopic EB leakage, upon AngII treatment. (R) Retinal arteriolar αSMA coverage in vehicle or AngII‐treated mice. Green arrowheads denote stenosis, blue arrowheads label αSMA‐negative gap. Scale bar 10 μm. (S) αSMA‐negative gaps in arterioles per retina (Jag1 +/+ ctrl n = 4, Jag1 +/+ AngII n = 4, Jag1 Ndr/Ndr ctrl n = 3‐5, Jag1 Ndr/Ndr AngII n = 5, two‐way ANOVA, with Šídák's multiple comparison. Interaction P = 0.1054, treatment P = 0.0815; Genotype P = 0.0747. Ší'ák's multiple comparisons test: AngII‐treated Jag1 +/+ vs. AngII‐treated Jag1 Ndr/Ndr *P = 0.0315).
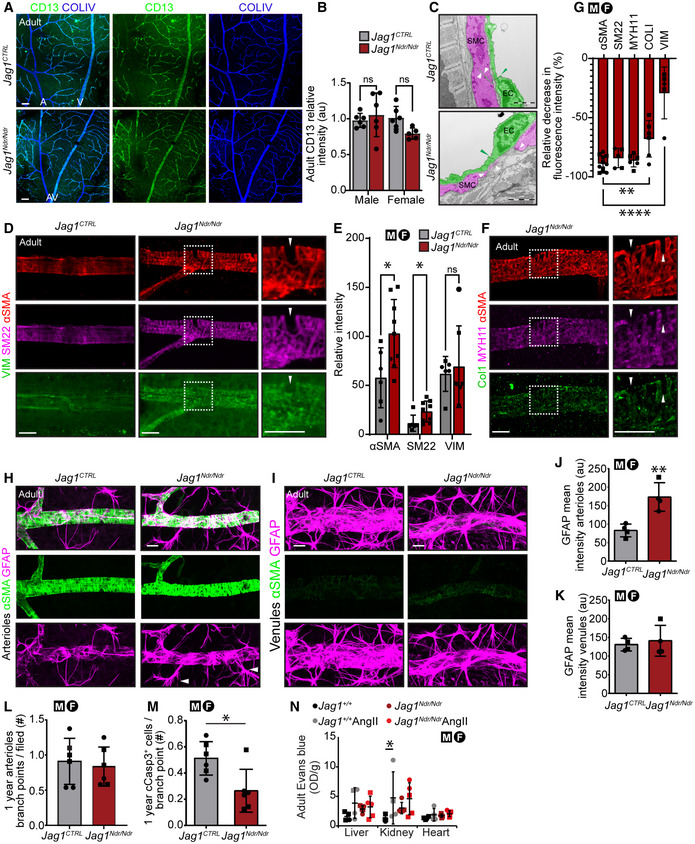
- A, B
(A) CD13 pericyte coverage of blood vessels was not reduced in adult Jag1 Ndr/Ndr mice. Scale bars 20 μm. (B) Quantification of CD13 intensity per field (n = 5‐6 per group, Two‐way ANOVA followed by Šídák's multiple comparison test, Interaction P = 0.0737, Sex P = 0.1642, Genotype P = 0.3706).
- C
Transmission electron microscopy of coronary arteries of adult mice. Vascular smooth muscle cells (SMC) are pseudo‐colored in magenta and endothelial cells (ECs) in green. White arrowheads label SMC edges and the distances between SMCs. Green arrowhead marks the tight junctions. Scale bars 2 μm.
- D, E
(D) Staining for contractile (αSMA, SM22) and synthetic (VIM) vascular SMC (E) with quantification (n = 6–9 per group, Multiple unpaired t‐tests, αSMA *P = 0.0214, SM22 *P = 0.0302, VIM P = 0.6801). Boxed region indicates region with αSMA‐negative gap (labeled by white arrowhead). Scale bar 20 μm.
- F, G
(F) Staining for contractile (αSMA, MYH11) and synthetic (COLI) vascular SMC. Boxed region indicates region with αSMA‐negative gap (labeled by white arrowhead). Scale bar 20 μm. (G) Relative decrease in fluorescence intensity of different vascular SMC markers within gap compared to within vascular SMC (set to 100%), (n = 5‐11 per group, one‐way ANOVA P < 0.0001, followed by Dunnett's multiple comparisons test: ASMA vs. COLI Adjusted **P = 0.0066, ASMA vs. VIM adjusted ****P < 0.0001).
- H–K
(H) GFAP+ astrocytes are more prevalent around adult Jag1 Ndr/Ndr arterioles (I) but not veins. White arrowheads label reactive astrocytes. Scale bars 20 μm. (J, K) Quantification of mean GFAP intensity on retinal (J) arterioles (n = 4, unpaired t‐test, **P = 0.0052), (K) venules (n = 4, unpaired t‐test, P = 0.6547).
- L, M
(L) Number of arteriolar first‐generation branch points in 1‐year‐old mice (n = 6, unpaired t‐test, P = 0.6823). (M) Number of cCasp3+ cells associated with first‐generation arteriolar branching point (n = 6, unpaired t‐test, *P = 0.0153).
- N
Evans blue extracted from liver, kidney, and heart of mice treated with PBS or Angiotensin II (n = 4‐5 per group, two‐way ANOVA with Subject matching. Interaction P = 0.2576, Organ P = 0.0011, Genotype & Treatment P = 0.2086 Subject ***P = 0.0004, followed by Tukey's multiple comparison test, Jag1 +/+ vs. Jag1 +/+ AngII *P < 0.05).
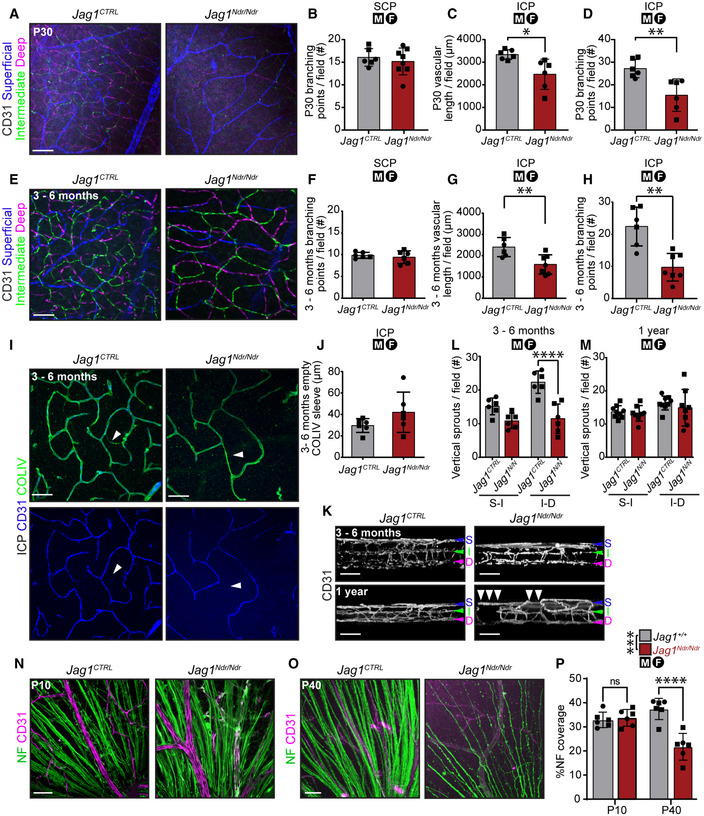
- A–D
(A) P30 retina, three CD31+ capillary layers pseudo‐colored for superficial, intermediate and deep layers. Scale bar 50 μm. (B) P30 SCP branching point number (n = 6‐8 per group, unpaired t‐test, ns, P = 0.5346). (C) P30 ICP vascular length (n = 6 per group, unpaired t‐test, *P = 0.0124). (D) P30 ICP branching point number (n = 6 per group, unpaired t‐test, **P = 0.0057).
- E–H
(E) 3–6‐month‐old retina, three pseudo‐colored CD31+ capillary layers. Scale bar 50 μm. (F) Adult SCP branching point number (n = 6 per group, unpaired t‐test, ns, P = 0.5365). (G) Adult ICP vascular length (n = 6‐7 per group, unpaired t‐test, **P = 0.0078). (H) Adult ICP branching point number (n = 6‐7 per group, unpaired t‐test, **P = 0.001).
- I, J
(I) ICP COLIV and CD31 (arrowhead labels COLIV+ CD31‐ capillary). Scale bar 50 μm. (J) Empty COLIV sleeve length in ICP per field (n = 6 per group, unpaired t‐test, ns, P = 0.1583).
- K–M
(K) Retinal capillary plexuses in 3–6‐month‐old (top panels) and 1‐year‐old mice (bottom panels). White arrowheads label discontinuous ICP. Blue arrowhead labels SCP, green ICP, and magenta DCP. (L‐M) Vertical sprout number between SCP (S) and ICP (I) and ICP (I) and DCP (D) in (L) adult (n = 6 per group, two‐way ANOVA, genotype ***P = 0.0004, Šídák's multiple comparisons test S‐I ns, P = 0.0592, (I–D) ****P < 0.0001) and (M) 1‐year‐old mice (n = 8 per group, two‐way ANOVA, genotype ns, P = 0.4507, Šídák's multiple comparisons test S‐I ns, P = 0.9483, (I–D) ns, P = 0.6046).
- N–P
(N) P10 and (O) P40 neurofilament (NF) and CD31 staining. Scale bar 50 μm. (P) % area positive for NF in P10 and P40 mice (n = 6 per group, two‐way ANOVA: Interaction ***P = 0.0001; Age *P = 0.0428; Genotype ***P = 0.0004. Šídák's multiple comparisons test: P10 Jag1 +/+ vs. P10 Jag1 Ndr/Ndr P = 0.9246; P40 Jag1 +/+ vs. P40 Jag1 Ndr/Ndr ****P ≤ 0.0001).
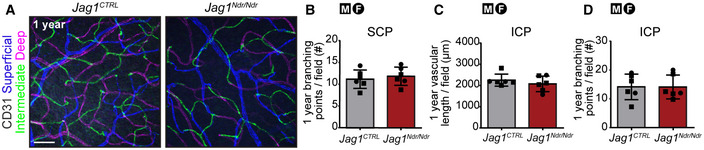
One‐year‐old retina three CD31+ capillary layers. Scale bar 50 μm.
One‐year‐old SCP branching point number (n = 6 per group, unpaired t‐test, P = 0.5730).
One‐year‐old ICP vascular length (n = 6 per group, unpaired t‐test, P = 0.3686).
One‐year‐old ICP branching point number (n = 6 per group, unpaired t‐test, P = 0.9869).
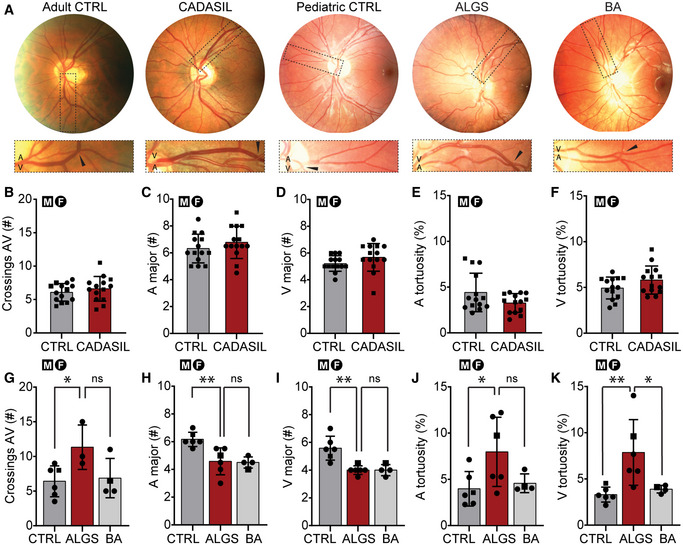
- A
Representative retinographs from a healthy adult, patient with CADASIL, healthy pediatric individual, patient with ALGS, and patient with BA. Boxed regions and black arrowheads magnify arteriovenous crossing.
- B–F
(B) Arteriovenous crossings per retina (n = 14 per group, unpaired t‐test, ns, P = 0.3854). (C) Major arterioles (n = 14 per group, unpaired t‐test, ns, P = 0.2902) and (D) venules (n = 14 per group, unpaired t‐test, ns, P = 0.1536). (E) Arterial (n = 14 per group, unpaired t‐test, ns, P = 0.0759) and (F) venous tortuosity (n = 14 per group, unpaired t‐test, ns, P = 0.1050).
- G–K
(G) Arteriovenous crossings per retina (CTRL n = 5, ALGS n = 3, BA n = 4, one‐way ANOVA, ns, P = 0.0608, Šídák's multiple comparisons ALGS vs. CTRL *P = 0.0492, ALGS vs. BA ns, P = 0.0999). (H) Major arterioles (CTRL n = 5, ALGS n = 5, BA n = 4, one‐way ANOVA, **P = 0.0026, Šídák's multiple comparisons ALGS vs. CTRL **P = 0.0039, ALGS vs. BA ns, P = 0.9799) and (I) venules (CTRL n = 5, ALGS n = 5, BA n = 4, one‐way ANOVA, ***P = 0.0008, Šídák's multiple comparisons ALGS vs. CTRL **P = 0.0011, ALGS vs. BA ns, P > 0.9999). (J) Arterial (CTRL n = 5, ALGS n = 5, BA n = 4, one‐way ANOVA, *P = 0.0486, Šídák's multiple comparisons ALGS vs. CTRL *P = 0.0392, ALGS vs. BA ns, P = 0.1204) and (K) venous tortuosity (CTRL n = 5, ALGS n = 5, BA n = 4, one‐way ANOVA, **P = 0.009, Šídák's multiple comparisons ALGS vs. CTRL **P = 0.0076, ALGS vs. BA *P = 0.0327).
References
-
- Agrawal S, Chennuri V, Agrawal P (2015) Genetic diagnosis in an Indian child with Alagille syndrome. Indian J Pediatr 82: 653–654 - PubMed
-
- Alagille D, Odièvre M, Gautier M, Dommergues JP (1975) Hepatic ductular hypoplasia associated with characteristic facies, vertebral malformations, retarded physical, mental, and sexual development, and cardiac murmur. J Pediatr 86: 63–71 - PubMed
-
- Alagille D, Estrada A, Hadchouel M, Gautler M, Odièvre M, Dommergues JP (1987) Syndromic paucity of interlobular bile ducts (Alagille syndrome or arteriohepatic dysplasia): review of 80 cases. J Pediatr 110: 195–200 - PubMed
Publication types
MeSH terms
LinkOut - more resources
Full Text Sources
Molecular Biology Databases
