

The role of adolescent lifestyle habits in biological aging: A prospective twin study
- PMID: 36345722
- PMCID: PMC9642990
- DOI: 10.7554/eLife.80729
The role of adolescent lifestyle habits in biological aging: A prospective twin study
Abstract
Background: Adolescence is a stage of fast growth and development. Exposures during puberty can have long-term effects on health in later life. This study aims to investigate the role of adolescent lifestyle in biological aging.
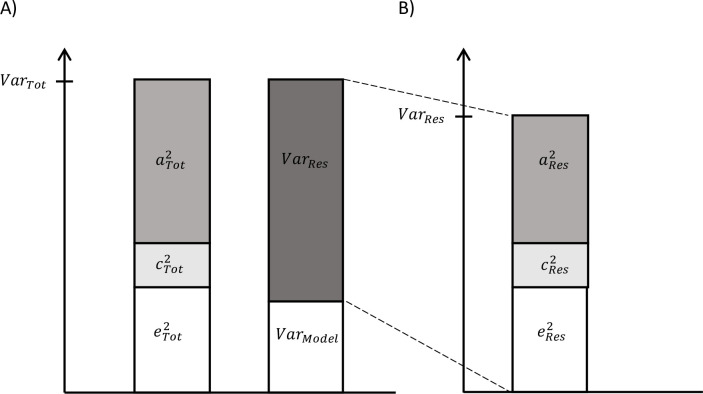
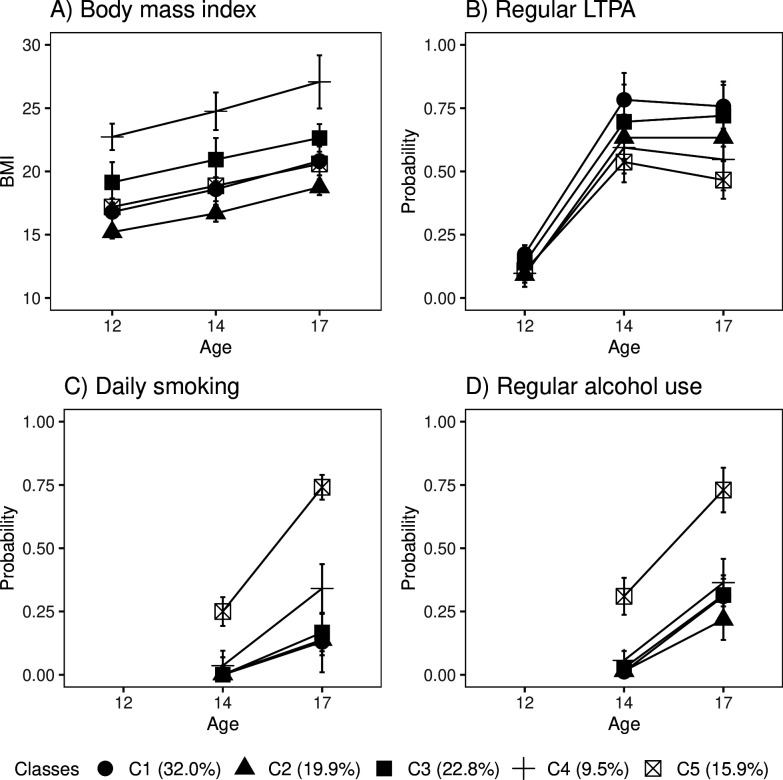
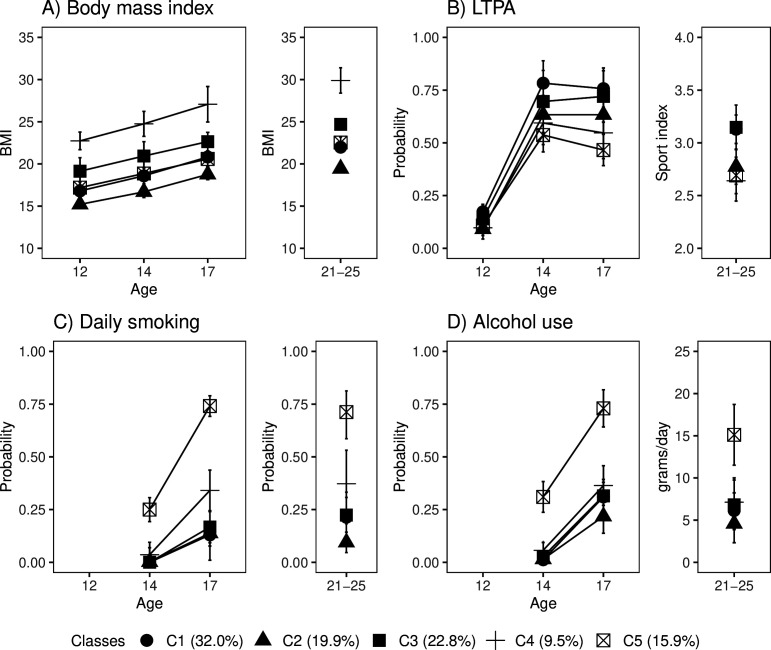
Methods: The study participants originated from the longitudinal FinnTwin12 study (n = 5114). Adolescent lifestyle-related factors, including body mass index (BMI), leisure-time physical activity, smoking, and alcohol use, were based on self-reports and measured at ages 12, 14, and 17 years. For a subsample, blood-based DNA methylation (DNAm) was used to assess biological aging with six epigenetic aging measures in young adulthood (21-25 years, n = 824). A latent class analysis was conducted to identify patterns of lifestyle behaviors in adolescence, and differences between the subgroups in later biological aging were studied. Genetic and environmental influences on biological aging shared with lifestyle behavior patterns were estimated using quantitative genetic modeling.
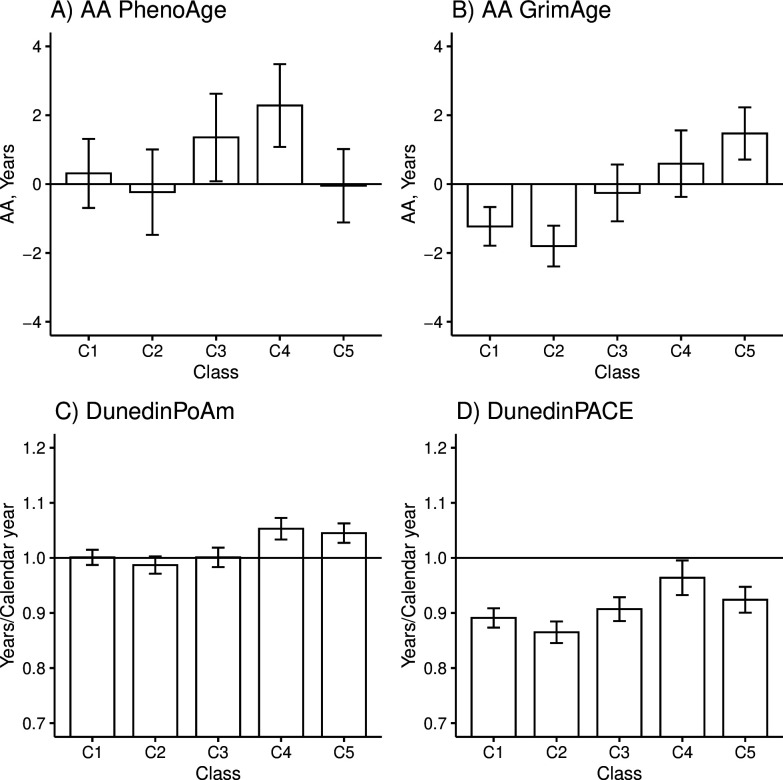
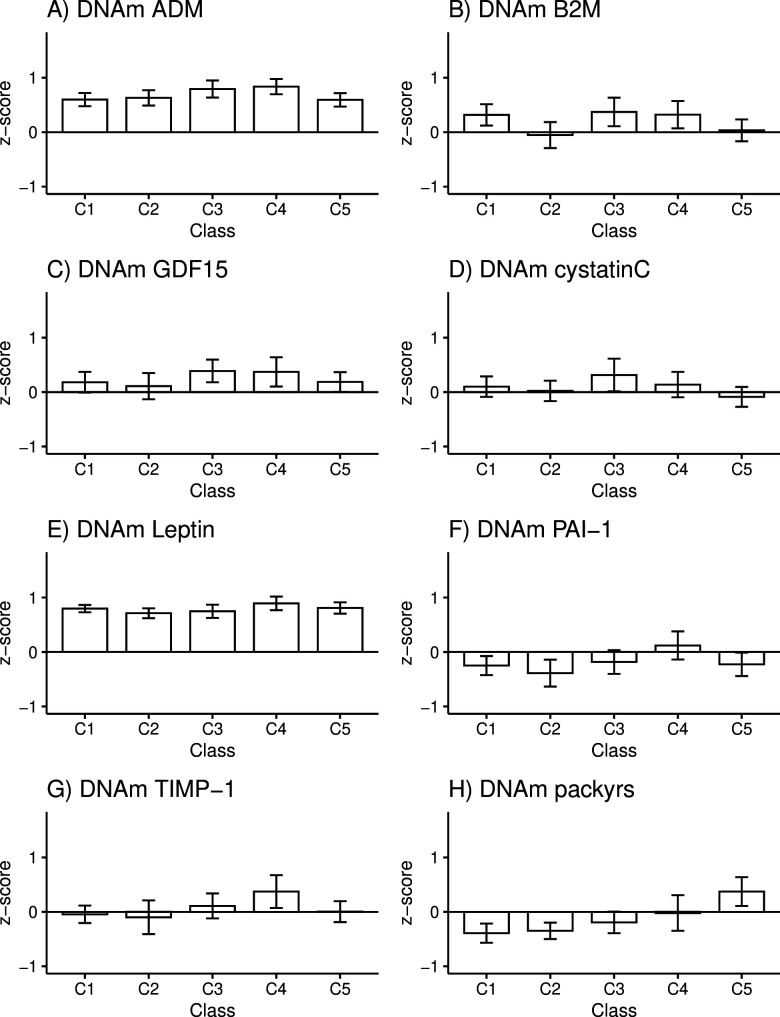
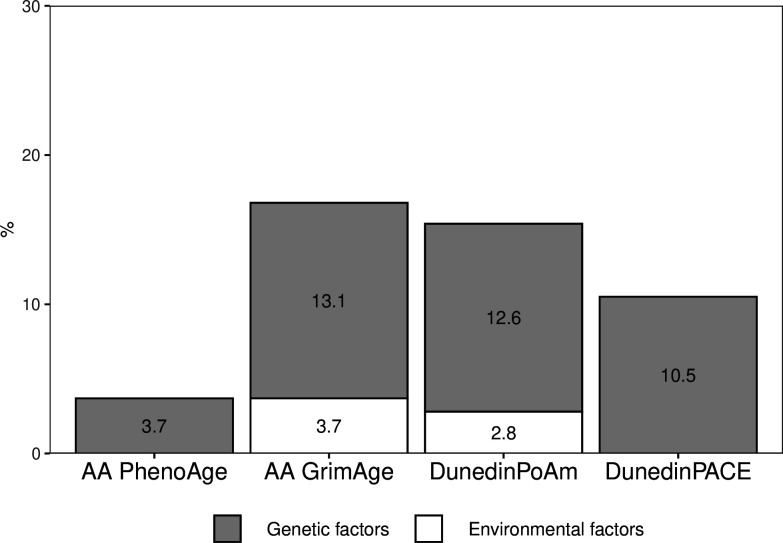
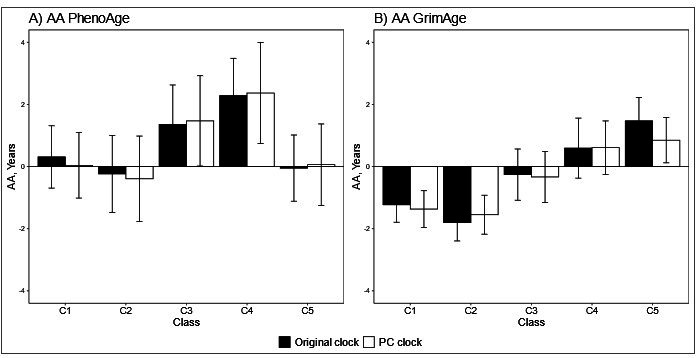
Results: We identified five subgroups of participants with different adolescent lifestyle behavior patterns. When DNAm GrimAge, DunedinPoAm, and DunedinPACE estimators were used, the class with the unhealthiest lifestyle and the class of participants with high BMI were biologically older than the classes with healthier lifestyle habits. The differences in lifestyle-related factors were maintained into young adulthood. Most of the variation in biological aging shared with adolescent lifestyle was explained by common genetic factors.
Conclusions: These findings suggest that an unhealthy lifestyle during pubertal years is associated with accelerated biological aging in young adulthood. Genetic pleiotropy may largely explain the observed associations.
Funding: This work was supported by the Academy of Finland (213506, 265240, 263278, 312073 to J.K., 297908 to M.O. and 341750, 346509 to E.S.), EC FP5 GenomEUtwin (J.K.), National Institutes of Health/National Heart, Lung, and Blood Institute (grant HL104125), EC MC ITN Project EPITRAIN (J.K. and M.O.), the University of Helsinki Research Funds (M.O.), Sigrid Juselius Foundation (J.K. and M.O.), Yrjö Jahnsson Foundation (6868), Juho Vainio Foundation (E.S.) and Päivikki and Sakari Sohlberg foundation (E.S.).
Keywords: DNA methylation; adolescence; biological age; dna methylation; epidemiology; epigenetic aging; global health; lifespan; lifestyle; pace of aging.
Plain language summary
For most animals, events that occur early in life can have a lasting impact on individuals’ health. In humans, adolescence is a particularly vulnerable time when rapid growth and development collide with growing independence and experimentation. An unhealthy lifestyle during this period of rapid cell growth can contribute to later health problems like heart disease, lung disease, and premature death. This is due partly to accelerated biological aging, where the body deteriorates faster than what would be expected for an individual’s chronological age. One way to track the effects of lifestyle on biological aging is by measuring epigenetic changes. Epigenetic changes consist on adding or removing chemical ‘tags’ on genes. These tags can switch the genes on or off without changing their sequences. Scientists can measure certain epigenetic changes by measuring the levels of methylated DNA – DNA with a chemical ‘tag’ known as a methyl group – in blood samples. Several algorithms – known as ‘epigenetic clocks’ – are available that estimate how fast an individual is aging biologically based on DNA methylation. Kankaanpää et al. show that unhealthy lifestyles during adolescence may lead to accelerated aging in early adulthood. For their analysis, Kankaanpää et al. used data on the levels of DNA methylation in blood samples from 824 twins between 21 and 25 years old. The twins were participants in the FinnTwin12 study and had completed a survey about their lifestyles at ages 12, 14, and 17. Kankaanpää et al. classified individuals into five groups depending on their lifestyles. The first three groups, which included most of the twins, contained individuals that led relatively healthy lives. The fourth group contained individuals with a higher body mass index based on their height and weight. Finally, the last group included individuals with unhealthy lifestyles who binge drank, smoked and did not exercise. After estimating the biological ages for all of the participants, Kankaanpää et al. found that both the individuals with higher body mass indices and those in the group with unhealthy lifestyles aged faster than those who reported healthier lifestyles. However, the results varied depending on which epigenetic clock Kankaanpää et al. used to measure biological aging: clocks that had been developed earlier showed fewer differences in aging between groups; while newer clocks consistently found that individuals in the higher body mass index and unhealthy groups were older. Kankaanpää et al. also showed that shared genetic factors explained both unhealthy lifestyles and accelerated biological aging. The experiments performed by Kankaanpää et al. provide new insights into the vital role of an individual’s genetics in unhealthy lifestyles and cellular aging. These insights might help scientists identify at risk individuals early in life and try to prevent accelerated aging.
© 2022, Kankaanpää et al.
Conflict of interest statement
AK, AT, AH, JK, MO, ES No competing interests declared
Figures
Similar articles
-
Quantification of the pace of biological aging in humans through a blood test, the DunedinPoAm DNA methylation algorithm.Elife. 2020 May 5;9:e54870. doi: 10.7554/eLife.54870. Elife. 2020. PMID: 32367804 Free PMC article.
-
Assessing the causal role of epigenetic clocks in the development of multiple cancers: a Mendelian randomization study.Elife. 2022 Mar 29;11:e75374. doi: 10.7554/eLife.75374. Elife. 2022. PMID: 35346416 Free PMC article.
-
Associations of four biological age markers with child development: A multi-omic analysis in the European HELIX cohort.Elife. 2023 Jun 6;12:e85104. doi: 10.7554/eLife.85104. Elife. 2023. PMID: 37278618 Free PMC article.
-
Biological Aging Acceleration Due to Environmental Exposures: An Exciting New Direction in Toxicogenomics Research.Genes (Basel). 2023 Dec 21;15(1):16. doi: 10.3390/genes15010016. Genes (Basel). 2023. PMID: 38275598 Free PMC article. Review.
-
A Systematic Review and Meta-analysis of Environmental, Lifestyle, and Health Factors Associated With DNA Methylation Age.J Gerontol A Biol Sci Med Sci. 2020 Feb 14;75(3):481-494. doi: 10.1093/gerona/glz099. J Gerontol A Biol Sci Med Sci. 2020. PMID: 31001624 Free PMC article.
Cited by
-
Educational Mobility, Pace of Aging, and Lifespan Among Participants in the Framingham Heart Study.JAMA Netw Open. 2024 Mar 4;7(3):e240655. doi: 10.1001/jamanetworkopen.2024.0655. JAMA Netw Open. 2024. PMID: 38427354 Free PMC article.
-
[Association between factors in life course and physiological dysregulation among the middle-aged and older population in Zhoushan city of Zhejiang province].Zhejiang Da Xue Xue Bao Yi Xue Ban. 2024 Jan 25;54(1):39-48. doi: 10.3724/zdxbyxb-2024-0168. Zhejiang Da Xue Xue Bao Yi Xue Ban. 2024. PMID: 39238396 Free PMC article. Chinese.
-
Social disadvantage accelerates aging.Nat Med. 2025 May;31(5):1635-1643. doi: 10.1038/s41591-025-03563-4. Epub 2025 Mar 14. Nat Med. 2025. PMID: 40087516 Free PMC article.
-
Multi-Omic Associations of Epigenetic Age Acceleration Are Heterogeneously Shaped by Genetic and Environmental Influences.Aging Cell. 2025 Aug;24(8):e70088. doi: 10.1111/acel.70088. Epub 2025 May 5. Aging Cell. 2025. PMID: 40325911 Free PMC article.
-
Association between epigenetic age and type 2 diabetes mellitus or glycemic traits: A longitudinal twin study.Aging Cell. 2024 Jul;23(7):e14175. doi: 10.1111/acel.14175. Epub 2024 Apr 25. Aging Cell. 2024. PMID: 38660768 Free PMC article.
References
-
- Asparouhov T, Muthén B. Auxiliary variables in mixture modeling: using the BCH method in mplus to estimate a distal outcome model and an arbitrary second model. Mplus. 2021;21:1–27. doi: 10.1080/10705511.2014.915181. - DOI
-
- Belsky DW, Caspi A, Arseneault L, Baccarelli A, Corcoran DL, Gao X, Hannon E, Harrington HL, Rasmussen LJ, Houts R, Huffman K, Kraus WE, Kwon D, Mill J, Pieper CF, Prinz JA, Poulton R, Schwartz J, Sugden K, Vokonas P, Williams BS, Moffitt TE. Quantification of the pace of biological aging in humans through a blood test, the dunedinpoam DNA methylation algorithm. eLife. 2020;9:e54870. doi: 10.7554/eLife.54870. - DOI - PMC - PubMed
Publication types
MeSH terms
LinkOut - more resources
Full Text Sources
Medical
