. 2022 Nov 1;29(Pt 6):1480-1494.
doi: 10.1107/S1600577522009377. Epub 2022 Oct 21.

AMX - the highly automated macromolecular crystallography (17-ID-1) beamline at the NSLS-II

Affiliations

AMX - the highly automated macromolecular crystallography (17-ID-1) beamline at the NSLS-II

Dieter K Schneider et al. J Synchrotron Radiat. .

Abstract

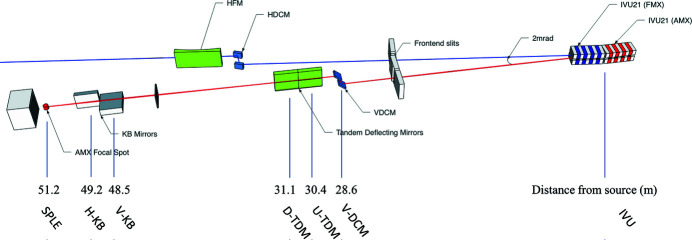
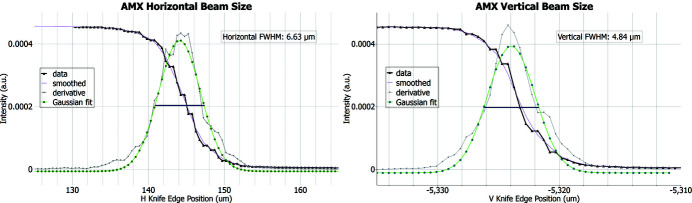
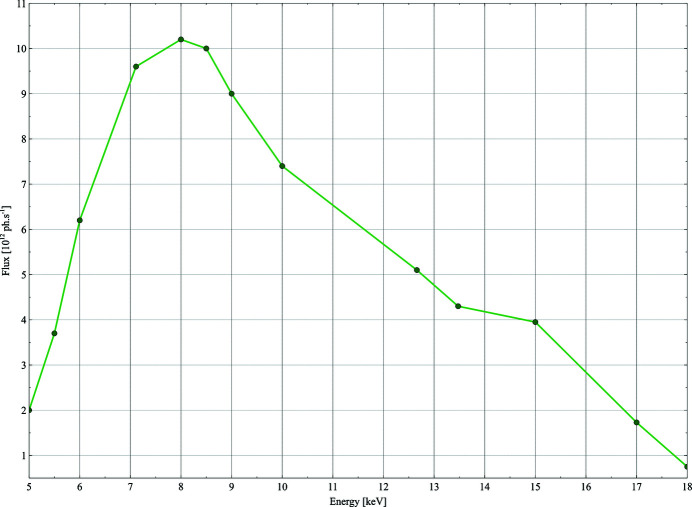
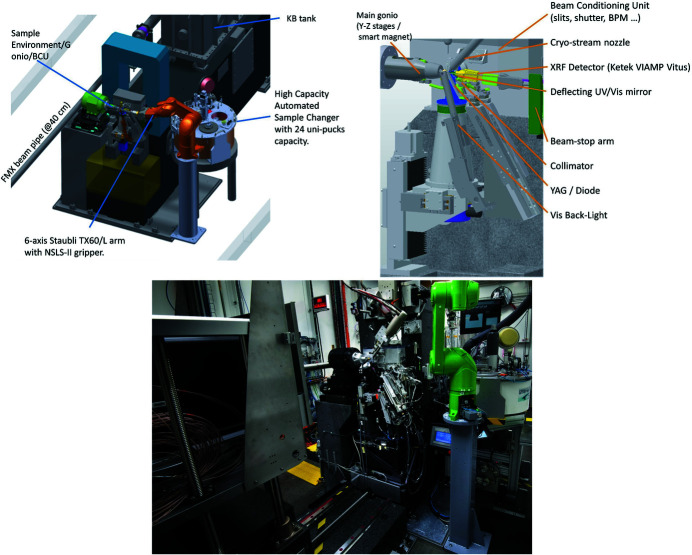
The highly automated macromolecular crystallography beamline AMX/17-ID-1 is an undulator-based high-intensity (>5 × 10¹² photons s-1), micro-focus (7 µm × 5 µm), low-divergence (1 mrad × 0.35 mrad) energy-tunable (5-18 keV) beamline at the NSLS-II, Brookhaven National Laboratory, Upton, NY, USA. It is one of the three life science beamlines constructed by the NIH under the ABBIX project and it shares sector 17-ID with the FMX beamline, the frontier micro-focus macromolecular crystallography beamline. AMX saw first light in March 2016 and started general user operation in February 2017. At AMX, emphasis has been placed on high throughput, high capacity, and automation to enable data collection from the most challenging projects using an intense micro-focus beam. Here, the current state and capabilities of the beamline are reported, and the different macromolecular crystallography experiments that are routinely performed at AMX/17-ID-1 as well as some plans for the near future are presented.

Keywords: automation; beamline; high throughput; macromolecular crystallography; micro-beam; real-time feedback; synchrotron source.


Figures

Figure 1
Figure 1
The AMX beamline layout (not to scale). AMX is served by the upstream (17-ID-1) IVU21 undulator, FMX by the downstream (17-ID-2) one. The beam of AMX is shown in red and that of FMX in blue. All distances are given with respect to the center of the short straight section, between the two undulators. The distance between the center of the AMX IVU and the center of the short straight section is 1.3 m.
Figure 2
Figure 2
AMX beam profile obtained during the hot commissioning of the beamline (2016). AMX beam spot at focus as detected by a tungsten knife-edge scan in the horizontal and vertical directions. Left: horizontal profile with a 6.6 µm FWHM. Right: vertical profile with a 4.8 µm FWHM.
Figure 3
Figure 3
AMX photon flux at the sample position across the photon energy range 5–18 keV. Measurements performed at 400 mA ring current. At lower energies, the flux is diminished due to absorption in the Be exit window and the remaining air path to the sample (∼30 cm). A 50 µm-thick electronic-grade CVD diamond single-crystal BPM further attenuates the beam intensity but can be retracted.
Figure 4
Figure 4
AMX endstation. Top left: design of the sample environment including most devices. Top-right: design of the end-station showing the main components. Bottom: photograph of the AMX endstation with the Eiger X 9M on the left and the six-axis TX60L arm/24-unipucks dewar on the right.
Figure 5
Figure 5
The sample rate (gray) is the number of samples the robot can mount excluding all other procedures such as crystal centering or data collection. Green represents reliability expressed as the percentage of successfully mounted samples. For a detailed definition of reliability, see Lazo et al. (2021 ▸).
Figure 6
Figure 6
(a) The samples/requests view is displayed in the left column, data acquisition parameters including access to all protocols are set in the center, and the sample video view including centering modes and interactive feedback of the raster heat map is displayed in the right column. Two of the pan zoom tilt (PZT) camera views are also displayed in the GUI so that users have a good overview of what is happening in real time at the beamline. (b) The drop-down menu of the currently available protocols.
Figure 7
Figure 7
Diffraction data were obtained from one large lysozyme crystal soaked with 50 mM 4-amino­salicylic acid (PAS) and 50 mM 3-amino­phenol (3AP) for 15 min prior to cryo-cooling. Diffraction data were obtained from five regions located near the crystal surface, in 10 µm shells (top left). Diffraction data were also obtained from the center of the crystal (top right). The observed occupancy from the near-surface shells was 90%, 70%, 50%, 30% and 10%, respectively (bottom). The observed occupancy from the center of the crystal was near zero (<5%).
Figure 8
Figure 8
Diffraction data from 146 ChTg crystals. Each data set is shown as a dot according to its unit cell values (x and y coordinates) and according to its grouping after to two-factor clustering (five colors). The data readily partition into two main groups using conventional one-factor clustering (two main populations at left and right), and further subdivide into five sub-groups using two-factor clustering. FTMap was used to compare the predicted binding properties of the different structural polymorphs, which differed markedly between the two main cluster groups (the inset shows binding poses superposed on the protein envelopes of 7ktz and 7ku2).
Figure 9
Figure 9
Workflow for in situ screening on mini-plates followed by full data collection on a harvested crystal. A single crystal was obtained from acoustically prepared nanolitre crystallization screens. The crystal was screened in situ at room temperature (left), then full vector data were obtained at 100 K after harvesting (middle), and the data were used to solve the structure (right, purple structure; see Moon et al., 2018 ▸).
Figure 10
Figure 10
Sample throughput at the AMX and FMX beamlines. Total number of samples mounted at each of the two MX beamlines at the NSLS-II including samples from proprietary users. Sample throughput in calendar year 2020 is lower than expected due to the effect of the pandemic. Nevertheless, the AMX and FMX beamlines remained in operation to support ongoing efforts to deal with the pandemic including inhouse research on the main protease, the receptor binding domain of the spike protein and a peptide preventing fusion of the SARS-CoV-2 with the host cell membrane.

References

    1. Allan, D., Caswell, T., Campbell, S. & Rakitin, M. (2019). Synchrotron Radiat. News, 32(3), 19–22.
    1. Arndt, U. W. & Wonacott, A. J. (1977). Rotation Method in Crystallography. Amsterdam: North-Holland.
    1. Berman, L. E., Allaire, M., Chance, M. R., Hendrickson, W. A., Héroux, A., Jakoncic, J., Liu, Q., Orville, A. M., Robinson, H. H., Schneider, D. K., Shi, W., Soares, A. S., Stojanoff, V., Stoner-Ma, D. & Sweet, R. M. (2011). Nucl. Instrum. Methods Phys. Res. A, 649, 131–135. - PMC - PubMed
    1. Bernstein, H. J., Förster, A., Bhowmick, A., Brewster, A. S., Brockhauser, S., Gelisio, L., Hall, D. R., Leonarski, F., Mariani, V., Santoni, G., Vonrhein, C. & Winter, G. (2020). IUCrJ, 7, 784–792. - PMC - PubMed
    1. Bowler, M. W., Nurizzo, D., Barrett, R., Beteva, A., Bodin, M., Caserotto, H., Delagenière, S., Dobias, F., Flot, D., Giraud, T., Guichard, N., Guijarro, M., Lentini, M., Leonard, G. A., McSweeney, S., Oskarsson, M., Schmidt, W., Snigirev, A., von Stetten, D., Surr, J., Svensson, O., Theveneau, P. & Mueller-Dieckmann, C. (2015). J. Synchrotron Rad. 22, 1540–1547. - PMC - PubMed

MeSH terms

Substances