

Temporal and sequential transcriptional dynamics define lineage shifts in corticogenesis
- PMID: 36345783
- PMCID: PMC9753470
- DOI: 10.15252/embj.2022111132
Temporal and sequential transcriptional dynamics define lineage shifts in corticogenesis
Abstract
The cerebral cortex contains billions of neurons, and their disorganization or misspecification leads to neurodevelopmental disorders. Understanding how the plethora of projection neuron subtypes are generated by cortical neural stem cells (NSCs) is a major challenge. Here, we focused on elucidating the transcriptional landscape of murine embryonic NSCs, basal progenitors (BPs), and newborn neurons (NBNs) throughout cortical development. We uncover dynamic shifts in transcriptional space over time and heterogeneity within each progenitor population. We identified signature hallmarks of NSC, BP, and NBN clusters and predict active transcriptional nodes and networks that contribute to neural fate specification. We find that the expression of receptors, ligands, and downstream pathway components is highly dynamic over time and throughout the lineage implying differential responsiveness to signals. Thus, we provide an expansive compendium of gene expression during cortical development that will be an invaluable resource for studying neural developmental processes and neurodevelopmental disorders.
Keywords: cortical development; lineage specification; networks; signaling pathways; transcriptional landscape.
© 2022 The Authors. Published under the terms of the CC BY NC ND 4.0 license.
Figures
- A
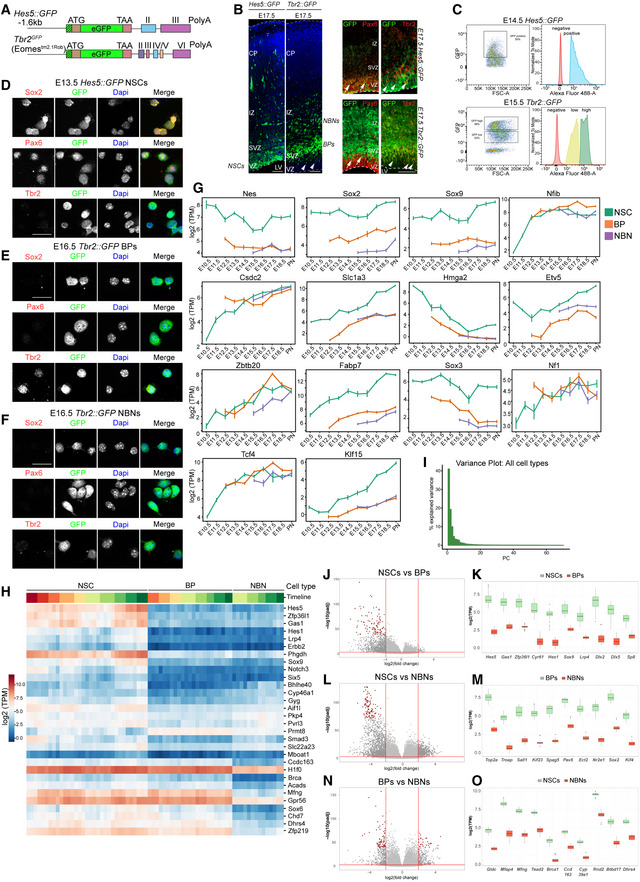
Hes5::GFP and Tbr2::GFP transgenic mice used for cell isolation.
- B
Expression of Hes5::GFP and Tbr2::GFP embryonic cortices at E17.5. Scale bar = 100 μm. Arrowheads pointing to Tbr2::GFP cells in VZ. Immunostainings for Pax6 and Tbr2 with Hes5::GFP and Tbr2::GFP coronal sections from E17.5. Arrows point to GFP+Pax6+ cells and arrowheads point to GFP+Tbr2+ cells. Scale bare = 100 μm.
- C
Examples of FACS plots for GFP positive cell sorting at E14.5 Hes5::GFP and E15.5 Tbr2::GFP.
- D–F
Expression validation of Hes5::GFP and Tbr2::GFP positive cells after FAC sorting in vitro. Scale bar = 20 μm.
- G
Expression plots of some known markers of NSCs. Each dot defines the mean and lines define the SD. Three to four biological replicates were collected for each time point.
- H
Heatmap showing differentially expressed genes in three cell populations illustrating NSCs, BPs and NBNs vary in expression, based on z‐scored log2(TPM) expression values.
- I
Bar plot representing the proportion of variance covered by each PC in PCA of all cell types.
- J, L, N
Volcano plots for DEG analysis for NSCs versus BPs, NSCs versus NBNs and BPs versus NBNs, respectively. Significantly DEGs are colored as gray and top 100 DEGs are colored by red.
- K, M, O
Top 10 DEGs for NSCs versus BPs, NSCs versus NBNs, and BPs versus NBNs, respectively. Central band is the median, the whiskers define the upper and lower limit, and the box defines the interquartile ranges. (J–O) are related to analysis of Fig 1E. The range of P‐values is very different: NSC (0.01–0.4%), BP (1.6–4.9%), NBN (0.06–0.2%). There are no good marker genes for BPs as their gene expression tends to be similar to either NSC or NBN.
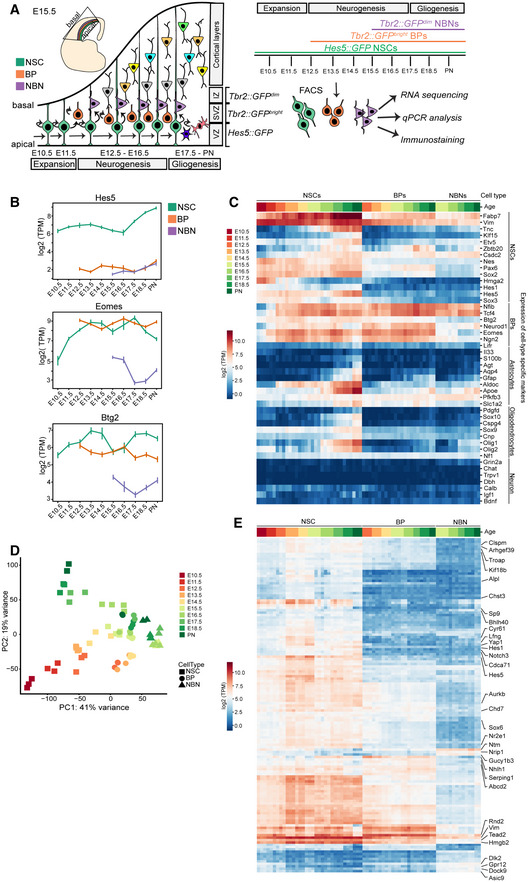
Overview of the biological system with experimental paradigm, illustrating NSCs, BPs, and NBNs were isolated at each day during development from E10.5 to PN.
Notch signaling effector Hes5 is expressed high in NSCs while Eomes (Tbr2) and Btg2 are expressed high in both NSCs and BPs at the mRNA level. Each dot defines the mean and lines define the Standard Deviation (SD). Three to four biological replicates were collected for each time point.
Heatmap validating the known cell‐type specific marker gene expression from RNA sequencing data.
Principal Component Analysis (PCA) projection of all samples of NSCs, BPs, and NBNs throughout development onto the first two principal components (PCs) covering maximum variance reveals that PC1 sorts samples by cell type and PC2 sorts samples by developmental stage.
Heatmap illustrating the novel marker genes identified from the RNA sequencing data, as signature genes for NSCs, BPs, and NBNs. BPs, basal progenitors; E, embryonic day; IZ, intermediate zone; NBNs, newborn neurons; NSCs, neural stem cells; PN, post natal; SVZ, subventricular zone; VZ, ventricular zone. Expression values on the heatmaps are log2 (transcripts per million).
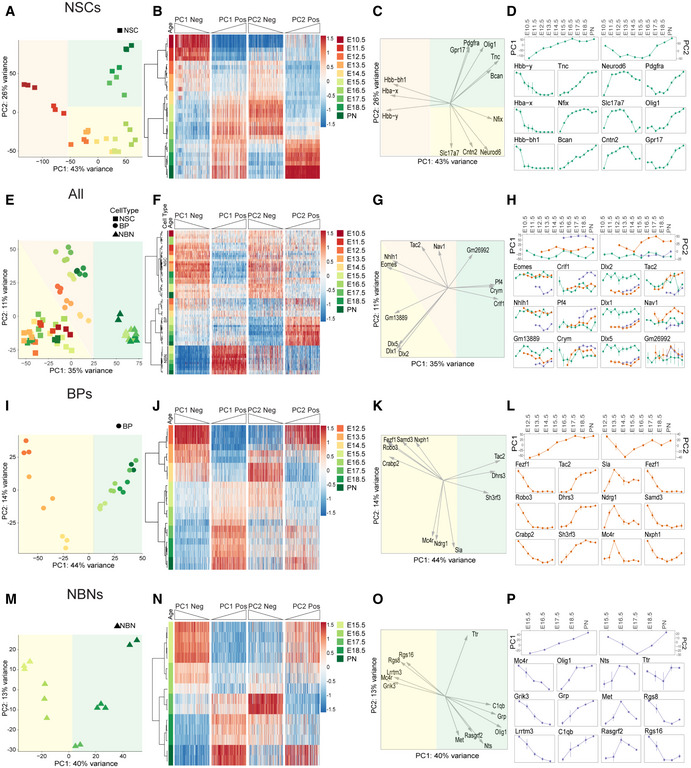
PCA of NSCs from E10.5 to PN showing their transcriptional dynamics.
Heatmap of genes that have the highest contribution to the PC1 and PC2 for NSCs, sorted by their projection on the PC axis (250 most positive and 250 most negative, Dataset EV2).
Projections of the expression profiles of example genes onto the first two PCs, showing the developmental stage at which, they are most highly expressed.
Expression profiles of PC1 and PC2 along developmental time (top) and expression profiles of the top three genes with highest negative and positive projection on PC1 (first and second column) and highest negative and positive projection on PC2 (third and fourth column) for NSCs.
PCA of all samples after removal of the first two principal components of the expression profiles of NSCs separates samples by cell type.
Heatmap of genes that have the highest contribution to the PC1 and PC2, sorted by their projection on the PC axis (250 most positive and 250 most negative).
Projections of the expression profiles of example genes onto the first two PCs, showing their differential expression across cell types.
Expression profiles of PC1 and PC2 across all samples with time from left to right and NSCs in green, BPs in red, and NBNs in purple (top), and the gene expression profiles of top three genes with highest negative and positive projection on PC1 (first and second column) and highest negative and positive projection on PC2 (third and fourth column).
PCA of BPs from E12.5 to PN showing their transcriptional dynamics.
As in panel (B) but now for BPs.
As in panel (C) but now for BPs.
As in panel (D) but now for BPs.
PCA of NBNs from E15.5 to PN showing their transcriptional dynamics.
As in panels (B) and (J) but now for NBNs.
As in panels (C) and (K) but now for NBNs.
As in panels (D) and (L) but now for NBNs.
- A
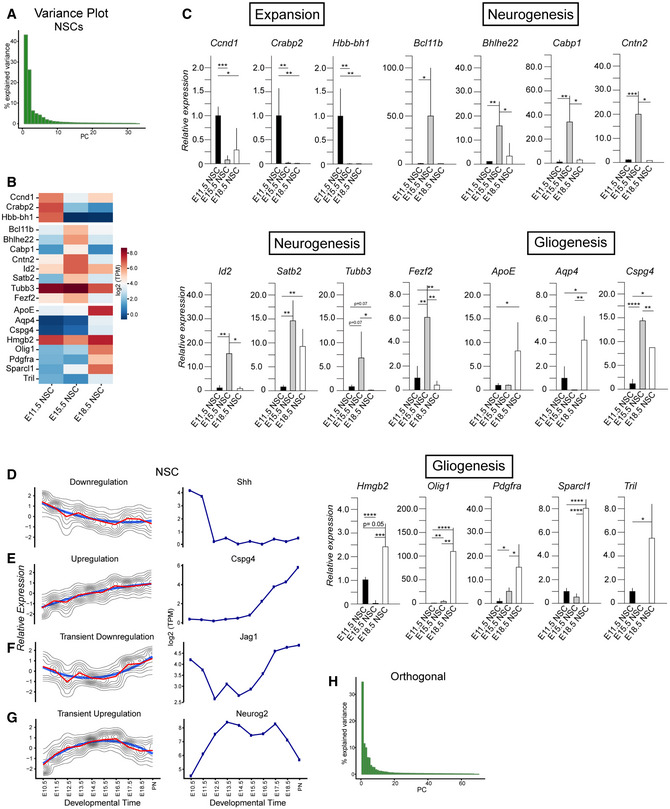
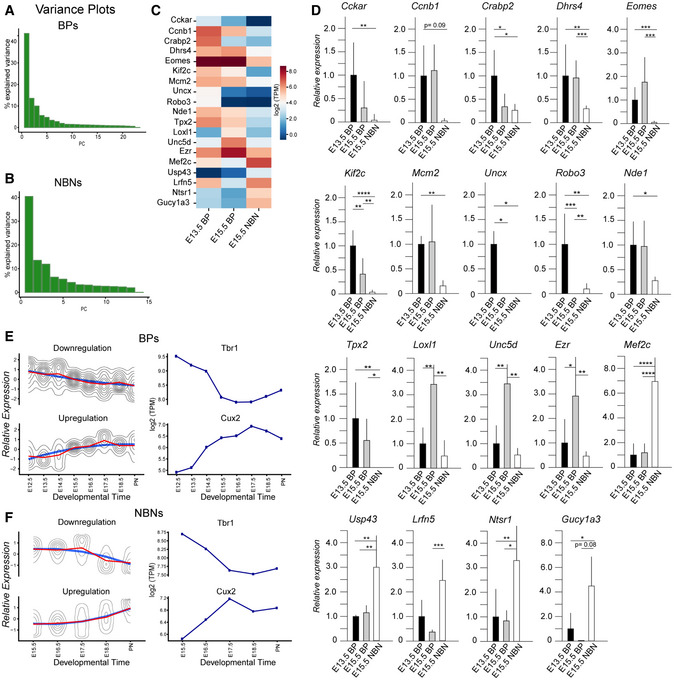
Bar plot representing the variance coverage by PC corresponding to PCA plot in Fig 2A.
- B
Heatmap illustrating the expression changes in signature genes in time points corresponding to expansion, neurogenesis, and gliogenesis.
- C
qPCR validation of signature genes in three zones. Each time point has samples varying from N = 3 to N = 7 biological replicates. (Statistical test used‐ Unpaired Student's t‐test, *P < 0.05, **P < 0.01, ***P < 0.001, ****P < 0.0001).
- D–G
k‐Means clustering of z‐scored log2 (TPM) gene expression profiles over developmental time course in NSCs with genes showing upregulation, e.g., Cspg4, downregulation, e.g., Shh, transient downregulation, e.g., Jag1, transient upregulation, e.g., Neurog2.
- H
Bar plot representing the variance coverage by PC corresponding to PCA plot in Fig 2E.
- A, B
Bar plots representing the variance coverage by PCs corresponding to PCA plot in Fig 2I and M.
- C
Heatmap illustrating the expression changes in signature genes in time points corresponding to early BPs, mid‐BPs, and NBNs.
- D
qPCR validation of signature genes for three sample types. Each time point has samples varying from N = 3 to N = 7 biological replicates (statistical test used—Unpaired Student's t‐test, *P < 0.05, **P < 0.01, ***P < 0.001, ****P < 0.0001).
- E
k‐Means clustering of z‐scored log2(TPM) gene expression profiles over developmental time course in BPs with genes showing downregulation, e.g., Tbr1 and upregulation, e.g., Cux2.
- F
k‐Means clustering of z‐scored log2(TPM) gene expression profiles over developmental time course in NBNs with genes showing downregulation, e.g., Tbr1 and upregulation e.g., Cux2.
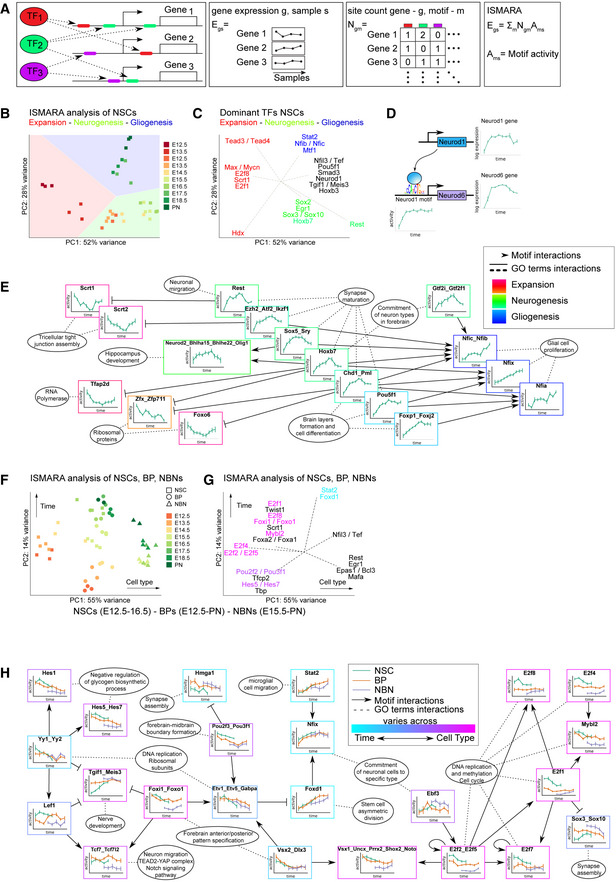
Conceptual illustration of ISMARA, which models gene expression profiles in terms of the activities of TF binding motifs. ISMARA models the matrix of gene expression E as a linear function of computationally predicted TF binding sites in the promoters of each gene (site count matrix N) and activities of TF binding motifs across samples (matrix A).
PCA projection of the motif activity profiles of the NSCs for all time points onto the first two PC components, which capture 80% of the total variance in motif activities. The background color represents segments of the plane spanned by the first two PCs corresponding to the expansion (red, E10.5‐E11.5), neurogenesis (green, E12.5‐E15.5), and gliogenesis (purple, E16.5‐PN) phases.
Top 20 motifs contributing the most to the first two PCs, projected on the first two PCs, illustrating which TFs are active in each developmental stage.
Example of a predicted regulatory interaction between two TFs. ISMARA predicts that the Neurod1 motif upregulates expression of the Neurod6 gene through a binding site in its promoter. Note that the Neurod1 motif activity (bottom) is upregulated in parallel with its gene expression (top right), indicating it acts as an activator, and that Neurod6 gene expression is: similarly upregulated across developmental time (bottom right).
Core regulatory network of most significant motif‐motif interactions in the NSC dynamics, together with overrepresented gene ontology categories among the target genes of different core regulatory motifs. The motif activity profile of each core regulatory motif is shown framed with a color representing the developmental stage at which its most active (red for expansion, green for neurogenesis, and blue for gliogenesis). Edges from motifs A to B correspond to predicted regulatory interactions with motif A either activating or repressing activity of motif B. Ellipses indicate top Gene Ontology categories overrepresented among the target genes of different motifs.
PCA projection of the motif activity profiles of NSCs from the neurogenesis phase (day 12.5–16.5), BPs and NBNs, which capture 69% of the total variance.
Top 20 motifs contributing the most to the first two principal components, projected on the first two PCs of panel, illustrating which TFs distinguish cell types and developmental stages.
Core regulatory network and overrepresented gene ontology categories as in panel E but now for analysis of the samples of the BPs, NBNs and NSCs from the neurogenesis stage. Motif activity profiles are shown as a function of time for NSCs (green), BPs (red), and NBNs (purple) and are framed with a color indicating whether the motif activity varies mainly across time (blue) or cell type (pink).
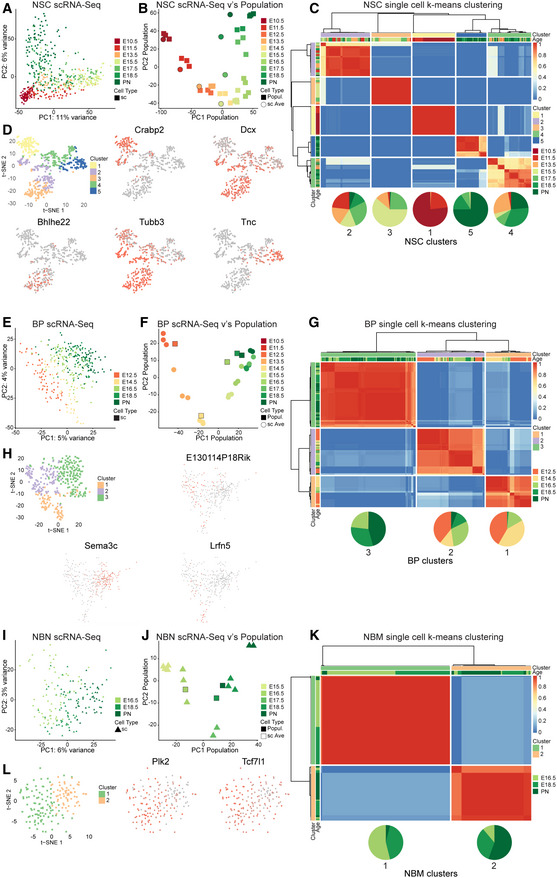
PCA of NSC single cells, using the top 2,000 highly variable genes (HVGs) obtained from bulk NSCs.
Projection of average single cells of NSCs at each time point on the first two PCs of bulk NSCs using the top 2,000 HVGs obtained from bulk NSCs.
Clustering of assignment matrix of NSC single cells using k‐means and hierarchical clustering.
Marker genes that are up/downregulated in each cluster of NSCs.
PCA of BP single cells, using the top 2,000 highly variable genes obtained from bulk BPs.
Projection of average BP single cells on the first two PCs of bulk BPs using the top 2,000 HVGs obtained from bulk BPs.
Clustering of assignment matrix of NBN single cells using k‐means and hierarchical clustering.
Marker genes that are up/down regulated in each cluster of NBNs.
PCA of NBN single cells, using the top 2,000 HVGs obtained from bulk NBNs.
Projection of average single cells of NBNs on the first two PCs of bulk NBNs using the top 2,000 HVGs obtained from bulk NBNs.
Clustering of assignment matrix of NBN single cells using k‐means and hierarchical clustering.
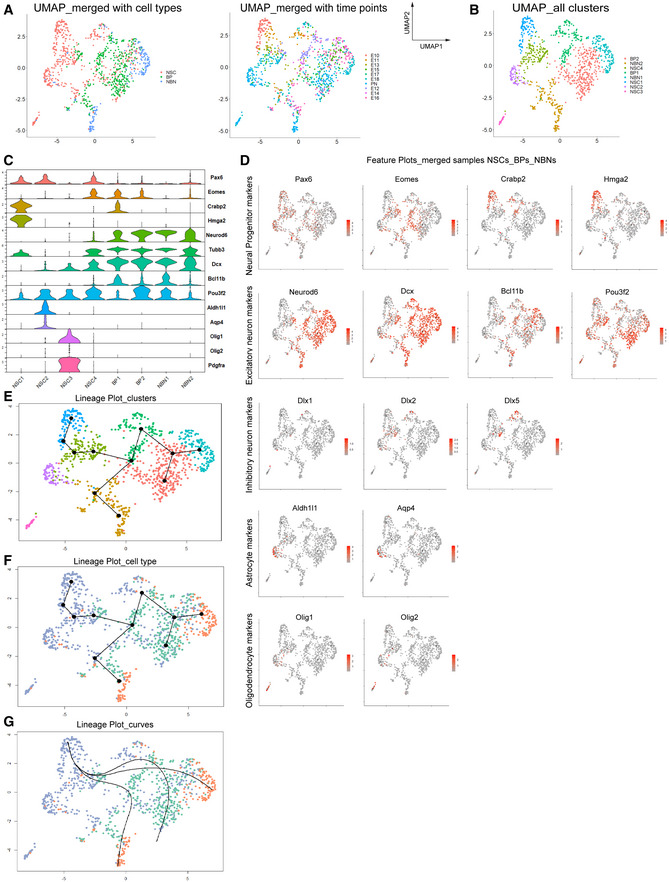
UMAP clustering of all NSCs, BPs, and NBNs, visualized based on cell type and time point.
UMAP clustering showing all cell types, four clusters of NSCs, two of BPs, and two of NBNs.
Violin plots of highly enriched genes in each cluster, labeled with gene and cluster names.
Feature plots showing examples of highly enriched genes in the neuronal lineage, identifying excitatory neuron, inhibitory neuron, astrocytic and oligodendrocytic clusters. Y axis is the log normalized expression.
Visualization of inferred trajectory based on UMAP embeddings showing a neurogenic lineage from NSCs, to BPs to NBNs, with a time component. Colors represent the cell types shown in (B).
Visualization of inferred trajectory overlaid on cell type, capturing neurogenic lineage.
Smooth representations of lineage trajectory using principal curves overlaid on cell types showing a neurogenic lineage from NSCs to BPs to NBNs.
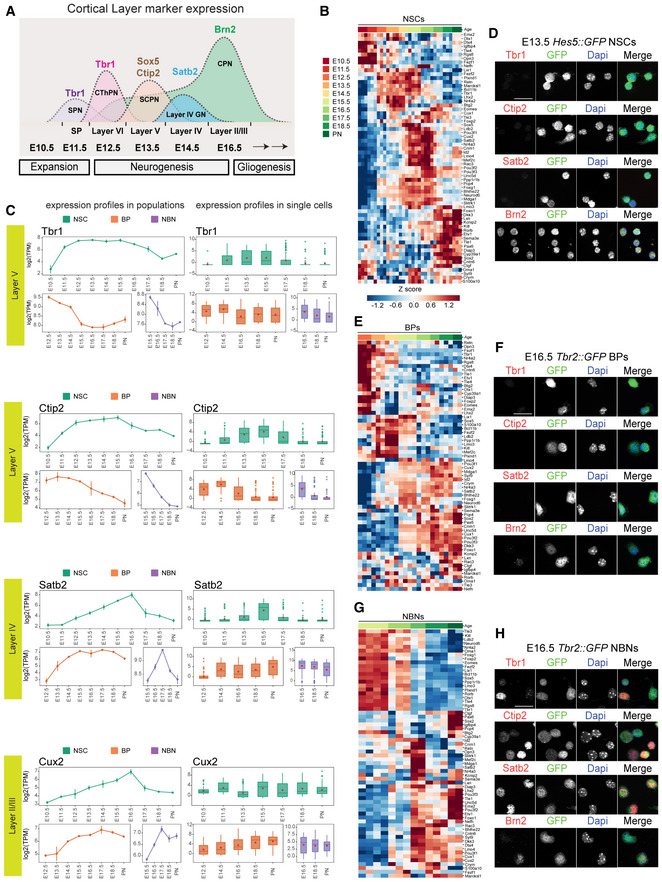
Illustration of distinct projection neurons born sequentially during neurogenesis.
Heatmap illustrating the dynamics of expression of cortical layering markers in NSCs at population level.
Examples of expression dynamics of deep layer markers Tbr1, Ctip2 and upper layer markers Satb2, Cux2 in NSCs, BPs, and NBNs, profiles at population level (left) and single cell level (right). Each dot defines the mean and lines define the SD. Three to four biological replicates were collected for each time point.
Experimental validation of NSCs isolated at E13.5 using Hes5::GFP transgenic embryos, showing no detectable protein for Tbr1, Ctip2 and Satb2. NSCs do express Brn2 (Pou3f2) in vitro and in vivo at protein level. Scale bar = 20 μm.
Heatmap illustrating the dynamics of expression of cortical layering markers in BPs at population level.
Experimental validation of BPs isolated at E16.5 using Tbr2::GFP transgenic embryos, showing no detectable protein for Tbr1, Ctip2 and Satb2. Scale bar = 20 μm.
Heatmap illustrating the dynamics of expression of cortical layering markers in NBNs at population level.
Experimental validation of NBNs isolated at E16.5 using Tbr2::GFP transgenic embryos, showing protein expression for Tbr1, Ctip2, Satb2 and Brn2(Pou3f2). Scale bar = 20 μm.
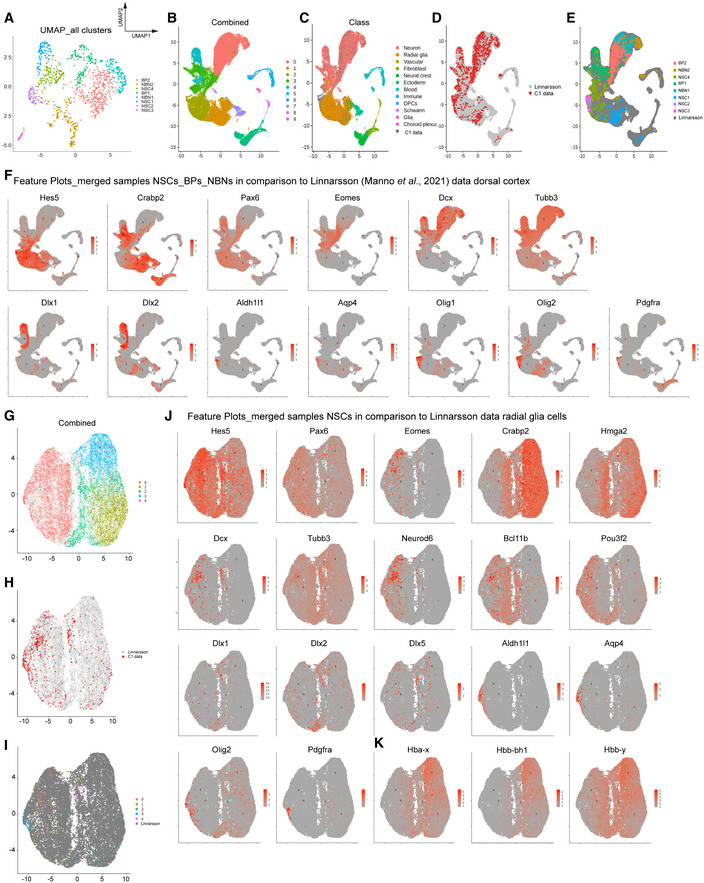
UMAP visualization of identified clusters of NSCs, BPs and NBNs when analyzed together, segregating all cells in eight clusters—four NSC, two BP, and two NBN clusters.
UMAP visualization of post CCA integrated merged dataset containing C1 and dissected forebrain and dorsal forebrain cells; Linnarsson dataset from (La Manno et al, 2021), into 10 clusters.
UMAP clustering visualization of Linnarsson dataset with C1 data post CCA. Cells are labeled with established “Class” from original manuscript. Our NSCs and NBNs fall in Linnarsson radial glia and neuronal clusters.
C1 data maps onto Linnarsson clusters.
UMAP clustering visualization after CCA. Cells are labeled by our previously identified clusters. Our C1 clusters integrate mostly with Linnarsson radial glia and neuronal clusters and maintain their separate clustering.
Example feature plots showing consistent expression of markers in NSCs, BPs and NBNs between two datasets. Y‐axis is the log normalized expression.
UMAP clustering visualization post CCA integration of C1 NSCs and radial glial classed cells from Linnarsson dataset, segregating in five clusters.
Positional mapping of C1 onto Linnarsson clusters.
After CCA integration, we find C1 NSCs integrate well with Linnarsson radial glial cells. Cells labeled with our previously identified five NSC clusters.
Example feature plots showing consistent expression of markers in NSCs and radial glial cells, between two datasets.
Example feature plots showing consistent expression of Hbb subunits in NSCs and radial glial cells, between two datasets.
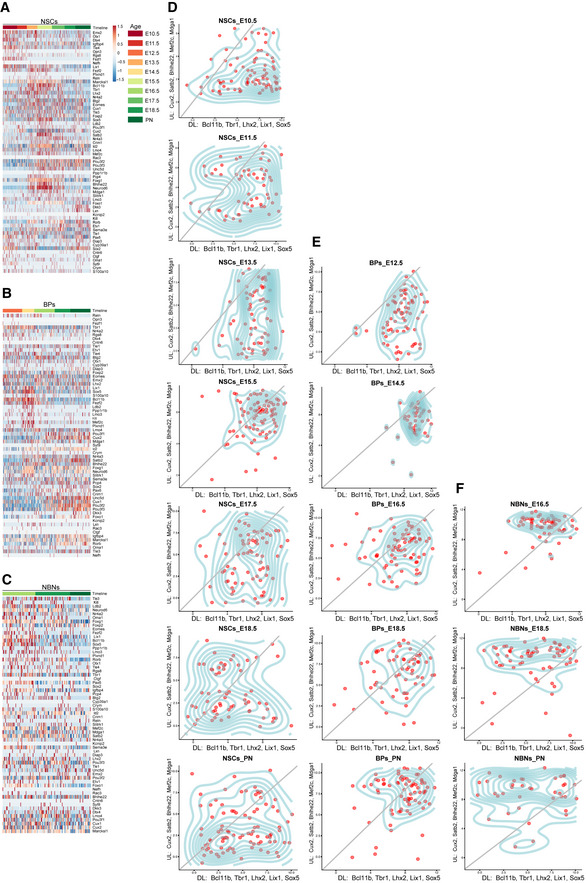
Heatmap of cortical layer markers in NSC single cells, based on z‐scored log2(TPM) expression values.
Heatmap of cortical layer markers in BP single cells, based on z‐scored log2(TPM) expression values.
Heatmap of cortical layer markers in NBN single cells, based on z‐scored log2(TPM) expression values.
Temporal distribution of NSC single cells along the deep or upper layer markers.
Temporal distribution of BP single cells along the deep or upper layer markers.
Temporal distribution of NBN single cells along the deep or upper layer markers.
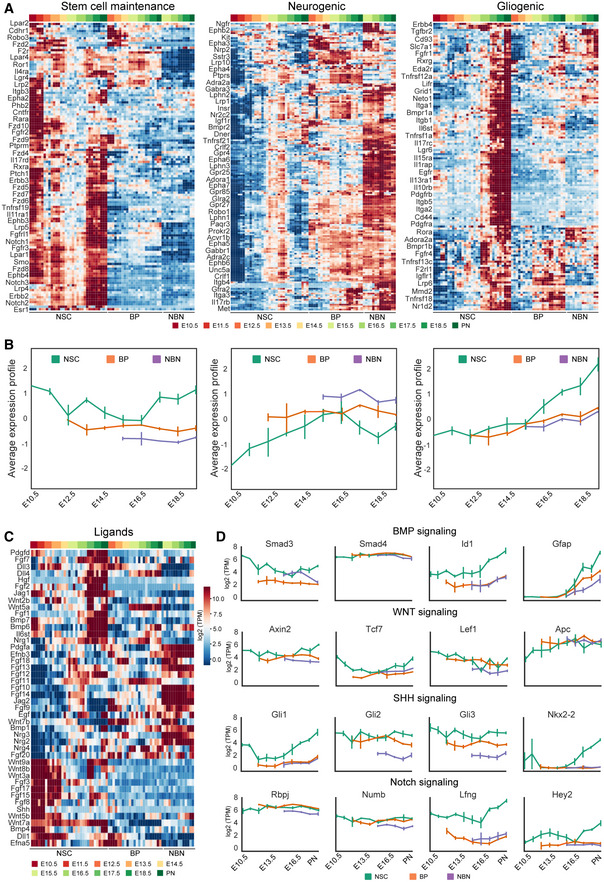
Heatmaps representing the expression profile of signaling receptors that can be divided into three main groups based on k‐means clustering of z‐scored log2(TPM) expression values: stem cell maintenance (121 receptors), neurogenic (180 receptors), and gliogenic (139 receptors). Names of selected receptors are displayed. For the complete list please see Dataset EV7. Expression profiles are represented by their z‐score.
Average expression profile of each cluster for NSCs (green), BP (orange), and NBN (purple). Solid line represents the average z‐score, while the area represents the SD estimated from different biological samples. Three to four biological replicates were collected for each time point.
Heatmap representing the expression profile of ligands from selected signaling pathways, based on the z‐scored log2(TPM) expression values.
Expression profile of selected target or modulator of key signaling pathways: BMP, Wnt, Shh and Notch signaling. Each dot defines the mean and lines define the SD. Three to four biological replicates were collected for each time point.
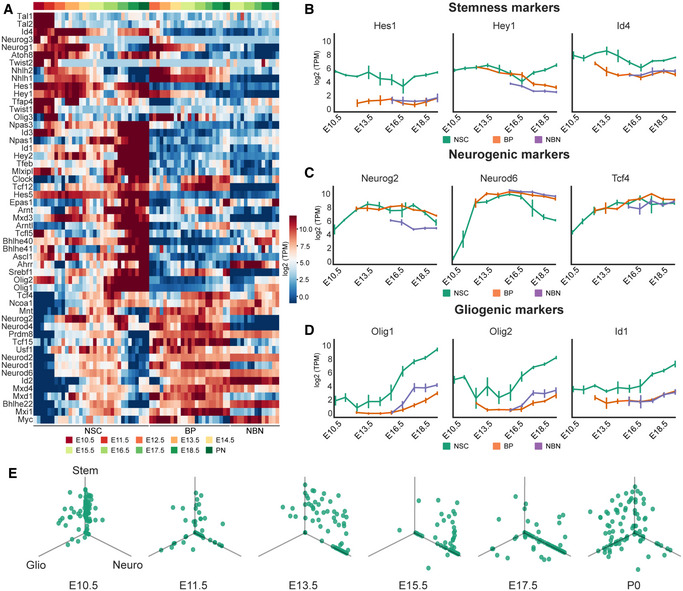
Heatmaps representing the expression profile of bHLH factors. Three main groups are observed based on k‐means clustering of z‐scored log2(TPM) of expression value: stem cell maintenance (high expression in the NSCs at early embryonic times and low in BPs and NBNs), neurogenic (high expression in the NSCs during neurogenesis and high expression in BPs and NBNs), and gliogenic (high expression in the NSCs at late embryonic times and low in BPs and NBNs). Expression profiles are represented by their z‐score.
Expression profile of selected stem cell maintenance markers Hes1, Hey1 and Id4. Each dot defines the mean and lines define the SD. Three to four biological replicates were collected for each time point.
Expression profile of selected neurogenic markers Neurog2, Neurod2, and Neurod6. Each dot defines the mean and lines define the SD. Three to four biological replicates were collected for each time point.
Expression profile of selected gliogenic markers Olig1, Olig2 and Id1. Each dot defines the mean and lines define the SD. Three to four biological replicates were collected for each time point.
Expression of stem cell markers (Hes1, Hey1 and Id4), neurogenic markers (Neurog2, Neurod2, and Neurod6) and gliogenic markers (Olig1,2 and Id1) in NSCs during different embryonic time points in the single‐cell levels. Each point represents the expression value of one single cell in log2(TPM).
References
-
- Arlotta P, Molyneaux BJ, Chen J, Inoue J, Kominami R, Macklis JD (2005) Neuronal subtype‐specific genes that control corticospinal motor neuron development in vivo . Neuron 45: 207–221 - PubMed
Publication types
MeSH terms
Grants and funding
LinkOut - more resources
Full Text Sources
Molecular Biology Databases
Research Materials
Miscellaneous
