. 2022 Nov 8;7(21):e159751.
doi: 10.1172/jci.insight.159751.

Distinct pathogenic roles for resident and monocyte-derived macrophages in lupus nephritis

Affiliations

Distinct pathogenic roles for resident and monocyte-derived macrophages in lupus nephritis

Nathan Richoz et al. JCI Insight. .

Abstract

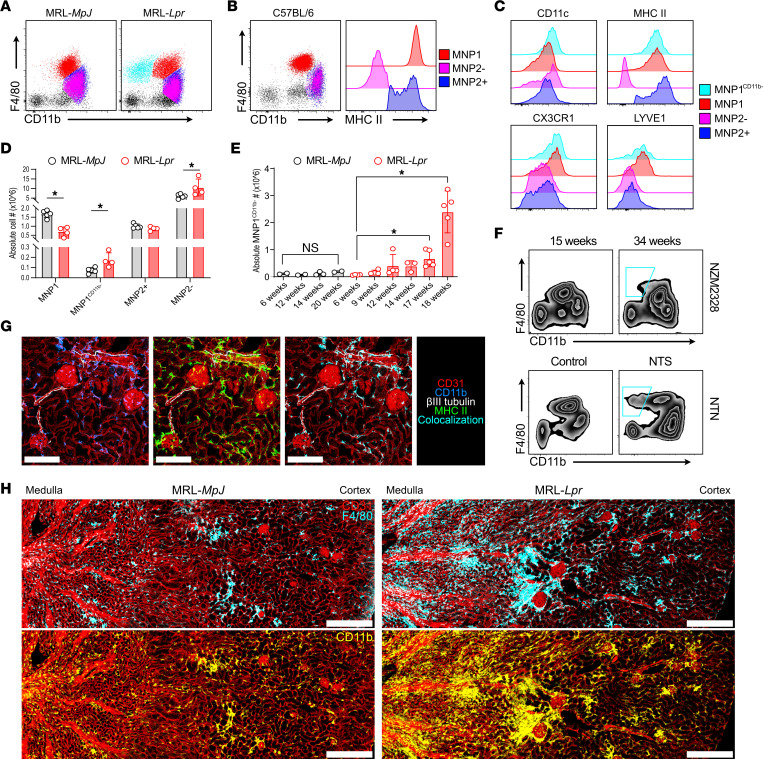
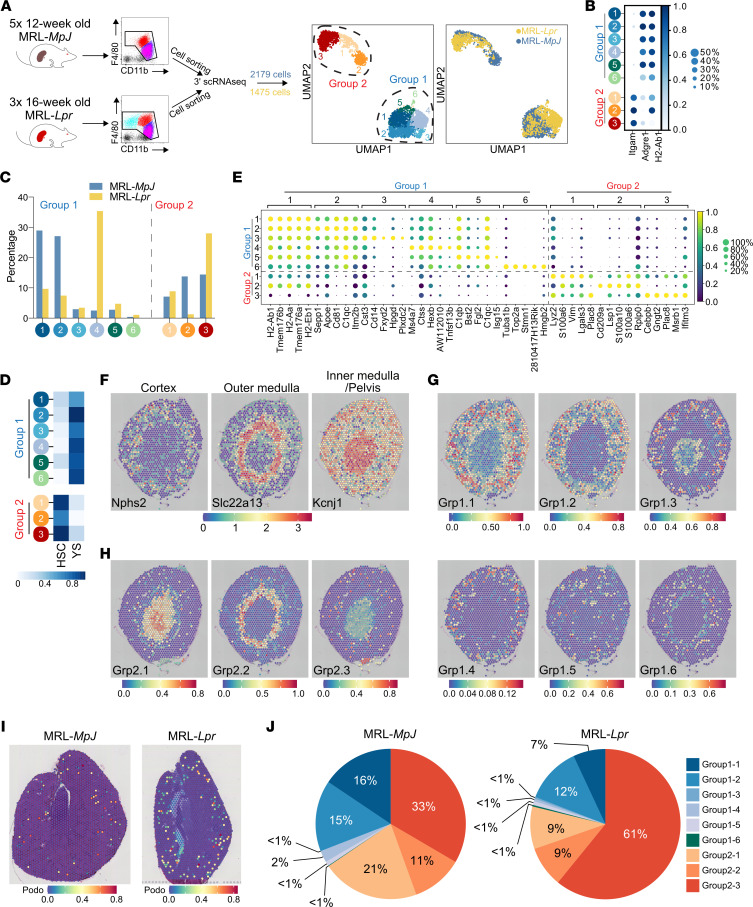
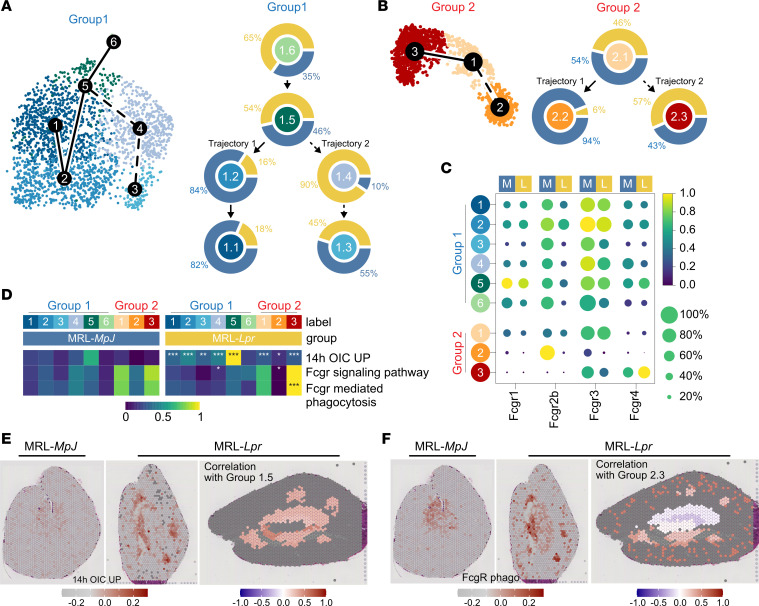
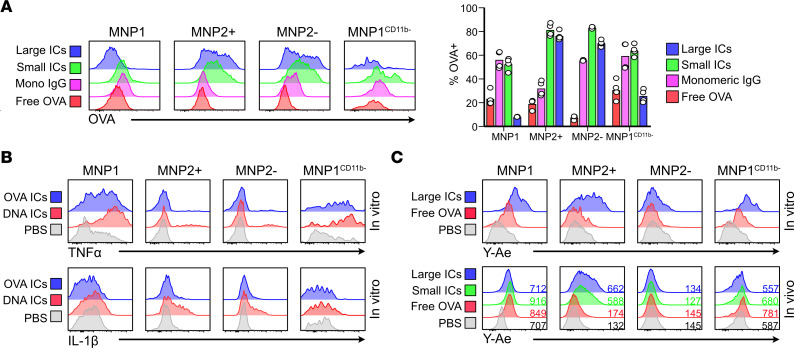
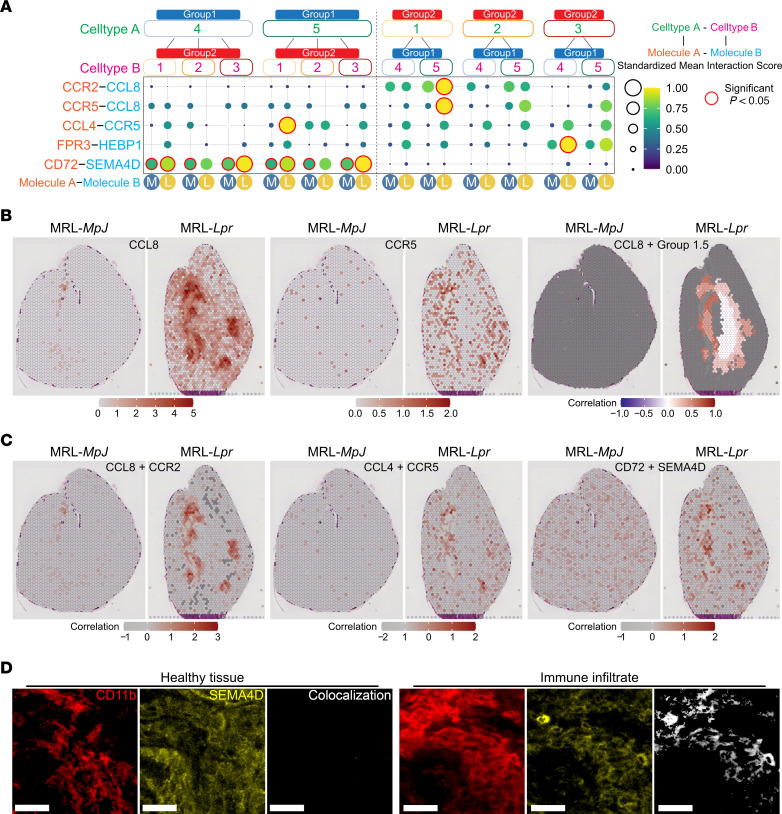
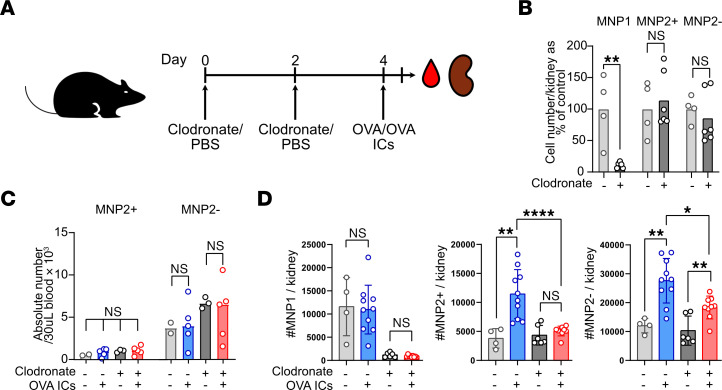
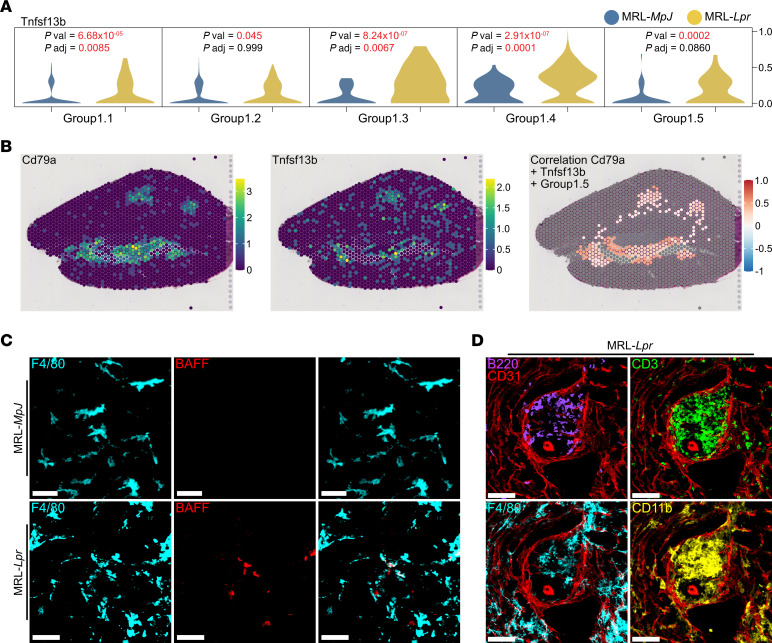
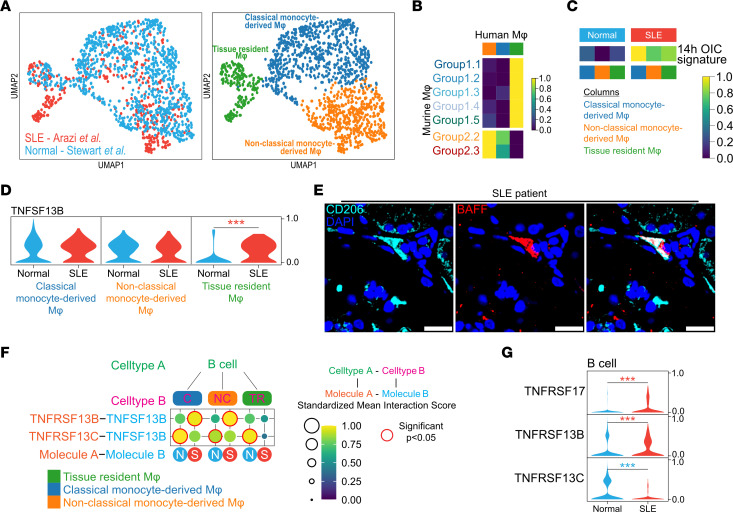
Lupus nephritis is a serious complication of systemic lupus erythematosus, mediated by IgG immune complex (IC) deposition in kidneys, with limited treatment options. Kidney macrophages are critical tissue sentinels that express IgG-binding Fcγ receptors (FcγRs), with previous studies identifying prenatally seeded resident macrophages as major IC responders. Using single-cell transcriptomic and spatial analyses in murine and human lupus nephritis, we sought to understand macrophage heterogeneity and subset-specific contributions in disease. In lupus nephritis, the cell fate trajectories of tissue-resident (TrMac) and monocyte-derived (MoMac) kidney macrophages were perturbed, with disease-associated transcriptional states indicating distinct pathogenic roles for TrMac and MoMac subsets. Lupus nephritis-associated MoMac subsets showed marked induction of FcγR response genes, avidly internalized circulating ICs, and presented IC-opsonized antigen. In contrast, lupus nephritis-associated TrMac subsets demonstrated limited IC uptake, but expressed monocyte chemoattractants, and their depletion attenuated monocyte recruitment to the kidney. TrMacs also produced B cell tissue niche factors, suggesting a role in supporting autoantibody-producing lymphoid aggregates. Extensive similarities were observed with human kidney macrophages, revealing cross-species transcriptional disruption in lupus nephritis. Overall, our study suggests a division of labor in the kidney macrophage response in lupus nephritis, with treatment implications - TrMacs orchestrate leukocyte recruitment while MoMacs take up and present IC antigen.

Keywords: Autoimmunity; Immunology; Lupus; Macrophages.


Figures

Figure 1
Figure 1. Expanded kidney macrophage populations in lupus nephritis.
(A) Representative CD11b versus F4/80 expression by kidney MNPs in MRL-MpJ (left) and MRL-Lpr (right) mice. (B) Representative CD11b versus F4/80 and MHCII expression by kidney MNPs in C57BL/6 mice with cells identified as MNP1 (F4/80hiCD11bintMHCIIhi), MNP2+ (F4/80intCD11bhiMHCII+), and MNP2 (F4/80intCD11bhiMHCII). (C) Surface expression of CD11c, MHCII, CX3CR1, and LYVE-1 by kidney MNP subsets in MRL mice. (D) Absolute cell numbers of kidney MNPs in 16-week-old MRL-MpJ and MRL-Lpr mice. n = 5–6 animals per group from 2 separate experiments. *P < 0.05, Mann-Whitney test with Benjamini, Krieger, and Yekutieli posttest. (E) Absolute numbers of MNP1CD11b- per kidney in MRL-MpJ and MRL-Lpr mice with age. n = 2–5 animals per group. *P < 0.05, Mann-Whitney test. (F) Representative CD11b and F4/80 expression by kidney MNPs in young and old NZM2328 mice (top, n = 5) and following administration of nephrotoxic serum in C57BL/6 mice (bottom, n = 6). The cyan outline represents the MNP1CD11b– population in the 34-week-old NZM2328 mouse and the mouse that received NTS. (G) Representative confocal microscopy (n = 3) on murine C57BL/6 kidney showing MNP distribution around peritubular, afferent/efferent blood vessels and glomeruli (CD31, red) as well as surrounding nerves (βIII tubulin, white) through expression of CD11b (blue) and MHCII (green). Scale bar = 150 μm. (H) Representative confocal microscopy (n = 4) showing MNP distribution in kidneys from 18-week-old MRL-MpJ (left) and MRL-Lpr (right) mice through expression of F4/80 (cyan) and CD11b (yellow) relative to blood vessels (CD31, red). Scale bar = 300 μm. int, intermediate; NTS, nephrotoxic serum; NTN, nephrotoxic nephritis.
Figure 2
Figure 2. Lupus nephritis–associated macrophage heterogeneity at single-cell resolution.
(A) Illustration of single-cell experiment setup (left panels) and uniform manifold approximation and projection (UMAP) embedding of 2,179 macrophages from MRL-MpJ and 1,475 macrophages from MRL-Lpr mice (right panels). (B) Mean expression dot plot of genes Itgam (CD11b), Adgre1 (F4/80), and H2-Ab1 (MHCII). (C) Proportion of cells found in each cluster and mouse strain. (D) Heatmap of mean AUCell enrichment of F4/80hi/lo gene sets, corresponding to yolk sac (YS) versus hematopoietic stem cell (HSC) lineage. (E) Mean expression dot plot of top 5 significant marker genes for each MNP cluster. Marker genes were identified using Wilcoxon rank sum test, and P (adj) < 0.05 was considered statistically significant. (F) Spatial expression of markers used to delineate the anatomical regions in Visium Spatial Gene Expression data of C57BL/6 kidney sections (Kcnj1 — pelvis, Slc22a13 — proximal tubules, and Nphs2 — glomeruli). (G) Spatial transcriptomics of group 1 macrophage signatures in C57BL/6 murine kidneys with annotated scRNA-Seq data above. Each spot/voxel denotes a prediction score of 0–1 for the location of each of the macrophage subgroups. (H) Spatial transcriptomics (ST) of group 2 macrophage signatures in C57BL/6 murine kidneys with annotated scRNA-Seq data above. Each spot/voxel denotes a prediction score of 0–1 for the location of each of the macrophage subgroups. (I) ST of podocyte signature in MRL-MpJ (left) and MRL-Lpr (right) kidneys to identify glomerulus-containing spots/voxels. (J) Average proportion of each macrophage subset signature in spots/voxels identified in I in the MRL-MpJ (left) and MRL-Lpr (right) kidneys.
Figure 3
Figure 3. Kidney macrophages show deranged cell state trajectories in lupus nephritis.
(A) (Left) UMAP embedding of group 1 cells with summary tracks of slingshot trajectory connecting the group 1 clusters. (Right) Proportion of cells from MRL-MpJ (blue) or MRL-Lpr (yellow) from each cluster organized according to predicted trajectory. (B) (Left) UMAP embedding of group 2 cells with summary tracks of slingshot trajectory connecting the group 2 clusters. (Right) Proportion of cells from MRL-MpJ (blue) or MRL-Lpr (yellow) from each cluster organized according to predicted trajectory. (C) Mean expression dot plot of FcγR genes split by mouse strain (M = MRL-MpJ; L = MRL-Lpr). (D) Heatmap of mean AUCell enrichment of immune complex (IC) stimulation/cross-linking related gene sets split by MRL-MpJ or MRL-Lpr. Statistical significance testing was performed using pairwise Wilcoxon rank sum tests and adjusted with Bonferroni posttest where *P < 0.05; **P < 0.01; ***P < 0.001. (E) (Left and middle panels) Spatial expression of IC stimulation/cross-linking related gene sets in Visium Spatial Gene Expression data of MRL-MpJ (left) and MRL-Lpr (right) kidney sections. (Right panel) Positive correlation values of expression of gene set with group 1.5 prediction scores across k-nearest neighborhoods of spots are colored from white to red. Gray spots indicate no available scores or negative correlation. (F) (Left and middle panels) Spatial expression of FcγR-mediated phagocytosis-related gene sets in Visium Spatial Gene Expression data of MRL-MpJ (left) and MRL-Lpr (right) kidney sections. (Right panel) Positive correlation values of expression of gene set with group 2.3 prediction scores across k-nearest neighborhoods of spots are colored from white to red. Gray spots indicate no available scores or negative correlation. OIC, opsonized immune complex; UP, upregulated.
Figure 4
Figure 4. Kidney macrophages produce cytokines and present antigen upon IC uptake.
(A) (Left) Uptake of free and immune complexed AF647-OVA by kidney MNPs in vivo 2 hours following intravenous injection in C57BL/6 mice. 5:1 (large), 1:1 (small), and 1:5 (monomeric) molar ratios of rabbit IgGs/OVA were used. (Right) Uptake of free and immune complexed AF647-OVA by kidney MNPs in vivo 2 hours following intravenous injection in C57BL/6 mice. n = 2–4 mice per group from 2 separate experiments. (B) Representative expression (n = 3) of TNF-α (top) and IL-1β (bottom) by each MNP subset after 2 hours of stimulation in vitro with the appropriate condition. (C) Antigen presentation by kidney MNPs in vitro (top, n = 3) 2 hours following stimulation with free or immune complexed Eα-AF647-OVA or in vivo (bottom, n = 4–6 from 2 separate experiments) 4 hours following intravenous injection of free or immune complexed Eα-AF647-OVA in C57BL/6 mice. The number indicates the average gMFI for this channel. AF647, Alexa Fluor 647; gMFI, geometric mean fluorescence intensity.
Figure 5
Figure 5. TrMacs orchestrate monocyte recruitment in lupus nephritis.
(A) CellPhoneDB receptor-ligand interaction analysis between group 1 (group 1.4 and group 1.5) and group 2 (group 2.1, group 2.2, and group 2.3) clusters split by mouse strain (M = MRL-MpJ; L = MRL-Lpr). Significant interactions (P < 0.05) are highlighted in red. (B) Spatial expression of CCL8 and CCR5 in Visium Spatial Gene Expression data of MRL-MpJ (left) and MRL-Lpr (right) kidney sections. (Left and middle) Expression of molecules per spot colored from increasing gradient from white to red, corresponding to increasing expression value. (Right) Positive correlation values of expression of molecules with Group 1.5 prediction scores across k-nearest neighborhoods of spots are colored from white to red. Gray spots indicate no available scores or negative correlation. (C) Positive correlation values of expression of molecules (CCL8 and CCR2, left; CCL4 and CCR5, middle; CD72 and SEMA4D, right) in Visium Spatial Gene Expression data of MRL-MpJ (left) and MRL-Lpr (right) kidney sections. Positive correlation values of expression of molecules are colored from white to red. Gray spots indicate no available scores or negative correlation. (D) Representative confocal microscopy (n = 3) showing SEMA4D expression (yellow) in healthy tissue (left) and a large immune infiltrate (right) in the cortex (left, CD11b — red) in the kidneys from 18-week-old MRL-Lpr mice. Colocalization of CD11b with SEMA4D shown in white. Scale bar = 25 μm.
Figure 6
Figure 6. TrMacs orchestrate IC-dependent monocyte recruitment.
(A) Illustration of the experimental setup for in vivo experiment. (B) Numbers of MNP1 and MNP2 subsets in the kidneys following 2 injections of liposome clodronate shown as percentage of cells in the control (PBS injected) kidneys. n = 4–6 per group. **P < 0.01, Mann-Whitney test with Benjamini, Krieger, and Yekutieli posttest applied. (C) Absolute number of CD11bhiMHCII+ (MNP2+) and MHCII– (MNP2) cells in 30 μL of blood 4 hours following injection of free or complexed OVA in mice that had received clodronate or PBS as described in Figure 3E. n = 2–5 per group. (D) Absolute numbers for each MNP subset 4 hours following i.v. injection of free or immune complexed OVA (right) for each experimental condition in the kidneys. n = 4–10 per group. *P < 0.05, **P < 0.01, ****P < 0.0001, Mann-Whitney test with Benjamini, Krieger, and Yekutieli posttest applied.
Figure 7
Figure 7. TrMacs produce B cell cytokine.
(A) Violin plot of Tnfsf13b (BAFF) in group 1 clusters. (B) Spatial expression of Cd79a and Tnfsf13b in Visium Spatial Gene Expression data of MRL-Lpr kidney section. (Left and middle) Expression of molecules per spot are colored from increasing gradient from purple to green to yellow, corresponding to increasing expression value. (Right) Positive correlation values of expression of molecules with group 1.5 prediction scores across k-nearest neighborhoods of spots are colored from white to red. Gray spots indicate no available scores or negative correlation. (C) Representative confocal microscopy (n = 3 per group) showing BAFF expression (red) in macrophages (F4/80, cyan) in kidneys from 18-week-old MRL-MpJ (top) and MRL-Lpr (bottom) mice. Scale bar = 30 μm. (D) Representative confocal microscopy (n = 3) showing immune infiltrates containing B (B220, purple) and T (CD3, green) cells alongside F4/80+ (cyan) and CD11b+ (yellow) MNPs around blood vessels (CD31, red) in kidneys from MRL-Lpr mice. Scale bar = 70 μm.
Figure 8
Figure 8. Human kidney MNPs show perturbations in FcγR expression, activation, and interactions in lupus nephritis.
(A) Integrated UMAP embedding of macrophages from publicly available data sets of human kidneys (normal, ref. , and SLE, ref. 38). (B) Heatmap of mean AUCell enrichment of mouse group 1 and group 2 signatures in human macrophage clusters. (C) Heatmap of mean AUCell enrichment of OIC cross-linking signature split by normal or SLE. (D) Violin plot of Tnfsf13b in human macrophage clusters. Expression value is scaled from 0 to 1 across cell clusters. Significance was calculated using Wilcoxon rank sum test with BH posttest applied where ***P < 0.001. Color of the P value indicates which group has a higher value (red = SLE, blue = normal). (E) Microscopy showing BAFF expression (red) in peri-glomerular macrophages (CD206, cyan) in kidneys from SLE patients. Scale bar = 20 μm. (F) CellPhoneDB receptor-ligand interaction analysis between human B cells and human macrophage clusters (NC — nonclassical monocyte-derived macrophages; C – classical monocyte-derived macrophages; TR — tissue resident macrophages) split by normal (N) or SLE (S). Significant interactions (P < 0.05) are highlighted in red. (G) Violin plot of BAFF receptor molecules in human B cells. Expression value is scaled from 0 to 1. Significance was calculated using Wilcoxon rank sum test with BH posttest applied where ***P < 0.001. Color of the P value indicates which group has a higher value (red = SLE, blue = normal).

References

    1. Guilliams M, et al. Dendritic cells, monocytes and macrophages: a unified nomenclature based on ontogeny. Nat Rev Immunol. 2014;14(8):571–578. doi: 10.1038/nri3712. - DOI - PMC - PubMed
    1. Rahman A, Isenberg DA. Systemic lupus erythematosus. N Engl J Med. 2008;358(9):929–939. doi: 10.1056/NEJMra071297. - DOI - PubMed
    1. Clatworthy MR, Smith KG. B cells in glomerulonephritis: focus on lupus nephritis. Semin Immunopathol. 2007;29(4):337–353. doi: 10.1007/s00281-007-0092-1. - DOI - PubMed
    1. Smith KGC, Clatworthy MR. FcgammaRIIB in autoimmunity and infection: evolutionary and therapeutic implications. Nat Rev Immunol. 2010;10(5):328–343. doi: 10.1038/nri2762. - DOI - PMC - PubMed
    1. Floto RA, et al. Loss of function of a lupus-associated FcgammaRIIb polymorphism through exclusion from lipid rafts. Nat Med. 2005;11(10):1056–1058. doi: 10.1038/nm1288. - DOI - PubMed

Publication types