. 2022 Nov 8;7(21):e162968.
doi: 10.1172/jci.insight.162968.

The effect of induction immunosuppression for kidney transplant on the latent HIV reservoir

Affiliations

The effect of induction immunosuppression for kidney transplant on the latent HIV reservoir

Sarah E Benner et al. JCI Insight. .

Abstract

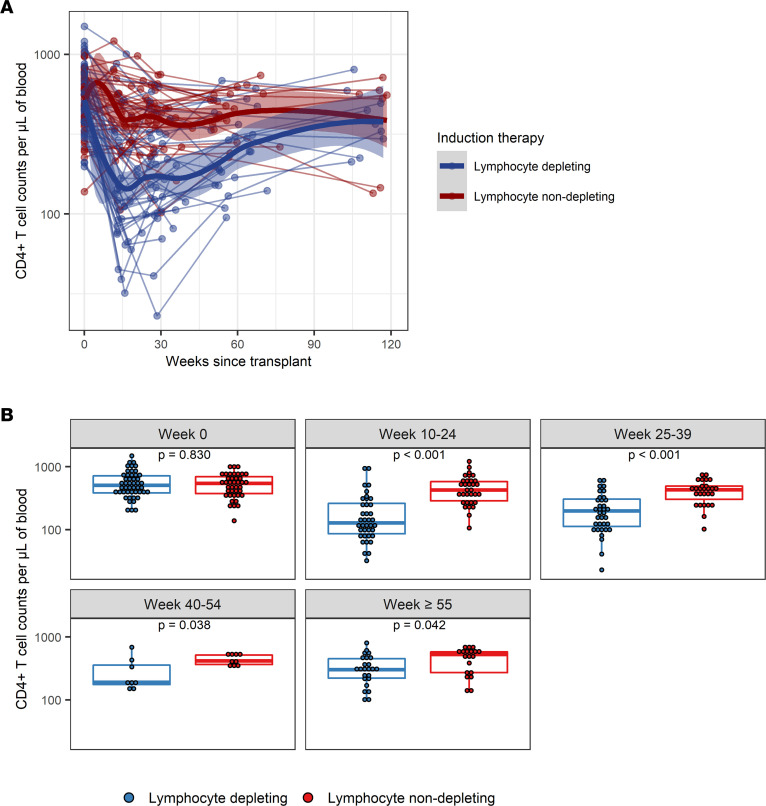
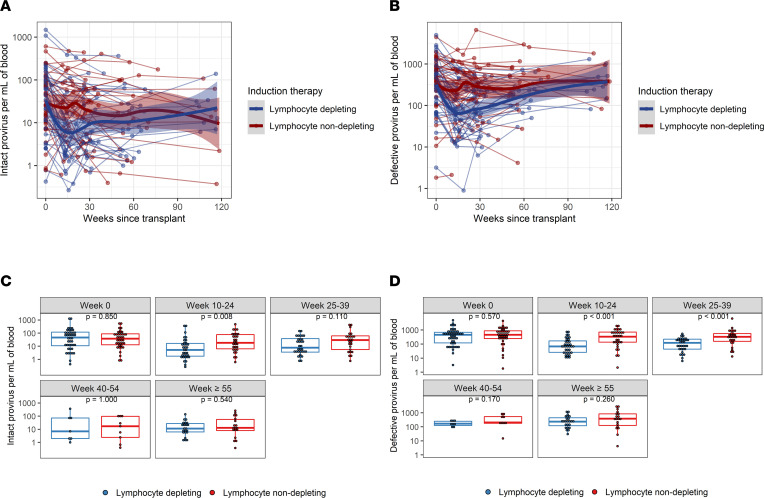
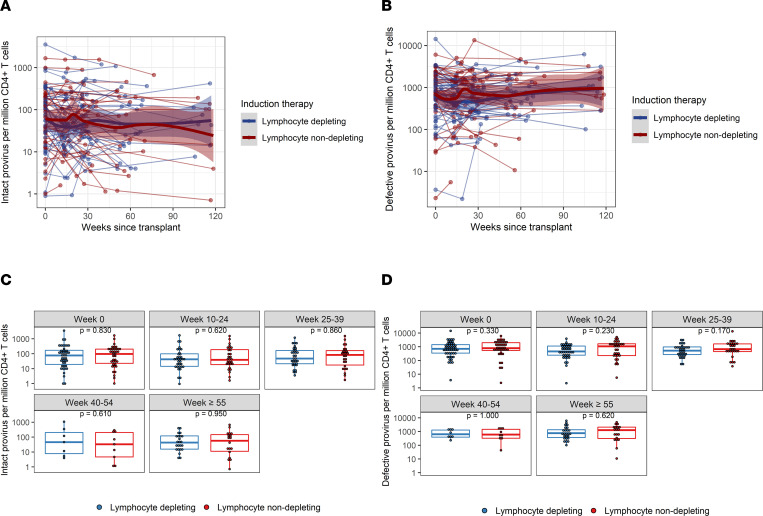
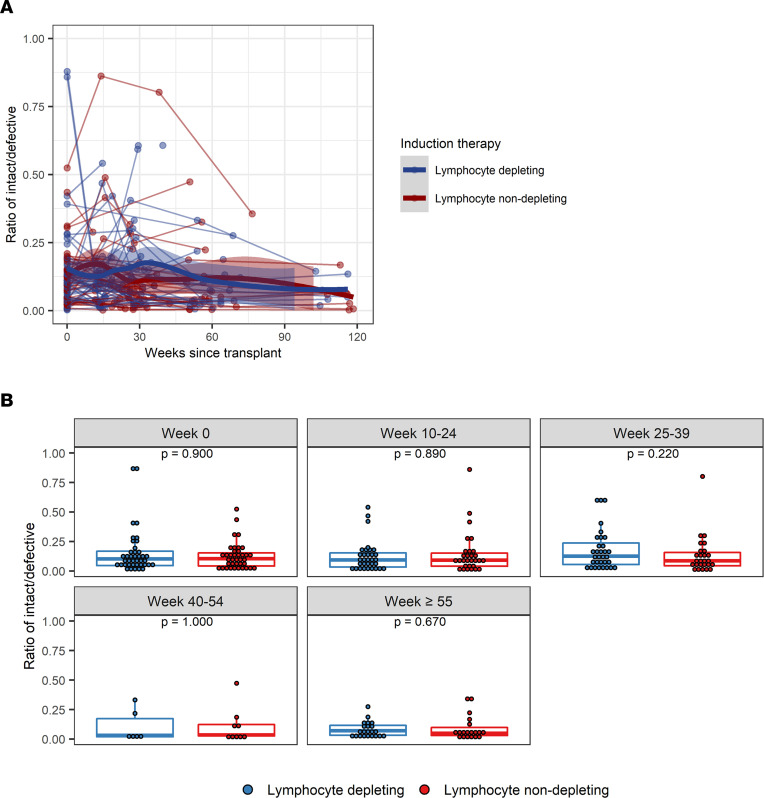
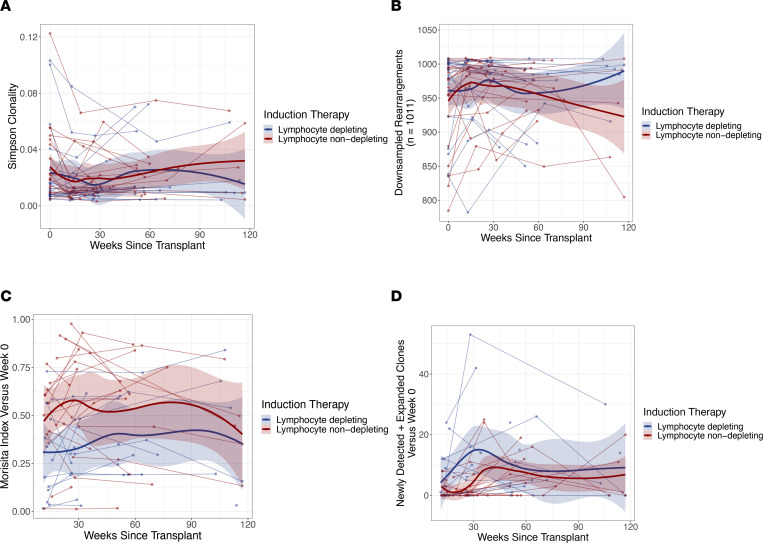
The HIV latent viral reservoir (LVR) remains a major challenge in the effort to find a cure for HIV. There is interest in lymphocyte-depleting agents, used in solid organ and bone marrow transplantation to reduce the LVR. This study evaluated the LVR and T cell receptor repertoire in HIV-infected kidney transplant recipients using intact proviral DNA assay and T cell receptor sequencing in patients receiving lymphocyte-depleting or lymphocyte-nondepleting immunosuppression induction therapy. CD4+ T cells and intact and defective provirus frequencies decreased following lymphocyte-depleting induction therapy but rebounded to near baseline levels within 1 year after induction. In contrast, these biomarkers were relatively stable over time in the lymphocyte-nondepleting group. The lymphocyte-depleting group had early TCRβ repertoire turnover and newly detected and expanded clones compared with the lymphocyte-nondepleting group. No differences were observed in TCRβ clonality and repertoire richness between groups. These findings suggest that, even with significant decreases in the overall size of the circulating LVR, the reservoir can be reconstituted in a relatively short period of time. These results, while from a relatively unique population, suggest that curative strategies aimed at depleting the HIV LVR will need to achieve specific and durable levels of HIV-infected T cell depletion.

Keywords: AIDS/HIV; Organ transplantation; T cells.


Figures

Figure 1
Figure 1. Longitudinal trajectories of CD4+ T cell counts per μL of blood following kidney transplant.
(A) CD4+ T cell counts were measured longitudinally from time since transplant among patients who received lymphocyte-depleting or -nondepleting treatment. Each line represents an individual, and each dot represents a time point. Blue and red lines represent the locally estimated scatter plot smoothing (LOESS) curves for lymphocyte-depleting and -nondepleting groups, respectively. Gray shaded areas represent the 95% CI of the LOESS curves. (B) Comparisons between therapy groups were further analyzed and subdivided into time bins. Each dot represents an individual analyzed within a time bin. Box plots represent the IQR. Medians are represented by horizontal lines in the boxes. The lower and upper whiskers represent 1.5 times the IQR beyond the quartiles. P values were estimated by Wilcoxon’s rank-sum test.
Figure 2
Figure 2. Intact and defective (3′and 5′) proviral frequencies per mL of blood following kidney transplant.
(A) Intact and (B) defective proviruses were measured longitudinally from time since transplant among patients who received lymphocyte-depleting or -nondepleting treatment. Each line represents an individual, and each dot represents a time point. Blue and red lines represent the locally estimated scatter plot smoothing (LOESS) curve for lymphocyte-depleting and -nondepleting groups, respectively. Gray shaded areas represent the 95% CI of the LOESS curves. (C and D) Comparisons between therapy groups were further analyzed and subdivided into time bins. Each dot represents an individual analyzed within a time bin. Box plots represent the IQR. Medians are represented by horizontal lines in the boxes. The lower and upper whiskers represent 1.5 times the IQR beyond the quartiles. P values were estimated by Wilcoxon’s rank-sum test.
Figure 3
Figure 3. Intact and defective (3′ and 5′) provirus frequencies per million CD4+ T cells following kidney transplant.
(A) Intact and (B) defective provirus per million CD4+ T cells were measured longitudinally from time since transplant among patients who received lymphocyte-depleting or -nondepleting treatment. Each line represents an individual, and each dot represents a time point. Blue and red lines represent the locally estimated scatter plot smoothing (LOESS) curve for lymphocyte-depleting and -nondepleting groups, respectively. Gray shaded areas represent the 95% CI of the LOESS curves. (C and D) Comparisons between therapy groups were further analyzed and subdivided into time bins. Each dot represents an individual analyzed within a time bin. Box plots represent the IQR. Medians are represented by horizontal lines in the boxes. The lower and upper whiskers represent 1.5 times the IQR beyond the quartiles. P values were estimated by Wilcoxon’s rank-sum test.
Figure 4
Figure 4. Ratio of intact/defective provirus frequencies following kidney transplant.
(A) Intact-to-defective proviral ratios were measured longitudinally from time since transplant among patients who received lymphocyte-depleting or -nondepleting treatment. Each line represents an individual, and each dot represents a time point. Blue and red lines represent the locally estimated scatter plot smoothing (LOESS) curve for lymphocyte-depleting and -nondepleting groups, respectively. Gray shaded areas represent the 95% CI of the LOESS curves. (B) Ratios were further summarized by time point and compared by therapy group. Blue lines indicate participants who received lymphocyte-depleting therapy, and red lines indicate participates who received nondepleting therapy. Each dot represents an individual analyzed within a time bin. Box plots represent the IQR. Medians are represented by horizontal lines in the boxes. The lower and upper whiskers represent 1.5 times the IQR beyond the quartiles. P values were estimated by Wilcoxon’s rank-sum test.
Figure 5
Figure 5. TCRβ repertoire following induction immunosuppressive therapy.
(A) Repertoire clonality, (B) repertoire richness, (C) repertoire turnover, and (D) newly detected and expanded clones were measured from time since transplant among patients who received lymphocyte-depleting or -nondepleting treatments. Each line represents an individual, and each dot represents a time point. Blue and red lines represent the locally estimated scatter plot smoothing (LOESS) curve for lymphocyte-depleting and -nondepleting groups, respectively. Gray shaded areas represent the 95% CI of the LOESS curves. One patient was an outlier in D and, therefore, was excluded from this analysis.

References

    1. Finzi D, et al. Identification of a reservoir for HIV-1 in patients on highly active antiretroviral therapy. Science. 1997;278(5341):1295–1300. doi: 10.1126/science.278.5341.1295. - DOI - PubMed
    1. Bruner KM, et al. Defective proviruses rapidly accumulate during acute HIV-1 infection. Nat Med. 2016;22(9):1043–1049. doi: 10.1038/nm.4156. - DOI - PMC - PubMed
    1. Siliciano JD, et al. Long-term follow-up studies confirm the stability of the latent reservoir for HIV-1 in resting CD4+ T cells. Nat Med. 2003;9(6):727–728. doi: 10.1038/nm880. - DOI - PubMed
    1. Archin NM, et al. Administration of vorinostat disrupts HIV-1 latency in patients on antiretroviral therapy. Nature. 2012;487(7408):482–485. doi: 10.1038/nature11286. - DOI - PMC - PubMed
    1. Elliott JH, et al. Short-term administration of disulfiram for reversal of latent HIV infection: a phase 2 dose-escalation study. Lancet HIV. 2015;2(12):e520–e529. doi: 10.1016/S2352-3018(15)00226-X. - DOI - PMC - PubMed

Publication types

Substances