. 2023 Jan 25;15(680):eabn7979.
doi: 10.1126/scitranslmed.abn7979. Epub 2023 Jan 25.

Swiss public health measures associated with reduced SARS-CoV-2 transmission using genome data

Affiliations

Swiss public health measures associated with reduced SARS-CoV-2 transmission using genome data

Sarah A Nadeau et al. Sci Transl Med. .

Abstract

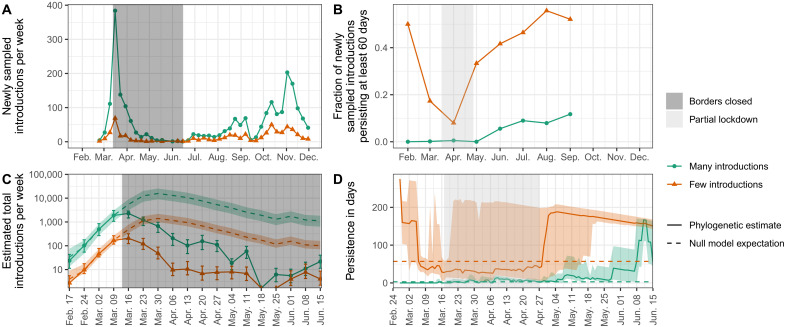
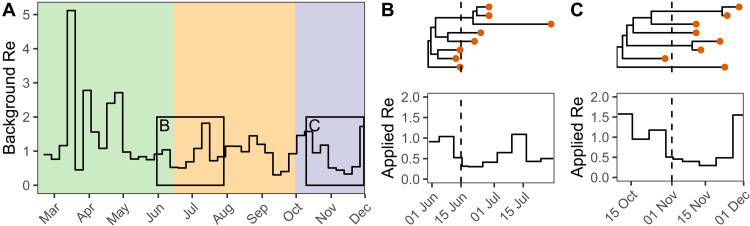
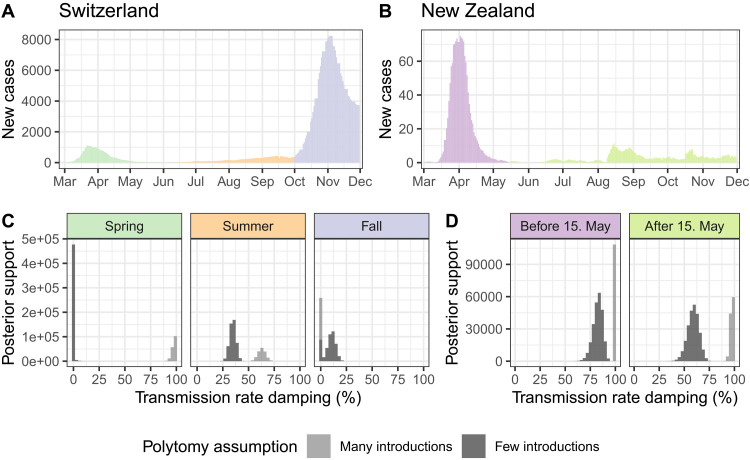
Genome sequences from evolving infectious pathogens allow quantification of case introductions and local transmission dynamics. We sequenced 11,357 severe acute respiratory syndrome coronavirus 2 (SARS-CoV-2) genomes from Switzerland in 2020-the sixth largest effort globally. Using a representative subset of these data, we estimated viral introductions to Switzerland and their persistence over the course of 2020. We contrasted these estimates with simple null models representing the absence of certain public health measures. We show that Switzerland's border closures decoupled case introductions from incidence in neighboring countries. Under a simple model, we estimate an 86 to 98% reduction in introductions during Switzerland's strictest border closures. Furthermore, the Swiss 2020 partial lockdown roughly halved the time for sampled introductions to die out. Last, we quantified local transmission dynamics once introductions into Switzerland occurred using a phylodynamic model. We found that transmission slowed 35 to 63% upon outbreak detection in summer 2020 but not in fall. This finding may indicate successful contact tracing over summer before overburdening in fall. The study highlights the added value of genome sequencing data for understanding transmission dynamics.


Figures

Fig. 1.
Fig. 1.. Genome-based estimates of SARS-CoV-2 introductions into Switzerland and their persistence.
(A) shows the number of newly sampled introductions identified each week and (B) shows the fraction of newly sampled introductions each month that persisted for at least 60 days from the oldest to the most-recent sample. This persistence measure is only defined until September because we only considered sequences obtained until 1 December 2020. Orange and green correspond to estimates generated under the few and many introductions polytomy assumptions, respectively. (C) and (D) focus on dynamics around the Swiss border closure and partial lockdown periods, which are highlighted with shaded rectangles. (C) shows estimated total introductions (solid lines) compared to a null model (dashed lines) where total introductions are a linear function of case numbers in Switzerland’s neighboring countries. The null model is fit to the points prior to the border closure, values after that are projections. Uncertainty bounds for total introductions (error bars) and null model predictions (colored shaded areas) are based on the 95% upper and lower HPD bounds for Re when estimating total introductions. Uncertainty in travel patterns is not shown, see Figure S5. (D) shows the distribution of ongoing persistence for introductions circulating each day (solid lines) compared to a null model (dashed lines) where persistence is constant through time (equal to the median calculated until 15 June). Solid lines are median time to last sampling amongst introductions newly sampled or still ongoing each day. The shaded areas show the interquartile range of this persistence distribution.
Fig. 2.
Fig. 2.. Illustration of how transmission rate damping is modeled.
(A) shows a background Swiss-wide time-varying effective reproductive number Re before any damping. Here we show the median posterior result from the model applied to the many introductions data as an illustration. In each of the colored areas (green = spring, orange = summer, and purple = fall), a different damping factor is proposed. The black boxes in (A) highlight the spread of two real introductions (B) and (C) generated under the many introductions polytomy assumption. The genome data sampled from these introductions are shown as orange dots. The appropriate damping factor on Re is applied to each introduction 2 days after the first genome sample (dashed lines). We used 0.6 for the summer damping factor and 0.9 for fall for this illustration. The likelihood of the genome sequence data at the tips of the phylogenies is calculated given the “applied” Re specific to each introduction (B and C, bottom).
Fig. 3.
Fig. 3.. Phylodynamic estimates for the transmission damping factor in Switzerland and New Zealand compared to case numbers.
Case numbers in (A) Switzerland and (B) New Zealand during 2020 are shown as a 7-day rolling average of daily new confirmed cases (22). (C) and (D) show estimates for if and how much transmission rates were dampened after introductions were sampled during different time periods in (C) Switzerland and (D) New Zealand. The inference was done twice, once conditioning on introductions identified assuming many introductions (light gray) and once assuming few introductions (dark gray). Thus, the difference between estimates in light and dark gray are due to phylogenetic uncertainty. Results shown are from the model with an unbounded sampling proportion prior, results with a bounded sampling proportion prior are similar (Figure S8).

References

    1. Oude Munnink B. B., Worp N., Nieuwenhuijse D. F., Sikkema R. S., Haagmans B., Fouchier R. A. M., Koopmans M., The next phase of SARS-CoV-2 surveillance: Real-time molecular epidemiology. Nat. Med. 27, 1518–1524 (2021). - PubMed
    1. Kraemer M. U. G., Cummings D. A. T., Funk S., Reiner R. C., Faria N. R., Pybus O. G., Cauchemez S., Reconstruction and prediction of viral disease epidemics. Epidemiol. Infect. 147, e34 (2018). - PMC - PubMed
    1. Rockett R. J., Arnott A., Lam C., Sadsad R., Timms V., Gray K.-A., Eden J.-S., Chang S., Gall M., Draper J., Sim E. M., Bachmann N. L., Carter I., Basile K., Byun R., O’Sullivan M. V., Chen S. C.-A., Maddocks S., Sorrell T. C., Dwyer D. E., Holmes E. C., Kok J., Prokopenko M., Sintchenko V., Revealing COVID-19 transmission in Australia by SARS-CoV-2 genome sequencing and agent-based modeling. Nat. Med. 26, 1398–1404 (2020). - PubMed
    1. Douglas J., Mendes F. K., Bouckaert R., Xie D., Jiménez-Silva C. L., Swanepoel C., de Ligt J., Ren X., Storey M., Hadfield J., Simpson C. R., Geoghegan J. L., Drummond A. J., Welch D., Phylodynamics reveals the role of human travel and contact tracing in controlling the first wave of COVID-19 in four island nations. Virus Evol. 7, veab052 (2021). - PMC - PubMed
    1. Mallon P. W. G., Crispie F., Gonzalez G., Tinago W., Garcia Leon A. A., McCabe M., de Barra E., Yousif O., Lambert J. S., Walsh C. J., Kenny J. G., Feeney E., Carr M., Doran P., Cotter P. D., Whole-genome sequencing of SARS-CoV-2 in the Republic of Ireland during waves 1 and 2 of the pandemic. medRxiv , 2021.02.09.21251402 (2021).

Publication types