Relationship of Self-reported and Performance-based Visual Function With Performance-based Measures of Physical Function: The Health ABC Study
- PMID: 36346340
- PMCID: PMC10613017
- DOI: 10.1093/gerona/glac225
Relationship of Self-reported and Performance-based Visual Function With Performance-based Measures of Physical Function: The Health ABC Study
Abstract
Background: To assess the relationship between self-reported and performance-based visual impairment (VI) and lower extremity physical function.
Methods: Cross-sectional analysis of 2 219 Health ABC participants who completed vision testing and the Short Physical Performance Battery (SPPB). Linear regression models used either self-reported (weighted visual function question [VFQ] score) or performance-based (visual acuity [VA], log contrast sensitivity [LCS], Frisby stereoacuity [SA]) to predict SPPB or its components-gait speed, chair stands, or standing balance-with and without covariate adjustment.
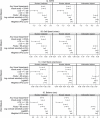
Results: Mean age was 73.5 years (range 69-80); 52.4% were female and 37.4% African American. All VI measures were strongly associated with SPPB in unadjusted and adjusted models (p < .001). A self-reported VFQ score 1 standard deviation lower than the mean (mean 87.8 out of 100) demonstrated a -0.241 (95% confidence interval [CI]: -0.325, -0.156) adjusted difference in SPPB. After controlling for covariates, VA of <20/40 (41%) demonstrated a -0.496 (-0.660, -0.331) lower SPPB score while SA score>85 arcsec (30%) had a -0.449 (-0.627, -0.271) adjusted SPPB score versus those with better visual function. LCS < 1.55 (28.6%) was associated with a -0.759 (-0.938, -0.579) lower and LCS ≤ 1.30 (8%) with a -1.216 (-1.515, -0.918) lower adjusted SPPB score relative to better LCS. In a final multivariable model containing multiple vision measures, LCS remained independently associated with SPPB and all components, while SA remained associated with balance (all p < .05).
Conclusions: Both self-reported and performance-based VI are strongly associated with poor lower extremity physical function. These findings may identify a subgroup of older adults with co-existing visual and physical dysfunction who may benefit from targeted screening and intervention to prevent disability.
Keywords: Balance; Contrast sensitivity; Gait speed; Stereoacuity.
© The Author(s) 2022. Published by Oxford University Press on behalf of The Gerontological Society of America. All rights reserved. For permissions, please e-mail: journals.permissions@oup.com.
Conflict of interest statement
None declared.
Figures

References
-
- GBD 2019 Blindness and Vision Impairment Collaborators; Vision Loss Expert Group of the Global Burden of Disease Study. Causes of blindness and vision impairment in 2020 and trends over 30 years, and prevalence of avoidable blindness in relation to VISION 2020: the Right to Sight: an analysis for the Global Burden of Disease Study. Lancet Glob Health 2021;9(2):e144–ee60. doi: 10.1016/S2214-109X(20)30489-7 - DOI - PMC - PubMed
Publication types
MeSH terms
Grants and funding
LinkOut - more resources
Full Text Sources
Medical

