. 2023 Jan 2;220(1):e20220829.
doi: 10.1084/jem.20220829. Epub 2022 Nov 8.

Deficiency for SAMHD1 activates MDA5 in a cGAS/STING-dependent manner

Affiliations

Deficiency for SAMHD1 activates MDA5 in a cGAS/STING-dependent manner

Tina Schumann et al. J Exp Med. .

Abstract

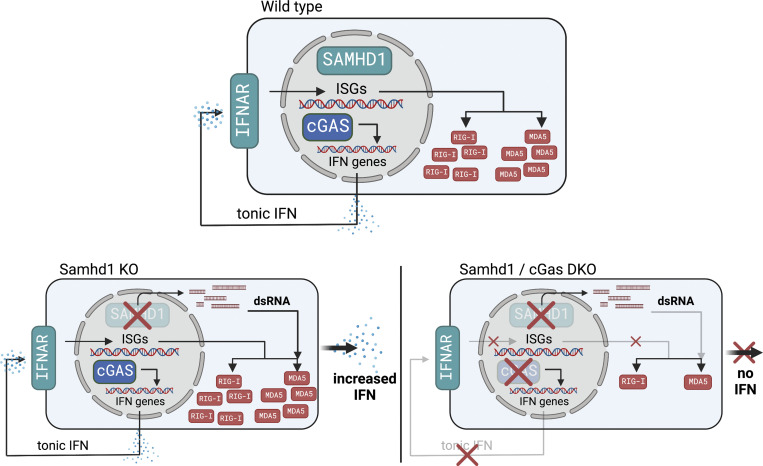
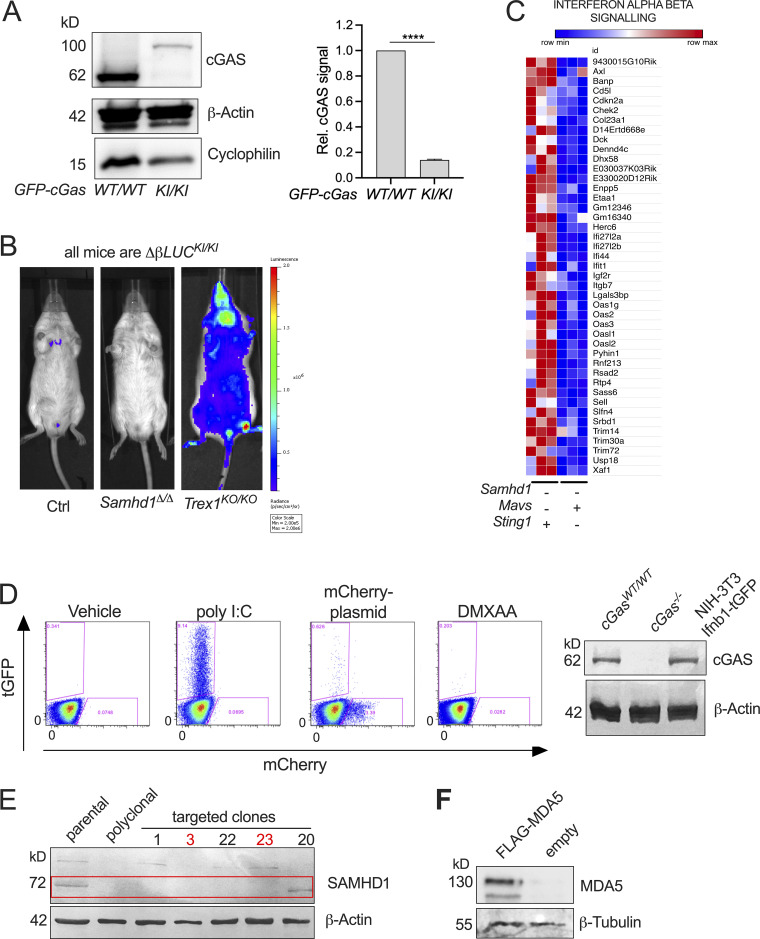
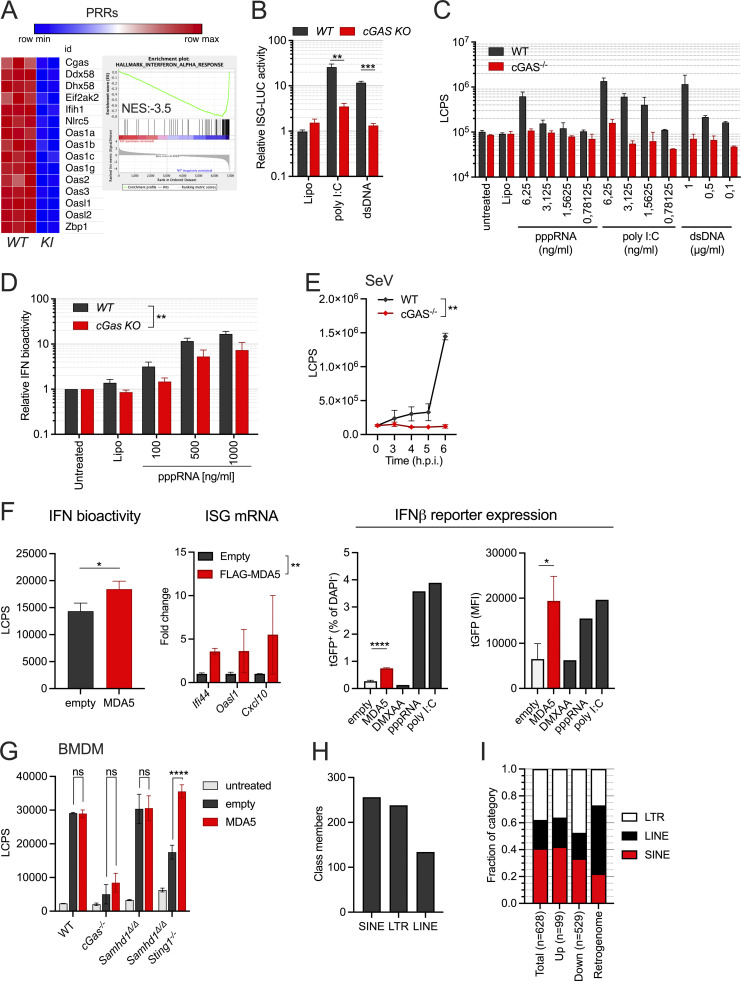
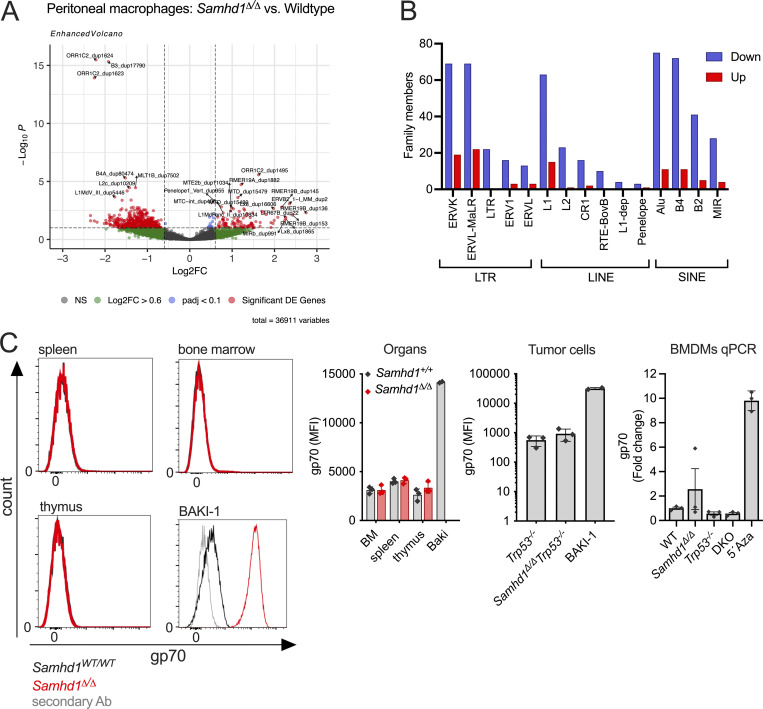
Defects in nucleic acid metabolizing enzymes can lead to spontaneous but selective activation of either cGAS/STING or RIG-like receptor (RLR) signaling, causing type I interferon-driven inflammatory diseases. In these pathophysiological conditions, activation of the DNA sensor cGAS and IFN production are linked to spontaneous DNA damage. Physiological, or tonic, IFN signaling on the other hand is essential to functionally prime nucleic acid sensing pathways. Here, we show that low-level chronic DNA damage in mice lacking the Aicardi-Goutières syndrome gene SAMHD1 reduced tumor-free survival when crossed to a p53-deficient, but not to a DNA mismatch repair-deficient background. Increased DNA damage did not result in higher levels of type I interferon. Instead, we found that the chronic interferon response in SAMHD1-deficient mice was driven by the MDA5/MAVS pathway but required functional priming through the cGAS/STING pathway. Our work positions cGAS/STING upstream of tonic IFN signaling in Samhd1-deficient mice and highlights an important role of the pathway in physiological and pathophysiological innate immune priming.


Conflict of interest statement

Disclosures: R. Behrendt reported grants from Hoffmann-La Roche, ISD Immunotech, and IFM Therapeutics outside the submitted work. No other disclosures were reported.

Figures

None
Graphical abstract
Figure 1.
Figure 1.
Low-level chronic DNA damage in SAMHD1-deficient mice. (A) GSEA against the Reactome gene set collection (MSigDB) showing that exclusively gene sets of immune pathways (blue) and DNA replication (red) are enriched in Samhd1Δ/Δ vs. Samhd1+/+ peritoneal macrophages. NES, normalized enrichment score. (B) CTNF of the γH2AX signal in pre-senescent primary MEFs and CD11b+F4/80HI peritoneal macrophages of the indicated genotypes (Student’s t test) and representative immunofluorescence pictures. Scale bars = 10 µM; 10 and 8 Gy = positive controls. (C) Change in micronucleated reticulocytes (MN-Ret) before (−) and 48 h after (+) whole body γ-irradiation with a dose of 2 Gy in Samhd1+/+ (n = 8) and Samhd1Δ/Δ (n = 5) mice. Fold change compared with the mean of Samhd1+/+ before irradiation is shown (one-way ANOVA followed by Tukey’s multiple comparison test). (D) Relative change in MN-NCEs from peripheral blood of mice with the indicated genotypes. Fold change was calculated for each genetic background between Samhd1+/+ (+) and Samhd1Δ/Δ (Δ). For Mavs and Sting1: + = WT/WT, − = KO/KO, n ≥ 4 for each group (Student’s t test). * = P < 0.05, *** = P < 0.001, **** = P < 0.0001.
Figure 2.
Figure 2.
SAMHD1 prevents spontaneous DNA DSBs and accelerated transformation in p53-deficient mice. (A) Tumor-free survival of Samhd1+/+Trp53−/− (n = 15) and Samhd1Δ/ΔTrp53−/− (n = 12) mice (log-rank test). (B and C) + = WT/WT, − = KO/KO, Δ = Δ/Δ. (B) Relative thymus weight of mice with the indicated genotypes at 12 wk of age, n ≥ 5 per group (one-way ANOVA followed by Sidak’s multiple comparison test). (C) Thymi of 12-wk-old mice with the indicated genotypes were examined for lymphoma formation by a trained histopathologist. Numbers of analyzed thymi in each group are shown and categorized according to the disease state. (D) Representative sections of a normal Samhd1Δ/ΔTrp53+/+ (upper) and a Samhd1Δ/ΔTrp53−/− lymphoma-bearing thymus. Sections were stained with H&E. Scale bar = 100 µm. Insets were created with digital zooming. (E) Representative multicolor immunohistochemistry staining for T cell lineage markers of thymic sections from mice with the indicated genotypes. Scale bar = 100 µm. (F) Cell counts of CD4CD8CD44+CD25 DN1 immature T cells over time in the thymus of mice with the indicated genotypes. Complete dataset of T cell development in Fig. S2, n ≥ 3 for each group and time point (two-way ANOVA followed by Tukey’s multiple comparison test). (G) Survival of Samhd1Δ/ΔTrp53−/− (n = 3) and of Samhd1+/+Trp53−/− (n = 3) immortalized thymic fibroblasts after treatment for 48 h with dG at the indicated concentrations. Representative of two independent experiments is shown (two-way ANOVA). (H) Tumor-free survival of Samhd1Δ/ΔPms2−/− (n = 51) and of Samhd1+/+Pms2−/− mice (n = 20). (I) Frequency of MN-NCEs in peripheral blood of Samhd1Δ/ΔTrp53−/− (n = 9) and of Samhd1+/+Trp53−/− (n = 9; Student’s t test). (J) CTNF of the γH2AX signal in presenescent primary MEFs from Samhd1Δ/ΔTrp53−/− and Samhd1+/+Trp53−/− mice. Representative result of two independent experiments is shown (Student’s t test). (K) Telomer integrity was quantified by FISH in 20 metaphases of immortalized thymic fibroblasts from Samhd1Δ/ΔTrp53−/− and from Samhd1+/+Trp53−/− mice (Student’s t test). Scale bar = 5 µm. *** = P < 0.001, **** = P < 0.0001.
Figure S1.
Figure S1.
Aberrant T cell development in Samhd1Δ/ΔTrp53−/− and in Samhd1+/+Trp53−/− mice. Related to Fig. 2. (A) Thymus parameters recorded by flow cytometry. Cells were gated based on scatter (exclude debris) and DAPI for living cells, before gating on the respective markers. DP = CD4+CD8+, DN = CD4CD8, DN1 = CD4CD8CD44+CD25 (shown in Fig. 2 F), DN2 = CD4CD8CD44+CD25+, DN3 = CD4CD8CD44CD25+, DN4 = CD4CD8CD44CD25 (two-way ANOVA followed by Tukey’s multiple comparison test). (B) DNA was extracted from total thymus of mice with the indicated genotypes. TCRβ loci were amplified by PCR using a combination of 22 primers binding in a V segment combined with one primer binding in J1.7. Similar results were obtained with primer J2.7 (not shown). Strategy according to Martins et al. (2014). * = P < 0.05, ** = P < 0.001, *** = P < 0.001, **** = P < 0.0001. Source data are available for this figure: SourceData FS1.
Figure S2.
Figure S2.
KU-55933 reduces ATM phosphorylation in Samhd1Δ/Δ MEFs after irradiation. Related to Fig. 3. Samhd1Δ/Δ MEFs were incubated with 10 µM KU-55933 or DMSO for 1 h and then irradiated with a dose of 4 Gy or left untreated. 1 h after irradiation cells were collected in RIPA buffer and subjected to capillary western analysis using a WES system (Protein Simple). (A) Virtual blot of the signals obtained in WES. The antibody produced an unspecific signal at 115 kD that was used as a loading control. (B) Quantification of the signal area for the pATM signal at 300 kD. Source data are available for this figure: SourceData FS2.
Figure 3.
Figure 3.
Differential roles of ATM, p53, and STING in controlling tumor growth and ISG transcription in Samhd1Δ/Δ mice. (A) MEFs (n = 3 per group) and BMDMs (n = 3 per group, three independent measurements, pooled data shown) from Samhd1Δ/Δ and control mice were incubated with DMSO or the ATM inhibitor KU-55933 for 48 h. IFN bioactivity in the supernatant was quantified using LL171 ISG-LUC reporter cells. LCPS, light counts per second. Two-way ANOVA followed by Tukey’s multiple comparison test. (B) Frequency of DAPISca-1+CD3+ T cells (left) and DAPISca-1+CD19+ B cells (right) in peripheral blood of mice with the indicated genotypes (one-way ANOVA followed by Tukey’s multiple comparison test). (C–E) Relative transcript levels of ISGs in peripheral blood (C and E) and BMDMs (D) of mice with the indicated genotypes. Fold change compared to the mean of Samhd1+/+Trp53+/+ (C and D) or Samhd1+/+Pms2+/+ (E) are shown, n = 3 for each group in each experiment (multiple t tests were performed). (F) Tumor-free survival of Samhd1Δ/ΔTrp53−/− mice on STING-deficient (Sting1GT/GT) and STING-proficient (Sting1+/+) genetic backgrounds (log-rank test). * = P < 0.05, ** = P < 0.01, *** = P < 0.001,**** = P < 0.0001.
Figure S3.
Figure S3.
MDA5 drives spontaneous IFN production in Samhd1Δ/Δ mice. Related to Fig. 4. (A) Samhd1+/+ and Samhd1Δ/Δ mice were treated i.p. with 10 mg/kg/d H-151 or vehicle for 14 d. Transcript levels of the indicated ISGs were determined in the spleen. Fold change compared with the WT-vehicle group is shown, n = 4 in each group (two-way ANOVA followed by Tukey’s multiple comparison test). (B) Post-replicative senescence Samhd1Δ/Δ and Samhd1+/+ MEFs were transduced with empty lentivirus or a lentivirus, which expresses the cDNA of murine Samhd1 isoform1 as well as EYFP. Transduced cells were enriched by FACS for EYFP and transcript levels of the indicated ISGs were determined by qRT-PCR. Data of two independent measurements are displayed as fold change compared with the mean of Samhd1+/+ MEFs transduced with empty lentivirus (two-way ANOVA followed by Tukey’s multiple comparison test). * = P < 0.05, ** = P < 0.01,**** = P < 0.0001. (C) Relative transcript levels of the indicated ISGs measured by qRT-PCR in post-replicative senescence Samhd1Δ/Δ MEFs with additional CRISPR-mediated inactivation of the genes cGas (n = 4), Ifih1 (n = 3), and Ddx58 (n = 2) after lipofection with 1 µg/ml plasmid DNA (dsDNA), 100 ng/ml poly I:C, 100 ng/ml 3´-triphosphate RNA (pppRNA), or incubation with 10 μg/ml 5,6-dimethylxanthenone-4-acetic acid (DMXAA) for 16 h. Fold change compared to Lipo-treated Samhd1+/+ MEFs is shown. (D) Normalized read counts for the indicated ISG transcripts from the experiment shown in Fig. 4 E.
Figure 4.
Figure 4.
MDA5 drives spontaneous IFN production in Samhd1Δ/Δ mice. For the whole figure − = homozygous null, + = homozygous WT. (A) Enrichment of reactome gene sets (MSigDB) in the transcriptome of peritoneal macrophages from mutant mice compared with littermate WT controls of Samhd1Δ/Δ mice. (B) Normalized read counts for the indicated ISG transcripts from the analysis shown in A. (C) Relative transcript levels of the indicated ISGs measured by qRT-PCR in post-replicative senescence Samhd1Δ/Δ MEFs with additional CRISPR-mediated inactivation of the genes cGas (n = 4), Ifih1 (n = 3), and Ddx58 (n = 2). Data from two independent experiments were pooled and displayed as fold change compared to the mean of Samhd1+/+ MEFs (multiple t tests, summary of results is shown with P < 0.05 as lowest significance level). (D) Differentially expressed (padj<0.1) ISG in transcriptomes of peritoneal macrophages from mutant mice compared with littermate WT controls of Samhd1Δ/Δ mice. (E) Enrichment of reactome gene sets (MSigDB) of another independently generated transcriptome using peritoneal macrophages from Samhd1Δ/ΔIfih1+/+, Samhd1+/+Ifih1−/−, and Samhd1Δ/ΔIfih1−/− compared with littermate Samhd1+/+Ifih1+/+control mice. NES, normalized enrichment score.
Figure S4.
Figure S4.
Spontaneous activation of MDA5 in Samhd1Δ/Δ mice depends on cGAS/STING signaling. Related to Fig. 5. (A) Representative Western blot for cGAS in GFP-cGasKI/KI and GFP-cGasWT/WT control mice (left). Data from two independent experiments for densitometric quantification of cGAS signal relative to the signal for β-actin (right, Student’s t test). cGAS = 62 kD, GFP-cGAS around 92 kD. (B) Spontaneous in vivo Ifnb1-luciferase signal in Samhd1+/Δ (Ctrl), Samhd1Δ/Δ, and Trex1KO/KO mice. All mice were homozygous for the luciferase knock in (ΔβLUCKI/KI). (C) Normalized read counts of genes belonging to the Reactome Interferon_Alpha_Beta_Signalling gene set showing lower expression of ISGs in Samhd1Δ/ΔSting1GT/GT vs. between Samhd1Δ/ΔMavs−/− peritoneal macrophages. The heatmap was generated with data presented in Fig. 4, A and B. (D) Left: Transfection of NIH-3T3-Ifnb1-tGFP reporter cells with 1 µg/ml poly I:C, 3 µg/ml mCherry-expression plasmid, or incubation with 20 μg/ml DMXAA. Frequency of tGFP+ cells was determined by flow cytometry 16 h later. One of three experiments with identical results is shown. Note the lack of a response to plasmid DNA and DMXAA consistent with a lack of STING in these cells. The amounts of poly I:C used here are 10- to 1,000-fold above the amounts used in Fig. 5, B and C. Right: Western blot confirming cGAS protein in Ifnb1-tGFP reporter cells. (E) Confirmation of SAMHD1 KO (deletion of exon 4, not shown) in Ifnb1-tGFP. Numbers above designate single clones. Clone 20 shows truncation and was not used. Studies in the manuscript show results from clone 3 and were confirmed in clone 23; both are marked in red. (F) Western blot 72 h after transfection with of Ifnb1-tGFP with 5 μg/ml of either empty plasmid or FLAG-MDA5 expression plasmid. Detection was done using FLAG-antibody. **** = P < 0.0001. Source data are available for this figure: SourceData FS4.
Figure 5.
Figure 5.
Spontaneous activation of MDA5 in Samhd1Δ/Δ mice depends on cGAS/STING signaling. (A) Normalized read counts for transcripts of PRRs in BMDMs from Samhd1Δ/ΔGFP-cGasKI/KI (n = 2) vs. Samhd1+/+ (n = 3) control mice and the enrichment plot for the gene set INTERFERON_ALPHA_RESPONSE of the Hallmark gene set (MSigDB). (B) Relative ISG-luciferase reporter activity in cGAS-competent (WT) and cGAS-deficient (cGas KO) LL171 cells 16 h after lipofection with 100 ng/ml poly I:C and 1 µg/ml plasmid DNA (3 kb). Luciferase activity was normalized to the mean of Lipo-treated WT LL171 cells (Student’s t test). (C) cGAS−/− and control MEFs were lipofected with the indicated concentrations of ligands for pppRNA, high molecular weight poly I:C and plasmid DNA (dsDNA) for 6 h and washed. 18 h later, IFN bioactivity was quantified in the cell culture supernatant using LL171 ISG-LUC reporter cells. LCPS, light counts per second. (D) Similar assay as in C but with BMDMs isolated from cGas+/+ (WT) and cGas−/− (cGas KO) mice lipofected the indicated amounts of pppRNA for 6 h. Two-way ANOVA. (E) cGAS−/− and control MEFs were infected with Sendai Virus (MOI = 1.5) for 2 h and washed. At the indicated time points IFN bioactivity in the supernatant was determined as in C. (F) SAMHD1 and STING-deficient Ifnb1-tGFP reporter cells were transfected with an empty plasmid or a plasmid expressing Flag-tagged murine MDA5 for 16 h before washing. After 72 h post washing IFN bioactivity as in C, ISG transcription by qRT-PCR and Ifnb1-tGFP reporter gene expression by FACS were quantified (T test). (G) Similar experiment as in H but in BMDMs from mice with the indicated genotypes. IFN bioactivity was quantified as described in C 72 h after washing the cells (two-way ANOVA). (H) Numbers of significantly differentially expressed retroelements in transcriptomes of Samhd1Δ/Δ vs. control peritoneal macrophages. Numbers for each class as annotated in TEtranscript are shown. (I) Relative abundance of the classes shown in H within each of the categories (total, upregulated, downregulated, retrogenome). Retrogenome refers to the genomic frequency of retroelements in the respective class among all mouse retroelements. LINE = 19.2%, SINE = 8.2%, LTR = 10%, all together = 37.4% of the mouse genome (Kassiotis and Stoye, 2016); relative abundance among genomic retroelement sequences for LINE = 51.4%; SINE = 21.9%, LTR = 26.7%. * = P < 0.05, ** = P < 0.01, *** = P < 0.001, **** = P < 0.0001.
Figure S5.
Figure S5.
Analysis of endogenous retrolements (ERE) in Samhd1Δ/Δ mice. Related to Fig. 5. (A) Volcano plot of ERE differentially expressed in peritoneal macrophages of Samhd1Δ/Δ vs. control peritoneal macrophages as identified by a TEtranscript reference (see main text). (B) Numbers of differentially expressed ERE for each family in the three ERE classes (all red dots from A). Down (blue) and Up (red) indicate the expression level in Samhd1Δ/Δ vs. control cells. B1 elements were designated as “Alu” in the mouse genome TEtranscript reference file, although the term was originally reserved for primate SINEs of this family. (C) Single-cell suspensions of the indicated organs from Samhd1Δ/Δ (red, n = 3) vs. control mice (black, n = 3) were stained for the surface expression of MLV gp70 and analyzed by flow cytometry. Histogram overlays are shown for DAPI living cells (left) and next to it the quantification. Bar graph in the middle shows the same analysis on immortalized thymic fibroblasts from tumor bearing mice with the indicated genotypes (n = 3 per genotype). BAKI-1 cells express high levels of the recombinant MLV from the EMV2 locus were used as a positive control (Yu et al., 2012). Graph on the right shows qPCR for MLV gp70 in BMDMs from mice of the indicated genotypes (n = 3). BMDMs were differentiated for 7 d in RPMI with 30% L929 supernatant and then seeded for 72 h in RPMI +15% L929. Samhd1Δ/Δ BMDMs cultured in the presence of 500 nM 5-Azacytidin were used as a positive control. Fold change in gp70 mRNA abundance is shown in comparison to WT. MFI = mean fluorecence intensity.

References

    1. Ablasser, A., and Hur S.. 2020. Regulation of cGAS- and RLR-mediated immunity to nucleic acids. Nat. Immunol. 21:17–29. 10.1038/s41590-019-0556-1 - DOI - PubMed
    1. Aditi, S.M., Downing S.M., Schreiner P.A., Kwak Y.D., Li Y., Shaw T.I., Russell H.R., and McKinnon P.J.. 2021. Genome instability independent of type I interferon signaling drives neuropathology caused by impaired ribonucleotide excision repair. Neuron. 109:3962–3979.e6. 10.1016/j.neuron.2021.09.040 - DOI - PMC - PubMed
    1. Ahmad, S., Mu X., Yang F., Greenwald E., Park J.W., Jacob E., Zhang C.-Z., and Hur S.. 2018. Breaching self-tolerance to Alu duplex RNA underlies MDA5-mediated inflammation. Cell. 172:797–810.e13. 10.1016/j.cell.2017.12.016 - DOI - PMC - PubMed
    1. Andreeva, L., Hiller B., Kostrewa D., Lässig C., de Oliveira Mann C.C., Jan Drexler D., Maiser A., Gaidt M., Leonhardt H., Hornung V., and Hopfner K.-P.. 2017. cGAS senses long and HMGB/TFAM-bound U-turn DNA by forming protein-DNA ladders. Nature. 549:394–398. 10.1038/nature23890 - DOI - PubMed
    1. Antonucci, J.M., St Gelais C., de Silva S., Yount J.S., Tang C., Ji X., Shepard C., Xiong Y., Kim B., and Wu L.. 2016. SAMHD1-mediated HIV-1 restriction in cells does not involve ribonuclease activity. Nat. Med. 22:1072–1074. 10.1038/nm.4163 - DOI - PMC - PubMed

Publication types

MeSH terms