. 2023 Jul;137(4):1215-1234.
doi: 10.1007/s00414-022-02906-x. Epub 2022 Nov 8.

Whole exome sequencing of FFPE samples-expanding the horizon of forensic molecular autopsies

Affiliations

Whole exome sequencing of FFPE samples-expanding the horizon of forensic molecular autopsies

Emma Adolfsson et al. Int J Legal Med. 2023 Jul.

Abstract

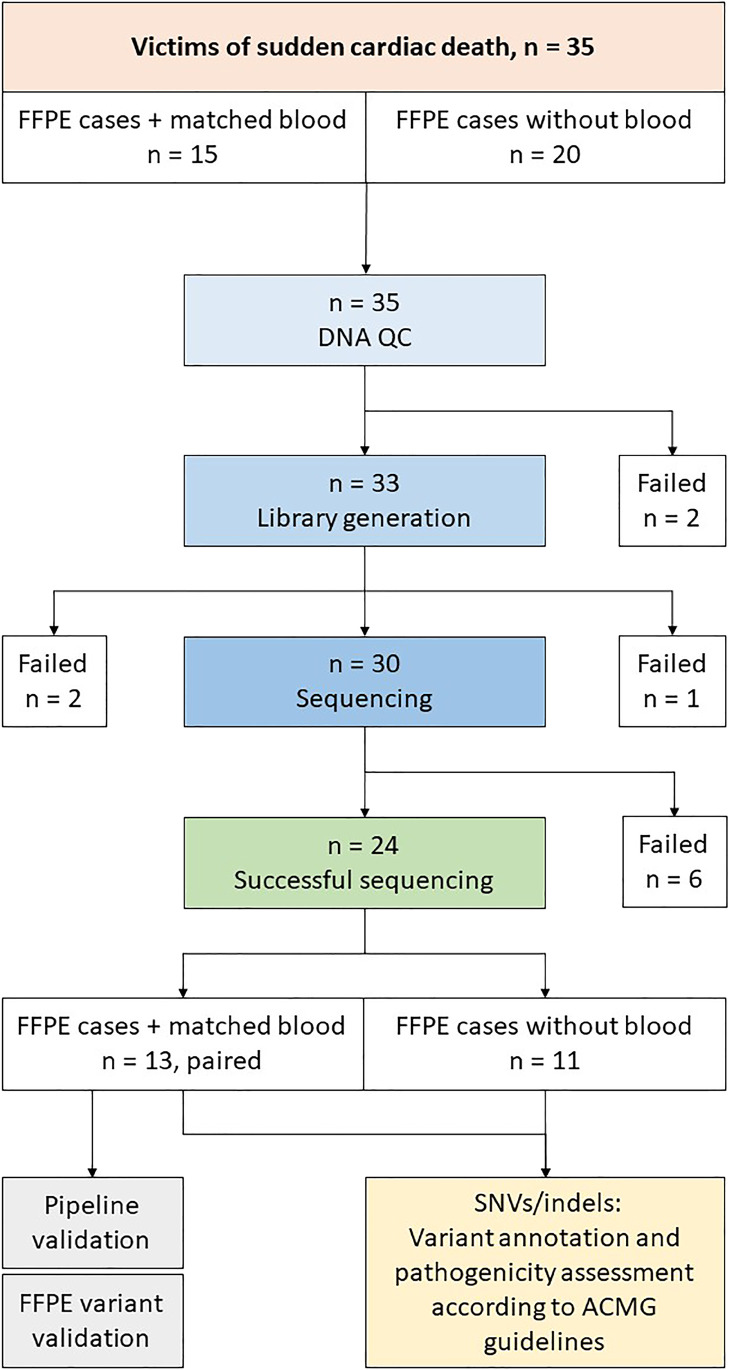
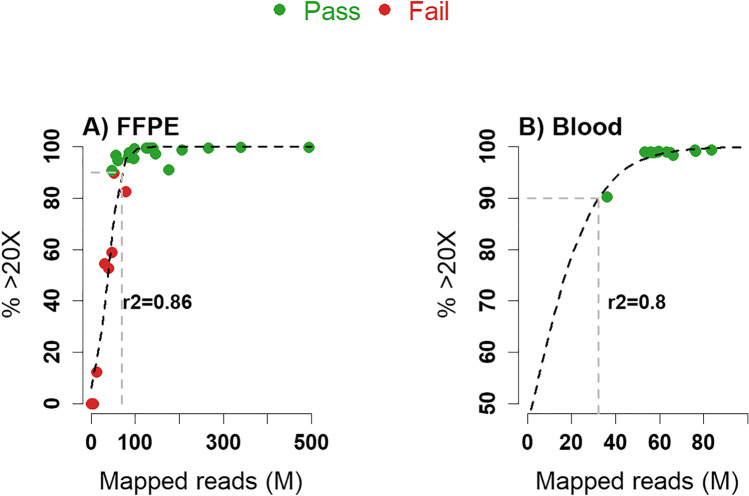
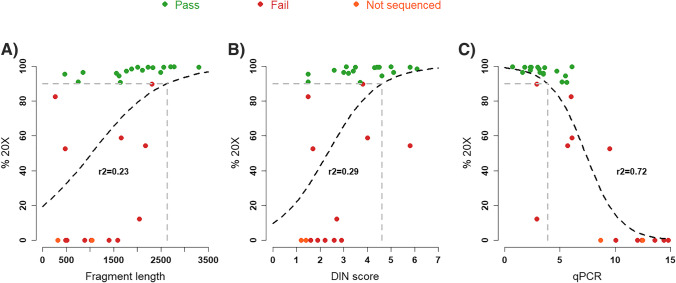
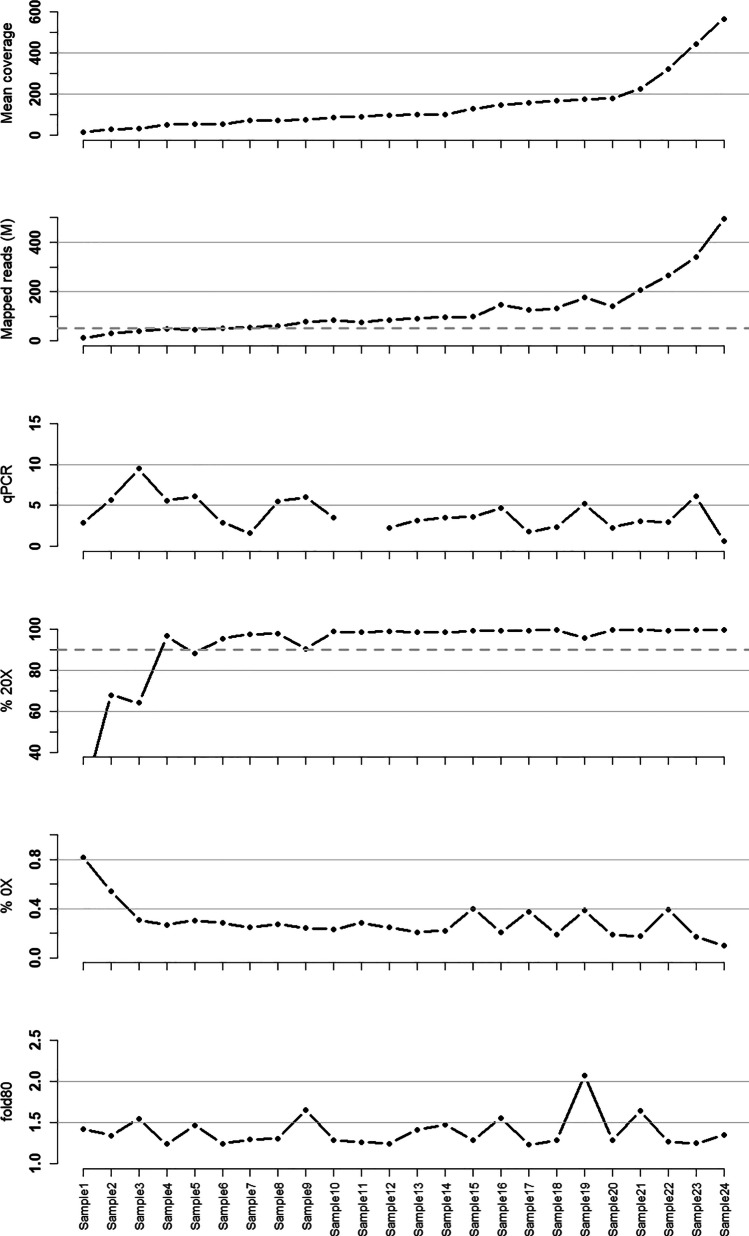
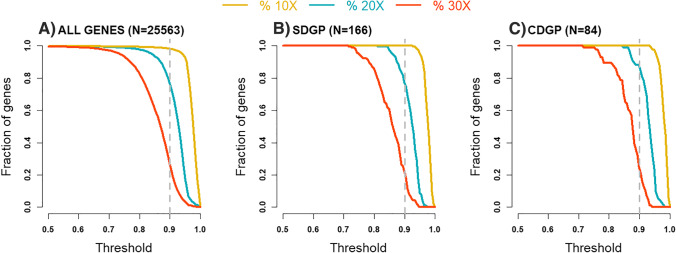
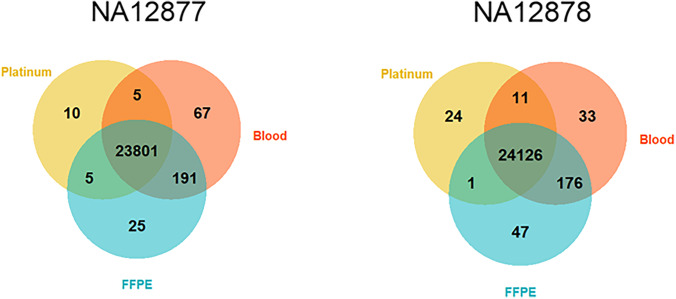
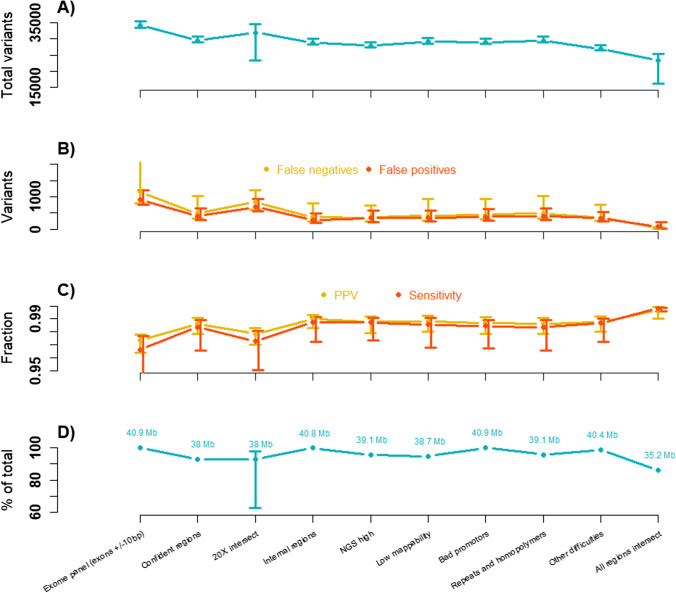
Forensic molecular autopsies have emerged as a tool for medical examiners to establish the cause of death. It is particularly useful in sudden unexplained deaths where the cause of death cannot be determined with a regular medical autopsy. We provide the first study of exome data from formalin-fixed paraffin-embedded samples (FFPE) paired with data from high-quality blood samples in forensic applications. The approach allows exploration of the potential to use FFPE samples for molecular autopsies and identify variants in extensive exome data. We leverage the high uniformity of the hybridization capture approach provided by Twist Bioscience to target the complete exome and sequence the libraries on a NextSeq 550. Our findings suggest that exome sequencing is feasible for 24 out of a total of 35 included FFPE samples. When successful, the coverage across the exome is comparatively high (> 90% covered to 20X) and uniform (fold80 below 1.5). Detailed variant comparisons for matched FFPE and blood samples show high concordance with few false variants (positive predictive value of 0.98 and a sensitivity of 0.97) with no distinct FFPE artefacts. Ultimately, we apply carefully constructed forensic gene panels in a stepwise manner to find genetic variants associated with the clinical phenotype and with relevance to the sudden unexplained death.

Keywords: Arrhythmia; Cardiomyopathy; FFPE; Molecular autopsy; SCD; WES.


Conflict of interest statement

The authors declare no competing interests.

Figures

Fig. 1
Fig. 1
Flowchart illustrating the path from sample extraction to variant calling. In total, WES FFPE was attempted for 35 cases, 15 of these had matching blood samples and are considered validation forensic samples. The other samples were consequentially received clinical requests for genetic testing where only FFPE material remained. After DNA quality control, 33 cases remained. Library generation was therefore initiated for 33 cases. Libraries of sufficient quality were generated from 30 cases, and three cases failed library generation despite several attempts. Whole exome sequencing was performed for the 30 cases, in batches of eight, and sequencing was successful for 24 of these, 13 of these were the validation forensic samples. These samples were used for pipeline validation and variant comparisons. All 24 successfully sequenced samples were analysed with variant annotation and pathogenicity assessment according to ACMG guidelines [21]
Fig. 2
Fig. 2
Correlation between the number of mapped reads in millions (x-axis) and the percentage of targets covered to 20X. A FFPE samples and B blood samples. The r2 value is the goodness of fit for a logistic regression using a binomial distribution, also plotted in the graph as a dashed black line. Dashed grey lines illustrate the intersection between the amount of mapped reads and the point where 90% of the targets are covered to at least 20X. Note the difference in scale. Abbreviation: FFPE = formalin-fixed paraffin embedded
Fig. 3
Fig. 3
Correlation between three different quality metrics and the percentage of targets covered to 20X. A Average fragment length, B DIN score, and C qPCR value. The r2 value is the goodness of fit for a logistic regression with a quasibinomial fit in R, also plotted in the graph as a dashed black line. Dashed grey lines illustrate the intersection between the measures quality metric and the point where 90% of the targets are covered to at least 20X
Fig. 4
Fig. 4
Sequencing metrics across the 24 FFPE samples with successful sequencing. From top-to-bottom, the qPCR value, mean coverage across all target bases, fraction of target bases covered to at least 20X, fraction of target bases covered to 0X and fold80 illustrating the uniformity of the data. Samples are sorted based on median coverage
Fig. 5
Fig. 5
Fraction of genes covered to at least 10X, 20X, and 30X respectively. To consider a gene covered we use a sliding threshold (x-axis), where 0.5 indicates that at least 50% of the gene is covered to at least the specific coverage. A All genes are included from the exome (n = 255,563); B SDGP, Sudden Death Gene Panel, n = 166; and C CDGP, Cardio Diagnostic Gene Panel, n = 84. The dotted line corresponds to 90% of the gene covered
Fig. 6
Fig. 6
Venn diagrams illustrating a variant comparison between platinum genomes and the Coriell samples analysed in this study. The Coriell samples are sequenced twice, once using the protocol for high-quality blood samples and once with the protocol used in this study for FFPE samples. Numbers illustrate unique variants for each sample type as well as the overlap, where the area is not proportional to the number of variants in each set. FFPE formalin-fixed paraffin-embedded
Fig. 7
Fig. 7
Summary of variant comparisons between matched FFPE and blood samples (n = 13) using different stratification files (x-axis). The exact contents of the regions on the x-axis are detailed in the main text. From top to bottom: A Total variants in each blood sample, B False positive and negative variants for each FFPE sample, C Positive predictive value (PPV) and sensitivity for each FFPE sample, D The size of each region (intersect with the target BED file). For AC, the illustration contains the mean and the max/min for each region across the FFPE samples, and in D, the 20X intersect regions illustrate the mean and max/min for the FFPE samples

Similar articles

Cited by

References

    1. Zipes DP, Wellens HJ. Sudden cardiac death. Circulation. 1998;98(21):2334–51. doi: 10.1161/01.cir.98.21.2334. - DOI - PubMed
    1. Stiles MK, Wilde AAM, Abrams DJ, Ackerman MJ, Albert CM, Behr ER, et al. 2020 APHRS/HRS expert consensus statement on the investigation of decedents with sudden unexplained death and patients with sudden cardiac arrest, and of their families. Heart Rhythm. 2021;18(1):e1–e50. doi: 10.1016/j.hrthm.2020.10.010. - DOI - PMC - PubMed
    1. Bagnall RD, Singer ES, Tfelt-Hansen J. Sudden Cardiac Death in the Young. Heart Lung Circ. 2020;29(4):498–504. doi: 10.1016/j.hlc.2019.11.007. - DOI - PubMed
    1. Wong CX, Brown A, Lau DH, Chugh SS, Albert CM, Kalman JM, et al. Epidemiology of sudden cardiac death: global and regional perspectives. Heart Lung Circ. 2019;28(1):6–14. doi: 10.1016/j.hlc.2018.08.026. - DOI - PubMed
    1. Kumar A, Avishay DM, Jones CR, Shaikh JD, Kaur R, Aljadah M, et al. Sudden cardiac death: epidemiology, pathogenesis and management. Rev Cardiovasc Med. 2021;22(1):147–58. doi: 10.31083/j.rcm.2021.01.207. - DOI - PubMed