

Evaluation of Sleep Habits and Disturbances Among US Adults, 2017-2020
- PMID: 36346632
- PMCID: PMC9644264
- DOI: 10.1001/jamanetworkopen.2022.40788
Evaluation of Sleep Habits and Disturbances Among US Adults, 2017-2020
Abstract
Importance: Unhealthy sleep behaviors and sleep disturbances are associated with higher risk of multiple diseases and mortality. The current profiles of sleep habits and disturbances, particularly the differences between workdays and free days, are unknown in the contemporary US.
Objective: To comprehensively evaluate sleep habits on workdays and free days and the prevalence of sleep disturbances among US adults.
Design, setting, and participants: This study is a cross-sectional analysis of US nationally representative data from the National Health and Nutrition Examination Survey (2017-2020) among adults aged 20 years or older. Data analysis was performed from February to May 2022.
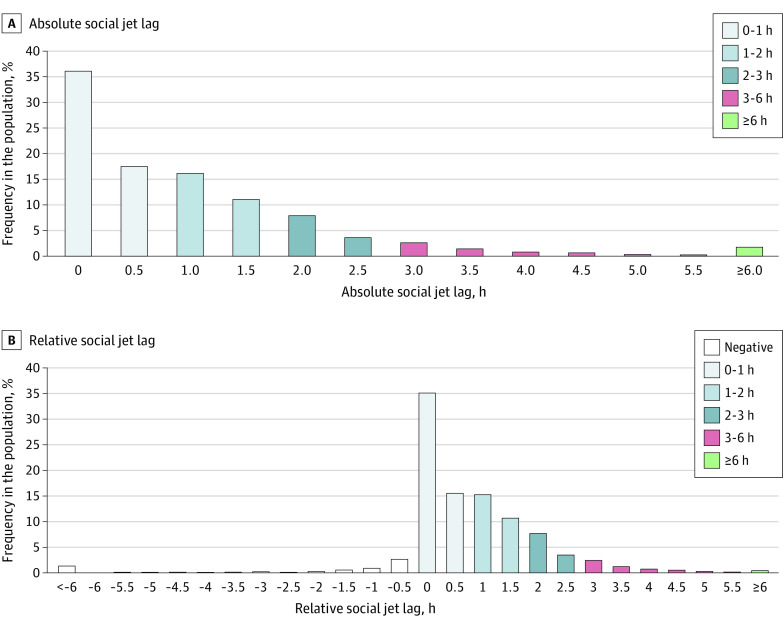
Main outcomes and measures: The main outcomes were means and/or distributions of sleep habits, including sleep duration and sleep-wake timing on workdays and free days, sleep debt (ie, the difference between sleep duration on free days and mean weekly sleep duration), and social jet lag (ie, the difference between the midpoint between sleep and wake time on workdays and free days). Prevalence of trouble sleeping (ie, participants told a doctor or other health professional that they have trouble sleeping) and daytime sleepiness (ie, self-reported feeling of being overly sleepy during the day ≥5 times per month) were also determined.
Results: A total of 9004 individuals (mean [SE] age, 48.3 [0.53] years; 4635 women [51.9%]; 3158 non-Hispanic White [62.8%]) were included in the current study. The mean sleep duration was 7.59 hours (95% CI, 7.54 to 7.64 hours) on workdays and 8.24 hours (95% CI, 8.17 to 8.31 hours) on free days (difference, 0.65 hour). The mean sleep and wake times were at 11:02 pm (95% CI, 10:57 pm to 11:17 pm) and 6:41 am (95% CI, 6:36 am to 6:45 am), respectively, on workdays and 11:25 pm (95% CI, 11:21 pm to 11:35 pm) and 7:41 am (95% CI, 7:37 am to 7:46 am), respectively, on free days (differences, 0.23 hour for sleep time and 1.00 hour for wake time). On workdays, 23.1% (95% CI, 21.3% to 24.9%) of adults slept less than 7 hours and 25.4% (95% CI, 24.1% to 26.6%) went to sleep at midnight or later; the corresponding percentages changed to 12.9% (95% CI, 11.6% to 14.1%) and 40.9% (95% CI, 38.4% to 43.5%), respectively, on free days. Furthermore, the mean sleep debt was 0.73 hours (95% CI, 0.68 to 0.77 hours), and mean social jet lag was 1.10 hours (95% CI, 1.05 to 1.15 hours); 30.5% (95% CI, 26.8% to 33.3%) of adults experienced 1 hour or more of sleep debt, and 46.5% (95% CI, 42.6% to 50.3%) experienced 1 hour or more of social jet lag. The prevalence of trouble sleeping was 29.8% (95% CI, 28.2% to 31.5%), and that of daytime sleepiness was 27.2% (95% CI, 25.0% to 29.5%).
Conclusions and relevance: In 2017 to 2020, US adults showed variability in sleep habits between workdays and free days, with longer sleep duration and later sleep-wake phases on free days, and high percentages of US adults experienced long-term sleep deprivation, chronic social jet lag, and frequent sleep disturbances. These findings provide evidence to further investigate potential approaches to optimize overall US sleep health.
Conflict of interest statement
Figures


References
MeSH terms
LinkOut - more resources
Full Text Sources
Medical
