

Evaluation of physical activity calorie equivalent (PACE) labels' impact on energy purchased in cafeterias: A stepped-wedge randomised controlled trial
- PMID: 36346795
- PMCID: PMC9642872
- DOI: 10.1371/journal.pmed.1004116
Evaluation of physical activity calorie equivalent (PACE) labels' impact on energy purchased in cafeterias: A stepped-wedge randomised controlled trial
Abstract
Background: A recent meta-analysis suggested that using physical activity calorie equivalent (PACE) labels results in people selecting and consuming less energy. However, the meta-analysis included only 1 study in a naturalistic setting, conducted in 4 convenience stores. We therefore aimed to estimate the effect of PACE labels on energy purchased in worksite cafeterias in the context of a randomised study design.
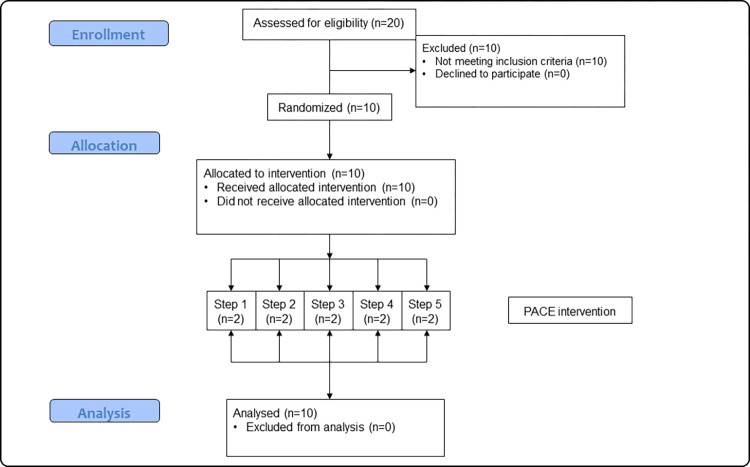
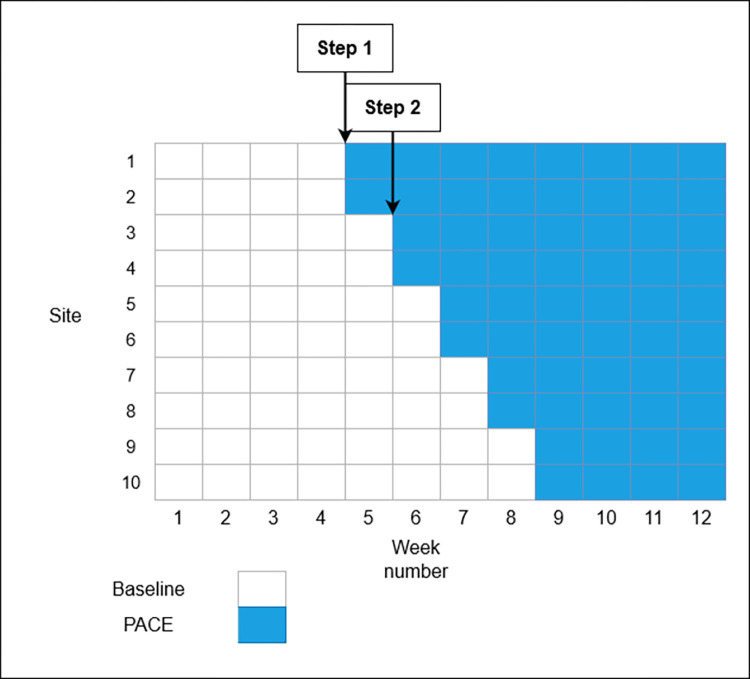
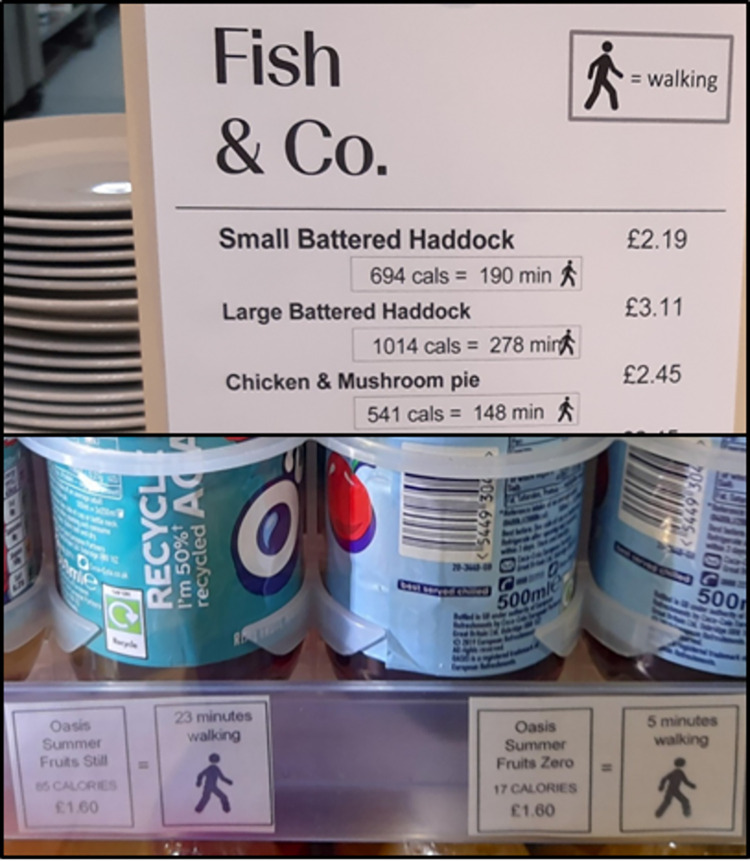
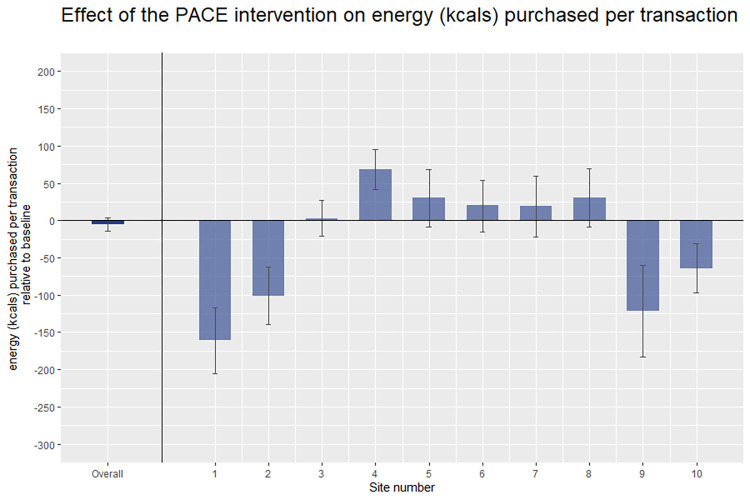
Methods and findings: A stepped-wedge randomised controlled trial (RCT) was conducted to investigate the effect of PACE labels (which include kcal content and minutes of walking required to expend the energy content of the labelled food) on energy purchased. The setting was 10 worksite cafeterias in England, which were randomised to the order in which they introduced PACE labels on selected food and drinks following a baseline period. There were approximately 19,000 workers employed at the sites, 72% male, with an average age of 40. The study ran for 12 weeks (06 April 2021 to 28 June 2021) with over 250,000 transactions recorded on electronic tills. The primary outcome was total energy (kcal) purchased from intervention items per day. The secondary outcomes were: energy purchased from non-intervention items per day, total energy purchased per day, and revenue. Regression models showed no evidence of an overall effect on energy purchased from intervention items, -1,934 kcals per site per day (95% CI -5,131 to 1,262), p = 0.236, during the intervention relative to baseline, equivalent to -5 kcals per transaction (95% CI -14 to 4). There was also no evidence for an effect on energy purchased from non-intervention items, -5 kcals per site per day (95% CI -513 to 504), p = 0.986, equivalent to 0 kcals per transaction (95% CI -1 to 1), and no clear evidence for total energy purchased -2,899 kcals per site (95% CI -5,810 to 11), p = 0.051, equivalent to -8 kcals per transaction (95% CI -16 to 0). Study limitations include using energy purchased and not energy consumed as the primary outcome and access only to transaction-level sales, rather than individual-level data.
Conclusion: Overall, the evidence was consistent with PACE labels not changing energy purchased in worksite cafeterias. There was considerable variation in effects between cafeterias, suggesting important unmeasured moderators.
Trial registration: The study was prospectively registered on ISRCTN (date: 30.03.21; ISRCTN31315776).
Copyright: © 2022 Reynolds et al. This is an open access article distributed under the terms of the Creative Commons Attribution License, which permits unrestricted use, distribution, and reproduction in any medium, provided the original author and source are credited.
Conflict of interest statement
The authors have declared that no competing interests exist.
Figures
References
-
- Steel N, Ford JA, Newton JN, Davis AC, Vos T, Naghavi M, et al.. Changes in health in the countries of the UK and 150 English Local Authority areas 1990–2016: a systematic analysis for the Global Burden of Disease Study 2016. Lancet. 2018;392:1647–61. doi: 10.1016/S0140-6736(18)32207-4 - DOI - PMC - PubMed
-
- Ziauddeen N, Almiron-Roig E, Penney T, Nicholson S, Kirk S, Page P. Eating at food outlets and “on the go” is associated with less healthy food choices in adults: cross-sectional data from the UK National Diet and Nutrition Survey Rolling Programme (2008–2014). Nutrients. 2017;9:1315–32. - PMC - PubMed
Publication types
MeSH terms
Associated data
Grants and funding
LinkOut - more resources
Full Text Sources
Miscellaneous
