Editorial
. 2023 Jan 6;4(1):78-97.
doi: 10.1158/2643-3230.BCD-22-0007.

Distinct Genetically Determined Origins of Myd88/BCL2-Driven Aggressive Lymphoma Rationalize Targeted Therapeutic Intervention Strategies

Affiliations
Editorial

Distinct Genetically Determined Origins of Myd88/BCL2-Driven Aggressive Lymphoma Rationalize Targeted Therapeutic Intervention Strategies

Ruth Flümann et al. Blood Cancer Discov. .

Abstract

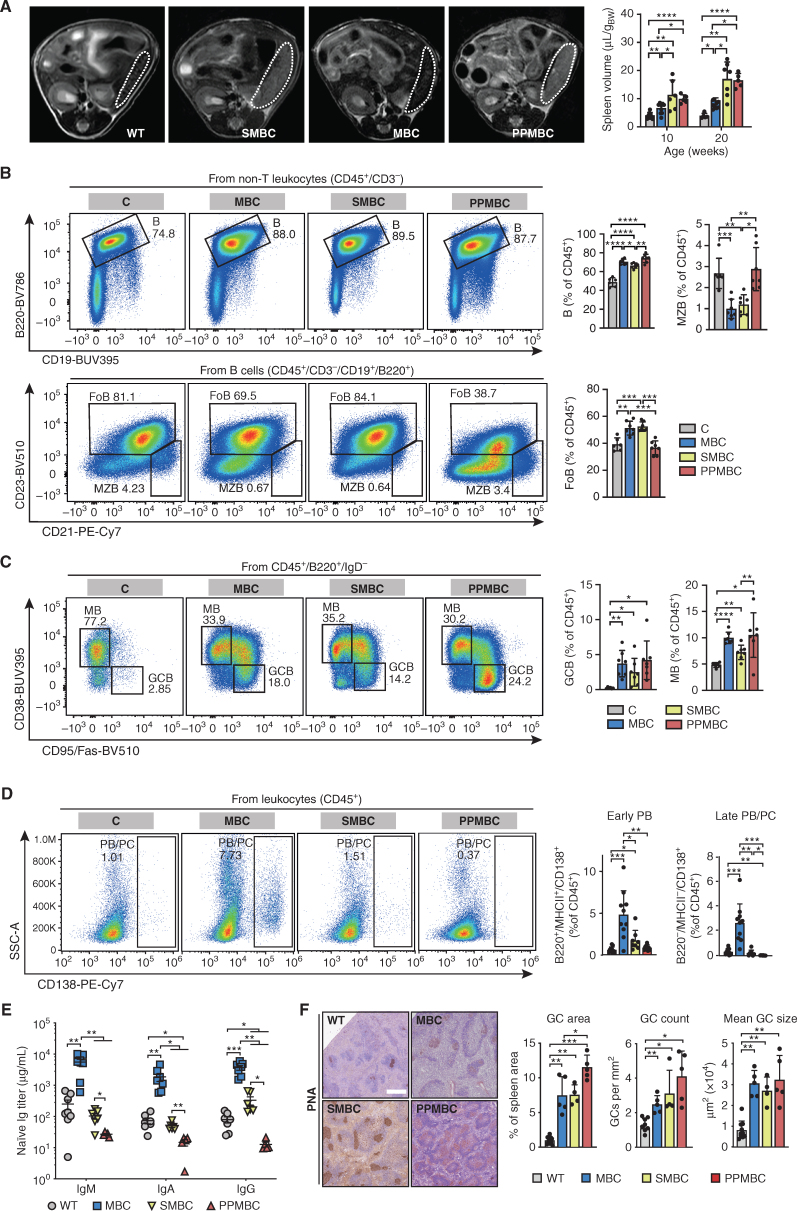
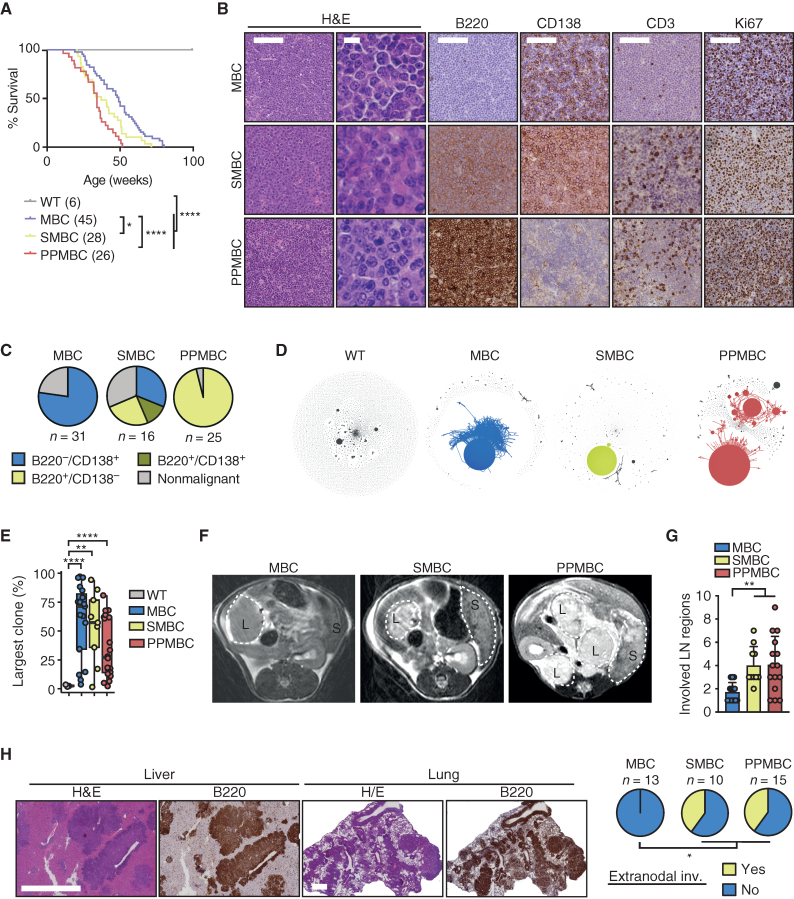
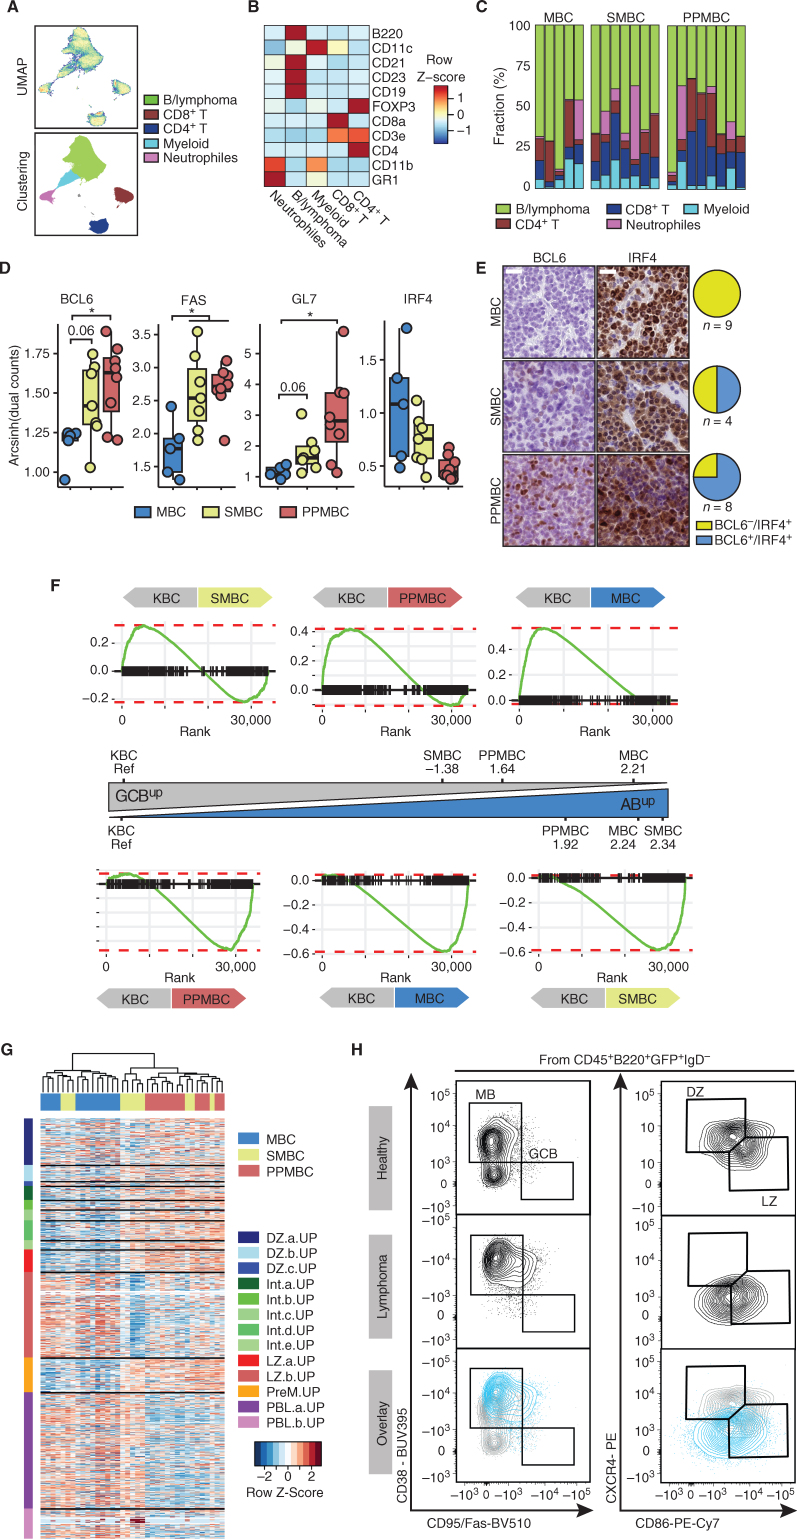
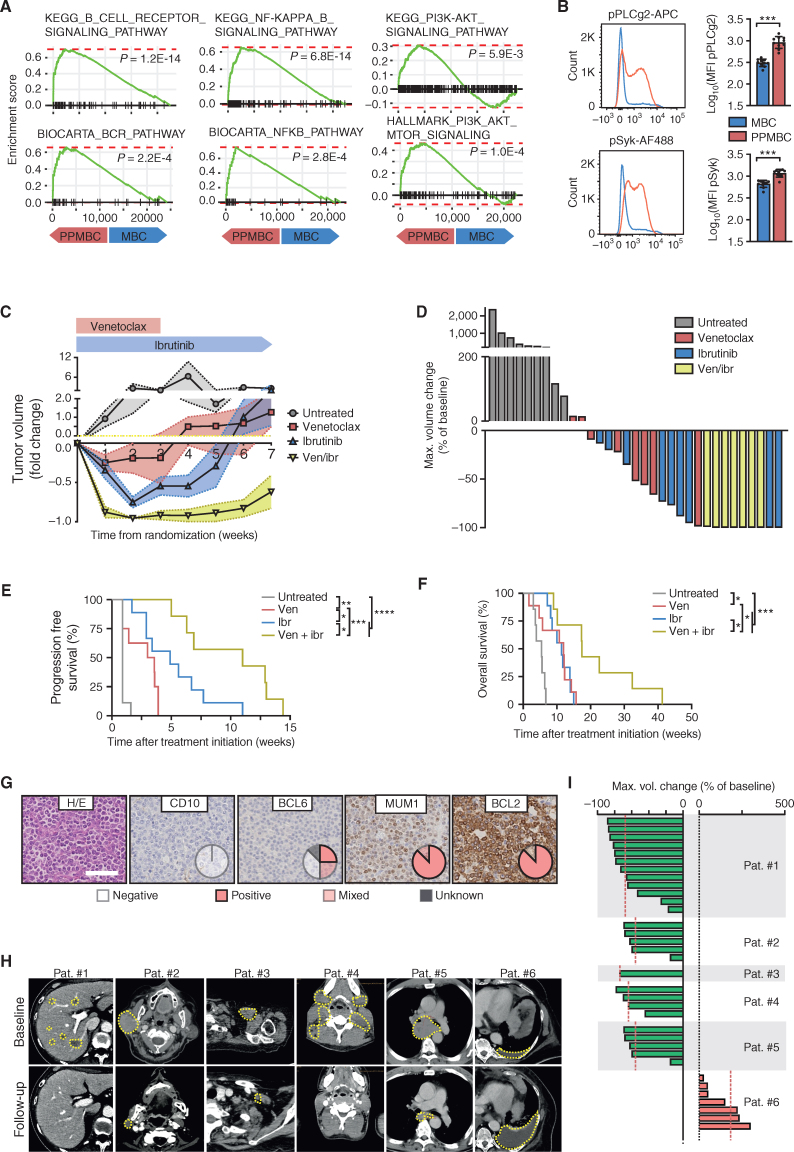
Genomic profiling revealed the identity of at least 5 subtypes of diffuse large B-cell lymphoma (DLBCL), including the MCD/C5 cluster characterized by aberrations in MYD88, BCL2, PRDM1, and/or SPIB. We generated mouse models harboring B cell-specific Prdm1 or Spib aberrations on the background of oncogenic Myd88 and Bcl2 lesions. We deployed whole-exome sequencing, transcriptome, flow-cytometry, and mass cytometry analyses to demonstrate that Prdm1- or Spib-altered lymphomas display molecular features consistent with prememory B cells and light-zone B cells, whereas lymphomas lacking these alterations were enriched for late light-zone and plasmablast-associated gene sets. Consistent with the phenotypic evidence for increased B cell receptor signaling activity in Prdm1-altered lymphomas, we demonstrate that combined BTK/BCL2 inhibition displays therapeutic activity in mice and in five of six relapsed/refractory DLBCL patients. Moreover, Prdm1-altered lymphomas were immunogenic upon transplantation into immuno-competent hosts, displayed an actionable PD-L1 surface expression, and were sensitive to antimurine-CD19-CAR-T cell therapy, in vivo.

Significance: Relapsed/refractory DLBCL remains a major medical challenge, and most of these patients succumb to their disease. Here, we generated mouse models, faithfully recapitulating the biology of MYD88-driven human DLBCL. These models revealed robust preclinical activity of combined BTK/BCL2 inhibition. We confirmed activity of this regimen in pretreated non-GCB-DLBCL patients. See related commentary by Leveille et al., p. 8. This article is highlighted in the In This Issue feature, p. 1.


Figures

Figure 1. Deletion of Prdm1 and amplification of Spib increase splenomegaly in MBC animals and abolish plasma cell differentiation. A, Representative axial MR images of 10-week-old animals (spleens are outlined by dashed lines) and volume quantifications of 10- and 20-week-old animals are depicted. Wild-type (n ≥ 5), MBC (n = 9), PPMBC (n = 5), and SMBC (n ≥ 6) spleens were quantified from MR images. B, Splenocytes of 10-week-old C (n = 6), MBC, PPMBC, and SMBC animals (n = 7 each) were analyzed by flow cytometry to analyze the frequencies of B, marginal zone B (MZB), and follicular B (FoB) cells, as well as memory B (MB) and germinal center B (GCB) cells (C). D, Quantification of plasmablasts (PB) and plasma cells (PC) in spleens from 10-week-old C (n = 11), MBC (n = 10), SMBC (n = 8), or PPMBC (n = 9) mice. B–D, Representative pseudocolor plots and gatings (left) as well as quantification of populations (right). Full gating strategies are depicted in Supplementary Fig. S12A–S12G. E, Serum immunoglobulin levels of 10-week-old wild-type (n = 8), MBC (n = 7), PPMBC (n = 5), and SMBC (n = 6) animals were measured by ELISA. F, Germinal centers (GCs) were stained by biotinylated PNA in splenic FFPE sections of 10-week-old wild-type (n = 10), MBC (n = 5), PPMBC (n = 5) and SMBC animals (n = 5) and quantified as GC area per spleen area and mean GC size (right). Additional stainings of these samples are provided in Supplementary Fig. S2A. Representative stainings are depicted (left). Scale bar represents 500 μm. *, P ≤ 0.05; **, P ≤ 0.01; ***, P ≤ 0.001; Welch unpaired two-tailed t test; error bars, SD.
Figure 1.
Deletion of Prdm1 and amplification of Spib increase splenomegaly in MBC animals and abolish plasma cell differentiation. A, Representative axial MR images of 10-week-old animals (spleens are outlined by dashed lines) and volume quantifications of 10- and 20-week-old animals are depicted. Wild-type (n ≥ 5), MBC (n = 9), PPMBC (n = 5), and SMBC (n ≥ 6) spleens were quantified from MR images. B, Splenocytes of 10-week-old C (n = 6), MBC, PPMBC, and SMBC animals (n = 7 each) were analyzed by flow cytometry to analyze the frequencies of B, marginal zone B (MZB), and follicular B (FoB) cells, as well as memory B (MB) and germinal center B (GCB) cells (C). D, Quantification of plasmablasts (PB) and plasma cells (PC) in spleens from 10-week-old C (n = 11), MBC (n = 10), SMBC (n = 8), or PPMBC (n = 9) mice. B–D, Representative pseudocolor plots and gatings (left) as well as quantification of populations (right). Full gating strategies are depicted in Supplementary Fig. S12A–S12G. E, Serum immunoglobulin levels of 10-week-old wild-type (n = 8), MBC (n = 7), PPMBC (n = 5), and SMBC (n = 6) animals were measured by ELISA. F, GCs were stained by biotinylated PNA in splenic FFPE sections of 10-week-old wild-type (n = 10), MBC (n = 5), PPMBC (n = 5) and SMBC animals (n = 5) and quantified as GC area per spleen area and mean GC size (right). Additional stainings of these samples are provided in Supplementary Fig. S2A. Representative stainings are depicted (left). Scale bar represents 500 μm. *, P ≤ 0.05; **, P ≤ 0.01; ***, P ≤ 0.001; Welch unpaired two-tailed t test; error bars, SD.
Figure 2. PPMBC and SMBC animals develop ABC-DLBCL–like tumors. A, Survival curves of wild-type (n = 6), MBC (n = 45, median 49 weeks), SMBC (n = 28, median 37.1 weeks), and PPMBC animals (n = 26, median 34.1 weeks). B, Representative H&E and IHC stainings of MBC, SMBC, and PPMBC tumors. Scale bars represent 100 μm (low magnification) and 10 μm (high magnification H&E). C, Quantification of the terminal phenotype of MBC, SMBC, and PPMBC animals shown in B. D, Clonality plots generated from BCR sequencing data. Each circle represents a specific V(D)J sequence with the circle size being proportional to the respective read count. Sequences with one mismatch are connected to clones. Clones with a size > 10% of reads are colorized, smaller clusters are in gray. E, Maximum clone sizes in MBC (n = 18), SMBC (n = 9), and PPMBC (n = 18) lesions compared with the polyclonal scenario observed in wild-type spleens (n = 3). F, Representative axial MR images of preterminal MBC (n = 16), SMBC (n = 8), and PPMBC (n = 12) animals. Lymphomas and spleens are outlined (“L” and “S,” respectively). G, Quantification of the number of lymph node regions infiltrated by lymphoma of moribund MBC (n = 14), SMBC (n = 10) and PPMBC (n = 15) animals at necropsy. H, Representative H&E and B220 stainings of infiltrated liver and lungs of terminal PPMBC animals and quantification of animals with observed extranodal manifestation. Scale bars represent 500 μm. *, P ≤ 0.05; **, P ≤ 0.01; ***, P ≤ 0.001; Welch unpaired two-tailed t test; error bars represent SD.
Figure 2.
PPMBC and SMBC animals develop ABC-DLBCL–like tumors. A, Survival curves of wild-type (n = 6), MBC (n = 45, median 49 weeks), SMBC (n = 28, median 37.1 weeks), and PPMBC animals (n = 26, median 34.1 weeks). B, Representative H&E and IHC stainings of MBC, SMBC, and PPMBC tumors. Scale bars represent 100 μm (low magnification) and 10 μm (high magnification H&E). C, Quantification of the terminal phenotype of MBC, SMBC, and PPMBC animals shown in B. D, Clonality plots generated from BCR sequencing data. Each circle represents a specific V(D)J sequence with the circle size being proportional to the respective read count. Sequences with one mismatch are connected to clones. Clones with a size > 10% of reads are colorized, smaller clusters are in gray. E, Maximum clone sizes in MBC (n = 18), SMBC (n = 9), and PPMBC (n = 18) lesions compared with the polyclonal scenario observed in wild-type spleens (n = 3). F, Representative axial MR images of preterminal MBC (n = 16), SMBC (n = 8), and PPMBC (n = 12) animals. Lymphomas and spleens are outlined (“L” and “S,” respectively). G, Quantification of the number of lymph node regions infiltrated by lymphoma of moribund MBC (n = 14), SMBC (n = 10) and PPMBC (n = 15) animals at necropsy. H, Representative H&E and B220 stainings of infiltrated liver and lungs of terminal PPMBC animals and quantification of animals with observed extranodal manifestation. Scale bars represent 500 μm. *, P ≤ 0.05; **, P ≤ 0.01; ***, P ≤ 0.001; Welch unpaired two-tailed t test; error bars represent SD.
Figure 3. PPMBC and SMBC lymphomas display transcriptomic and surface marker features associated with germinal center–derived lymphomas. A, Cell suspensions from MBC (n = 5), SMBC (n = 7), and PPMBC (n = 8) tumors were analyzed by mass cytometry. Dimensionality reduction of the data set was performed by UMAP and clusters were gated manually. B, Heat map of lineage markers used for cluster identification. C, Cluster sizes observed in MBC, SMBC, and PPMBC samples. D, Expression of BCL6, FAS, GL7, and IRF4 in the “B/lymphoma” cluster. E, Representative images (left) and quantification (right) of IHC BCL6 and IRF4 stainings in MBC, SMBC, and PPMBC lymphomas. Scale bar represents 20 μm. F, Gene set enrichment plots comparing the transcriptional profiles of MBC (n = 13), SMBC (n = 11), and PPMBC (n = 13) lymphomas to the KBC model (n = 6) as reference. The NES is illustrated as an approximation of the distance between the genotypes. G, Bulk transcription profiles of MBC, SMBC, and PPMBC lymphomas were clustered in an unsupervised manner by their expression levels of published gene sets derived from single-cell transcriptomic analyses of human GC B cells (26). DZ, dark zone; Int, intermediate; LZ, light zone; PreM, pre-memory B; PBL, plasmablast. H, Representative flow cytometry plots and gating strategy of splenic MB, GCB, and DZ/LZ B cells from a 10-week-old healthy C mouse (top) and lymphoma cells from a PPMBC lesion (middle). Bottom, an overlay of both samples. A total of 10 PPMBC lymphomas was analyzed; additional samples are illustrated in Supplementary Fig. S8, full gating strategy is depicted in Supplementary Fig. S12A; H–I, *, P ≤ 0.05, Welch unpaired two-tailed t test.
Figure 3.
PPMBC and SMBC lymphomas display transcriptomic and surface marker features associated with germinal center–derived lymphomas. A, Cell suspensions from MBC (n = 5), SMBC (n = 7), and PPMBC (n = 8) tumors were analyzed by mass cytometry. Dimensionality reduction of the data set was performed by UMAP and clusters were gated manually. B, Heat map of lineage markers used for cluster identification. C, Cluster sizes observed in MBC, SMBC, and PPMBC samples. D, Expression of BCL6, FAS, GL7, and IRF4 in the “B/lymphoma” cluster. E, Representative images (left) and quantification (right) of IHC BCL6 and IRF4 stainings in MBC, SMBC, and PPMBC lymphomas. Scale bar represents 20 μm. F, Gene set enrichment plots comparing the transcriptional profiles of MBC (n = 13), SMBC (n = 11), and PPMBC (n = 13) lymphomas to the KBC model (n = 6) as reference. The NES is illustrated as an approximation of the distance between the genotypes. G, Bulk transcription profiles of MBC, SMBC, and PPMBC lymphomas were clustered in an unsupervised manner by their expression levels of published gene sets derived from single-cell transcriptomic analyses of human GC B cells (26). DZ, dark zone; Int, intermediate; LZ, light zone; PreM, prememory B; PBL, plasmablast. H, Representative flow cytometry plots and gating strategy of splenic MB, GCB, and DZ/LZ B cells from a 10-week-old healthy C mouse (top) and lymphoma cells from a PPMBC lesion (middle). Bottom, an overlay of both samples. A total of 10 PPMBC lymphomas was analyzed; additional samples are illustrated in Supplementary Fig. S8, full gating strategy is depicted in Supplementary Fig. S12A. H–I, *, P ≤ 0.05, Welch unpaired two-tailed t test.
Figure 4. Murine PPMBC lymphomas are susceptible to immune-therapeutic approaches. A, Schematic depiction of the anti-mCD19scFv-CD28-CD3z CAR construct (27). B, Population sizes of mock- and CAR-transduced T cells isolated from C57BL6/J wild-type spleens and a CD19+ PPMBC lymphoma cell line at the indicated effector:target ratios after 48 hours of coculture after gating for live cells. C, PPMBC mice with a low or high lymphoma-burden [spleen volume 500–700 μL (n = 3) or >700 μL (n = 3), respectively] were treated with a single injection of 2 × 106 anti-mCD19 CAR-T cells. Tumor volume was monitored weekly via MRI and is visualized as fold change from baseline. D, Kaplan–Meier curve showing the overall survival of CAR-T–treated mice and untreated controls. The CAR-T–treated cohort is depicted in total, as well as separated into high- and low lymphoma-burden animals. E, MRI-determined tumor volume of PPMBC animals treated with an anti–PD-L1 (n = 7), displayed as fold change from baseline. Untreated animals (n = 8) served as controls. F, Kaplan–Meier curve showing the overall survival of anti–PD-L1-treated mice (n = 7) and untreated controls (n = 8). *, P ≤ 0.05; **, P ≤ 0.01; log-rank test.
Figure 4.
Murine PPMBC lymphomas are susceptible to immune-therapeutic approaches. A, Schematic depiction of the anti-mCD19scFv-CD28-CD3z CAR construct (27). B, Population sizes of mock- and CAR-transduced T cells isolated from C57BL6/J wild-type spleens and a CD19+ PPMBC lymphoma cell line at the indicated effector:target ratios after 48 hours of coculture after gating for live cells. C, PPMBC mice with a low or high lymphoma-burden [spleen volume 500–700 μL (n = 3) or >700 μL (n = 3), respectively] were treated with a single injection of 2 × 106 anti-mCD19 CAR-T cells. Tumor volume was monitored weekly via MRI and is visualized as fold change from baseline. D, Kaplan–Meier curve showing the overall survival of CAR-T–treated mice and untreated controls. The CAR-T–treated cohort is depicted in total, as well as separated into high and low lymphoma-burden animals. E, MRI-determined tumor volume of PPMBC animals treated with an anti–PD-L1 (n = 7), displayed as fold change from baseline. Untreated animals (n = 8) served as controls. F, Kaplan–Meier curve showing the overall survival of anti–PD-L1-treated mice (n = 7) and untreated controls (n = 8). *, P ≤ 0.05; **, P ≤ 0.01; log-rank test.
Figure 5. Murine PPMBC lymphomas and human non-GCB lymphomas are sensitive to combined treatment with venetoclax and ibrutinib. A, Gene set enrichment analysis plots for BCR-related gene signatures from the KEGG, Biocarta, and Hallmark collections, comparing PPMBC and MBC lymphomas (n = 13 each). B, Flow-cytometric analysis of phospho-PLCg2 and phospho-Syk levels in IgDneg cells from MBC (n = 10) and PPMBC (n = 10) lymphomas. C, Normalized tumor volumes after tumor detection of untreated (n = 7), venetoclax-treated (n = 8), ibrutinib-treated (n = 9), or combination-treated (n = 7) PPMBC animals. D, Best tumor volume change of untreated, venetoclax-treated, ibrutinib-treated and combination-treated PPMBC animals. E, PFS and (F) overall survival of untreated, venetoclax-treated, ibrutinib-treated and combination-treated PPMBC animals. G, Six patients were stratified as non–GCB-DLBCL by the Hans algorithm. One representative case is visualized; pie charts illustrate the distribution of staining patterns across the cohort (n = 6). Scale bar represents 50 μm. H, CT-images of patients #1 to #6. Target lesions are outlined. I, Best tumor volume change of individual target lesions of each patient. *, P ≤ 0.05; **, P ≤ 0.01; ***, P ≤ 0.001; ****, P ≤ 0.0001; B, Welch unpaired two-tailed t test; E, F, log-rank test; error bars represent SD.
Figure 5.
Murine PPMBC lymphomas and human non-GCB lymphomas are sensitive to combined treatment with venetoclax and ibrutinib. A, Gene set enrichment analysis plots for BCR-related gene signatures from the KEGG, Biocarta, and Hallmark collections, comparing PPMBC and MBC lymphomas (n = 13 each). B, Flow-cytometric analysis of phospho-PLCg2 and phospho-Syk levels in IgDneg cells from MBC (n = 10) and PPMBC (n = 10) lymphomas. C, Normalized tumor volumes after tumor detection of untreated (n = 7), venetoclax-treated (n = 8), ibrutinib-treated (n = 9), or combination-treated (n = 7) PPMBC animals. D, Best tumor volume change of untreated, venetoclax-treated, ibrutinib-treated and combination-treated PPMBC animals. E, PFS and (F) overall survival of untreated, venetoclax-treated, ibrutinib-treated and combination-treated PPMBC animals. G, Six patients were stratified as non–GCB-DLBCL by the Hans algorithm. One representative case is visualized; pie charts illustrate the distribution of staining patterns across the cohort (n = 6). Scale bar represents 50 μm. H, CT-images of patients #1 to #6. Target lesions are outlined. I, Best tumor volume change of individual target lesions of each patient. *, P ≤ 0.05; **, P ≤ 0.01; ***, P ≤ 0.001; ****, P ≤ 0.0001; B, Welch unpaired two-tailed t test; E and F, log-rank test; error bars represent SD.

Comment in

References

    1. Swerdlow SH, Campo E, Pileri SA, Harris NL, Stein H, Siebert R, et al. . The 2016 revision of the World Health Organization classification of lymphoid neoplasms. Blood 2016;127:2375–90. - PMC - PubMed
    1. Alizadeh AA, Eisen MB, Davis RE, Ma C, Lossos IS, Rosenwald A, et al. . Distinct types of diffuse large B-cell lymphoma identified by gene expression profiling. Nature 2000;403:503–11. - PubMed
    1. Shaffer AL 3rd, Young RM, Staudt LM. Pathogenesis of human B cell lymphomas. Annu Rev Immunol 2012;30:565–610. - PMC - PubMed
    1. Basso K, Dalla-Favera R. Germinal centres and B cell lymphomagenesis. Nat Rev Immunol 2015;15:172–84. - PubMed
    1. Grondona P, Bucher P, Schulze-Osthoff K, Hailfinger S, Schmitt A. NF-kappaB activation in lymphoid malignancies: genetics, signaling, and targeted therapy. Biomedicines 2018;6:38. - PMC - PubMed

Publication types

MeSH terms

Substances