. 2022 Nov 23;185(24):4526-4540.e18.
doi: 10.1016/j.cell.2022.10.008. Epub 2022 Nov 7.

A microbial transporter of the dietary antioxidant ergothioneine

Affiliations

A microbial transporter of the dietary antioxidant ergothioneine

Daniel G Dumitrescu et al. Cell. .

Abstract

Low-molecular-weight (LMW) thiols are small-molecule antioxidants required for the maintenance of intracellular redox homeostasis. However, many host-associated microbes, including the gastric pathogen Helicobacter pylori, unexpectedly lack LMW-thiol biosynthetic pathways. Using reactivity-guided metabolomics, we identified the unusual LMW thiol ergothioneine (EGT) in H. pylori. Dietary EGT accumulates to millimolar levels in human tissues and has been broadly implicated in mitigating disease risk. Although certain microorganisms synthesize EGT, we discovered that H. pylori acquires this LMW thiol from the host environment using a highly selective ATP-binding cassette transporter-EgtUV. EgtUV confers a competitive colonization advantage in vivo and is widely conserved in gastrointestinal microbes. Furthermore, we found that human fecal bacteria metabolize EGT, which may contribute to production of the disease-associated metabolite trimethylamine N-oxide. Collectively, our findings illustrate a previously unappreciated mechanism of microbial redox regulation in the gut and suggest that inter-kingdom competition for dietary EGT may broadly impact human health.

Keywords: ABC transporter; Helicobacter pylori; ergothioneine; host-microbe; low-molecular-weight thiol; metabolism; microbiome; oxidative stress; redox regulation.


Conflict of interest statement

Declaration of interests A.S. is a paid consultant of LIV Process.

Figures

Figure 1.
Figure 1.. H. pylori imports the antioxidant EGT
(A) Workflow for the detection of LMW thiols in H. pylori. (B) Extracted ion chromatogram (EIC) spectra (m/z 420.1700) of H. pylori (Hp) cell extracts treated with or without mBBr, and of mBBr alone. (C) Chemical structure of EGT. (D) EIC spectra (m/z 420.1700) of either H. pylori cell extracts or an EGT standard treated with mBBr, or a 1:1 mixture of the two (co-injection). (E) LC–MS/MS analysis of the samples from D. (F) His, Met, and Cys are required for EGT synthesis and are incorporated into the EGT structure as shown. (G) H. pylori extracts from cultures supplemented with 1 mM His or Met, 0.2 mM Cys, or vehicle control were labeled with mBBr and analyzed by LC–MS to quantify EGT levels using a deuterated EGT standard. n.s., not significant, by one-way ANOVA. (H) EGT content of H. pylori conditioned medium and of medium alone was quantified as in G. ****P <0.0001, by unpaired two-tailed t-test. (I) EGT (grey bars) and EGT-d3 (white bars) content of H. pylori cell extracts from cultures supplemented with 0, 1, or 5 μg of EGT-d3, quantified as in G. *P <0.05; **P <0.01; ***P <0.001; n.s., not significant, by two-way ANOVA with Tukey’s multiple comparisons. Error bars represent means ± s.d. of biological replicates. See also Figure S1.
Figure 2.
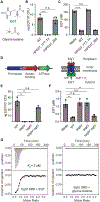
Figure 2.. The ABC transporter EgtUV is required for EGT uptake by H. pylori
(A) Chemical structures of EGT and glycine betaine. EGT content of (B) cell extracts and (C) conditioned media from WT, HPG27_777∷Tn, and ΔHPG27_885 H. pylori G27MA cultures was quantified by mBBr labeling and LC–MS. ***P <0.001; ****P <0.0001; n.s., not significant, by one-way ANOVA with Tukey’s multiple comparisons. Data for WT and media controls in Fig. 2C are the same as in Fig. 1H. (D) Schematic representation of transporter locus (left) and complex (right). EGT content of (E) H. pylori cell extracts and (F) conditioned medium from WT, ΔegtUHPG27_777), ΔegtVHPG27_778), and ΔegtV∷egtVHPG27_778∷HPG27_778) H. pylori G27MA cultures was quantified by mBBr labeling and LC–MS. **P <0.01; n.s., not significant, by one-way ANOVA with Tukey’s multiple comparisons. (G) ITC analysis of EgtU SBD binding to EGT (left) or glycine betaine (right). ITC data are representative of 2–3 technical replicates. Error bars represent means ± s.d. of biological replicates. See also Figure S2, S3, Table S1.
Figure 3.
Figure 3.. EgtUV can import host-derived EGT
(A) Workflow for the analysis of EGT levels in co-culture fractions. The EGT-d3 content of (B) AGS cell extracts, (C and D) conditioned media, and (E) H. pylori cell extracts from AGS cells infected with WT, ΔegtV, or ΔegtV∷egtV H. pylori or medium alone (mock) was quantified by mBBr labeling and LC–MS. AGS cells grown in the absence of EGT-d3 and then mock-treated were included as a control. The EGT-d3 content of conditioned medium from mock-treated AGS cells was quantified at t=0 and 10 h (D). Data from the mock control in Fig. 3C appear in the 10-h timepoint of Fig. 3D. (F) CFU of H. pylori in conditioned culture media from C. *P <0.05; **P <0.01; ****P <0.0001; n.s., not significant, by one-way ANOVA with Tukey’s multiple comparisons (B, C, E, F) and unpaired two-tailed t-test (D). Error bars represent means ± s.d. of biological replicates.
Figure 4.
Figure 4.. EgtUV confers a competitive colonization advantage in vivo
CFU of WT, ΔegtV, and ΔegtV∷egtV H. pylori G27MA were enumerated following treatment with (A) bleach (NaOCl; 5 mM, 15 min), or (B) hydrogen peroxide (H2O2; 5 mM, 3 h). *P <0.05; n.s., not significant, by two-way ANOVA with Fisher’s LSD test. Error bars represent means ± s.d. of biological replicates. (C) Timeline for mouse single and co-infections with H. pylori PMSS1. For single infections, the stomach was divided in two for CFU enumeration and histopathology (Hist) analysis. (D) CFU of WT, ΔegtV, and ΔegtV∷egtV H. pylori in the stomachs of singly colonized mice at 1, 8, and 16 weeks post infection. N=10 mice per condition. Horizontal bars denote the mean CFU. The limit of detection is denoted by the dashed red line. *P <0.05; n.s., not significant, by one-way ANOVA with Tukey’s multiple comparisons. (E) Competitive indices of mice co-infected with a 1:1 mixture of either ΔegtV and WT or ΔegtV and ΔegtV∷egtV H. pylori at 2 weeks post-infection. N=8 mice per condition. ****P <0.0001; competitive indices were normalized by the input ratio and compared to a hypothetical mean of 1 using a one-sample t-test. Open circles denote outliers removed via Grubbs′ test. Horizontal bars denote the geometric mean. All animal colonization experiments were performed twice with similar results. (F) Working model for the functional role of H. pylori EgtUV in vivo. See also Figure S4, S5.
Figure 5.
Figure 5.. EgtUV is widely conserved in gastrointestinal microbes
(A) A neighbor-joining phylogenetic tree was generated using the amino-acid sequences of 35 microbial homologs of the H. pylori EgtU SBD (Geneious Prime). Phyla are denoted by branch color. The corresponding gene clusters are shown on the right, with permease, ATPase, and SBD subunits indicated. Four clades of differing operon structure are labeled. (B) EGT-d3 content of cell extracts from diverse bacterial species that either encode or lack an egtUV homolog. Bacteria were cultured in the presence of EGT-d3 prior to mBBr labeling and LC–MS. EGT-d3 content of cell extracts from the indicated WT, mutant, and complemented strains of (C) E. coli, (D) S. enterica Typhimurium, and (E) C. difficile was quantified as in B. *P <0.05; **P <0.01; n.s., not significant, by one-way ANOVA with Holm-Šídák’s multiple comparisons test. Error bars represent means ± s.d. of biological replicates. See also Table S2.
Figure 6.
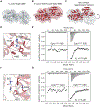
Figure 6.. H. pylori EgtU SBD binds EGT using both conserved and unique features
Cartoon representation of H. pylori EgtU crystal structure showing the two-lobed architecture in the apo form (A) and bound to EGT (B). (C) Comparison of apo (gray surface) and EGT-bound (red cartoon) crystal structures, highlighting the domain movement upon ligand binding that closes the binding pocket around EGT. Zoom in of EGT-binding pocket of EgtU, showing the (D) aromatic betaine box residues surrounding EGT or (F) side chains interacting with the thioimidazole portion of EGT. ITC analysis of Y390 (E) or R454 (G) EgtU SBD mutants binding to EGT. Kd values are the average of the two independent experiments. See also Figure S6, S7, Table S1, Table S3.
Figure 7.
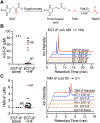
Figure 7.. EGT is metabolized by human fecal bacteria
(A) The microbial enzyme ergothionase converts EGT into thiourocanic acid and trimethylamine (TMA), which can be oxidized by host enzymes to trimethylamine N-oxide (TMAO). (B) EGT-d9 and (C) TMA-d9 levels were quantified following anaerobic incubation of EGT-d9 with each of 25 human fecal (HF) samples for 24 h (left). Traces of EGT-d9 (B) and TMA-d9 (C) fragmentation products in mixtures containing one of two representative fecal samples (H5 and H7) or EGT-d9 and TMA-d9 alone are shown on the right. EGT-d9 levels in B were quantified via mBBr labeling and LC–MS using an EGT-d3 internal standard. TMA-d9 levels in C were quantified using the linear range of a TMA-d9 standard curve.

Comment in

Similar articles

Cited by

References

    1. Adams PD, Afonine PV, Bunkóczi G, Chen VB, Davis IW, Echols N, Headd JJ, Hung LW, Kapral GJ, Grosse-Kunstleve RW, et al. (2010). PHENIX: a comprehensive Python-based system for macromolecular structure solution. Acta Crystallogr. D Biol. Crystallogr 66, 213–221. - PMC - PubMed
    1. Amieva M, and Peek RM Jr. (2016). Pathobiology of Helicobacter pylori-induced gastric cancer. Gastroenterology 150, 64–78. - PMC - PubMed
    1. Amieva MR, Vogelmann R, Covacci A, Tompkins LS, Nelson WJ, and Falkow S (2003). Disruption of the epithelial apical-junctional complex by Helicobacter pylori CagA. Science 300, 1430–1434. - PMC - PubMed
    1. Andermann TM, Chen YT, and Ottemann KM (2002). Two predicted chemoreceptors of Helicobacter pylori promote stomach infection. Infect. Immun 70, 5877–5881. - PMC - PubMed
    1. Arnold IC, Lee JY, Amieva MR, Roers A, Flavell RA, Sparwasser T, and Müller A (2011). Tolerance rather than immunity protects from Helicobacter pylori-induced gastric preneoplasia. Gastroenterology 140, 199–209. - PMC - PubMed

Publication types

LinkOut - more resources