. 2022 Nov 23;185(24):4634-4653.e22.
doi: 10.1016/j.cell.2022.10.017. Epub 2022 Nov 7.

The phenotypic landscape of essential human genes

Affiliations

The phenotypic landscape of essential human genes

Luke Funk et al. Cell. .

Abstract

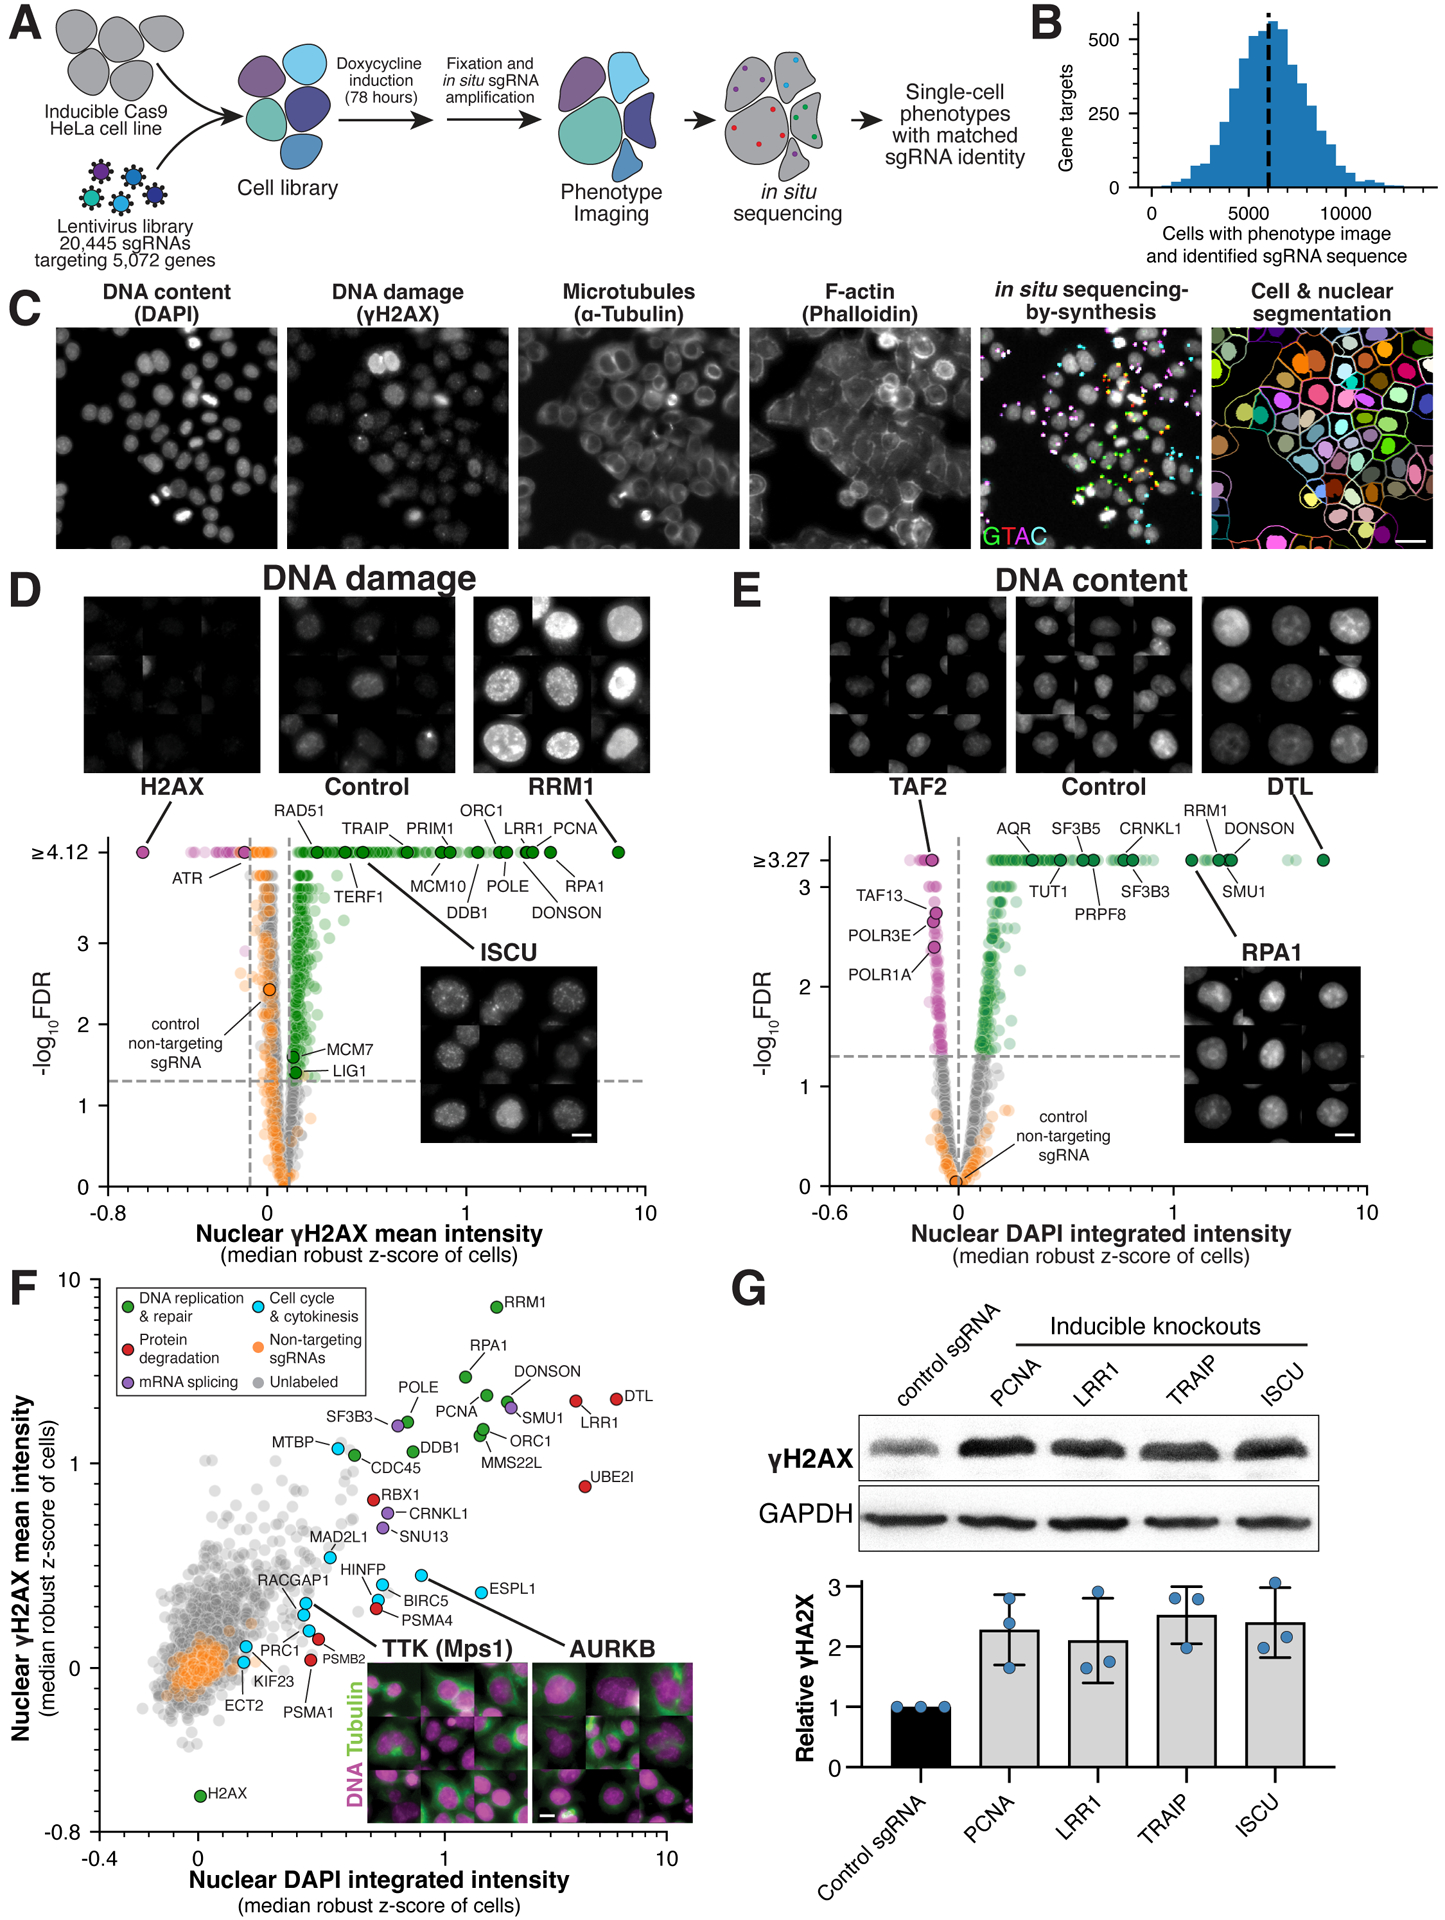
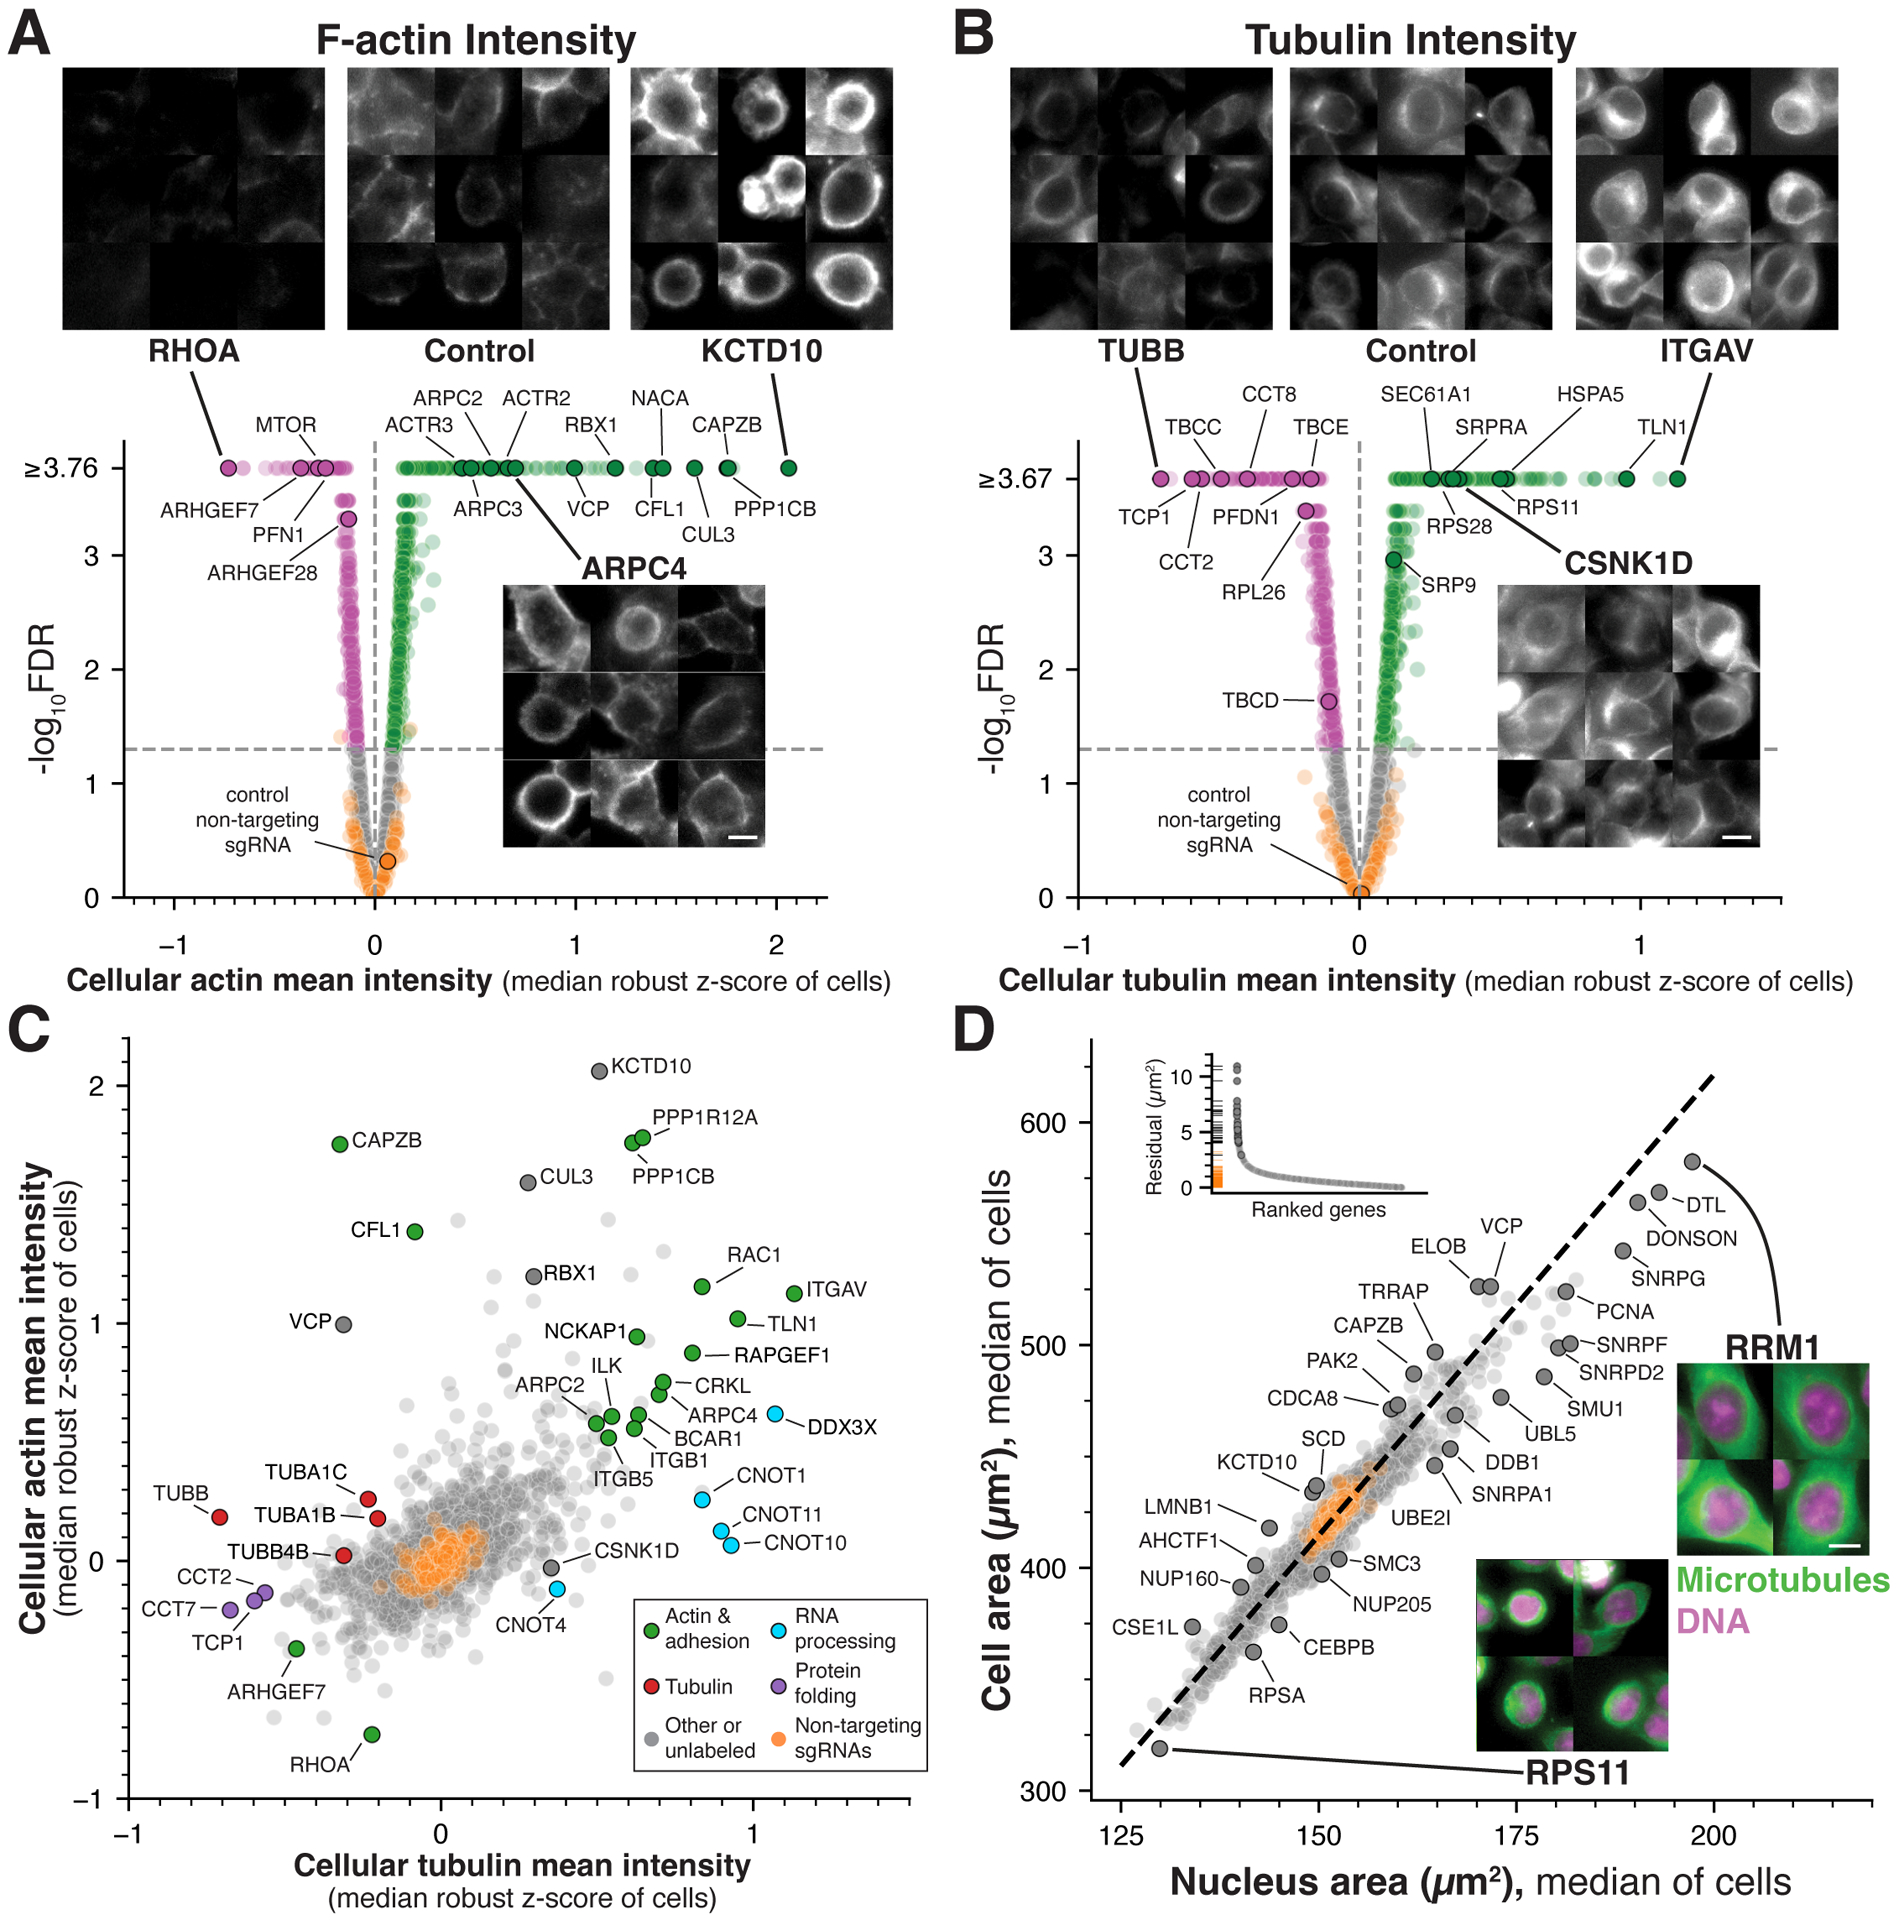
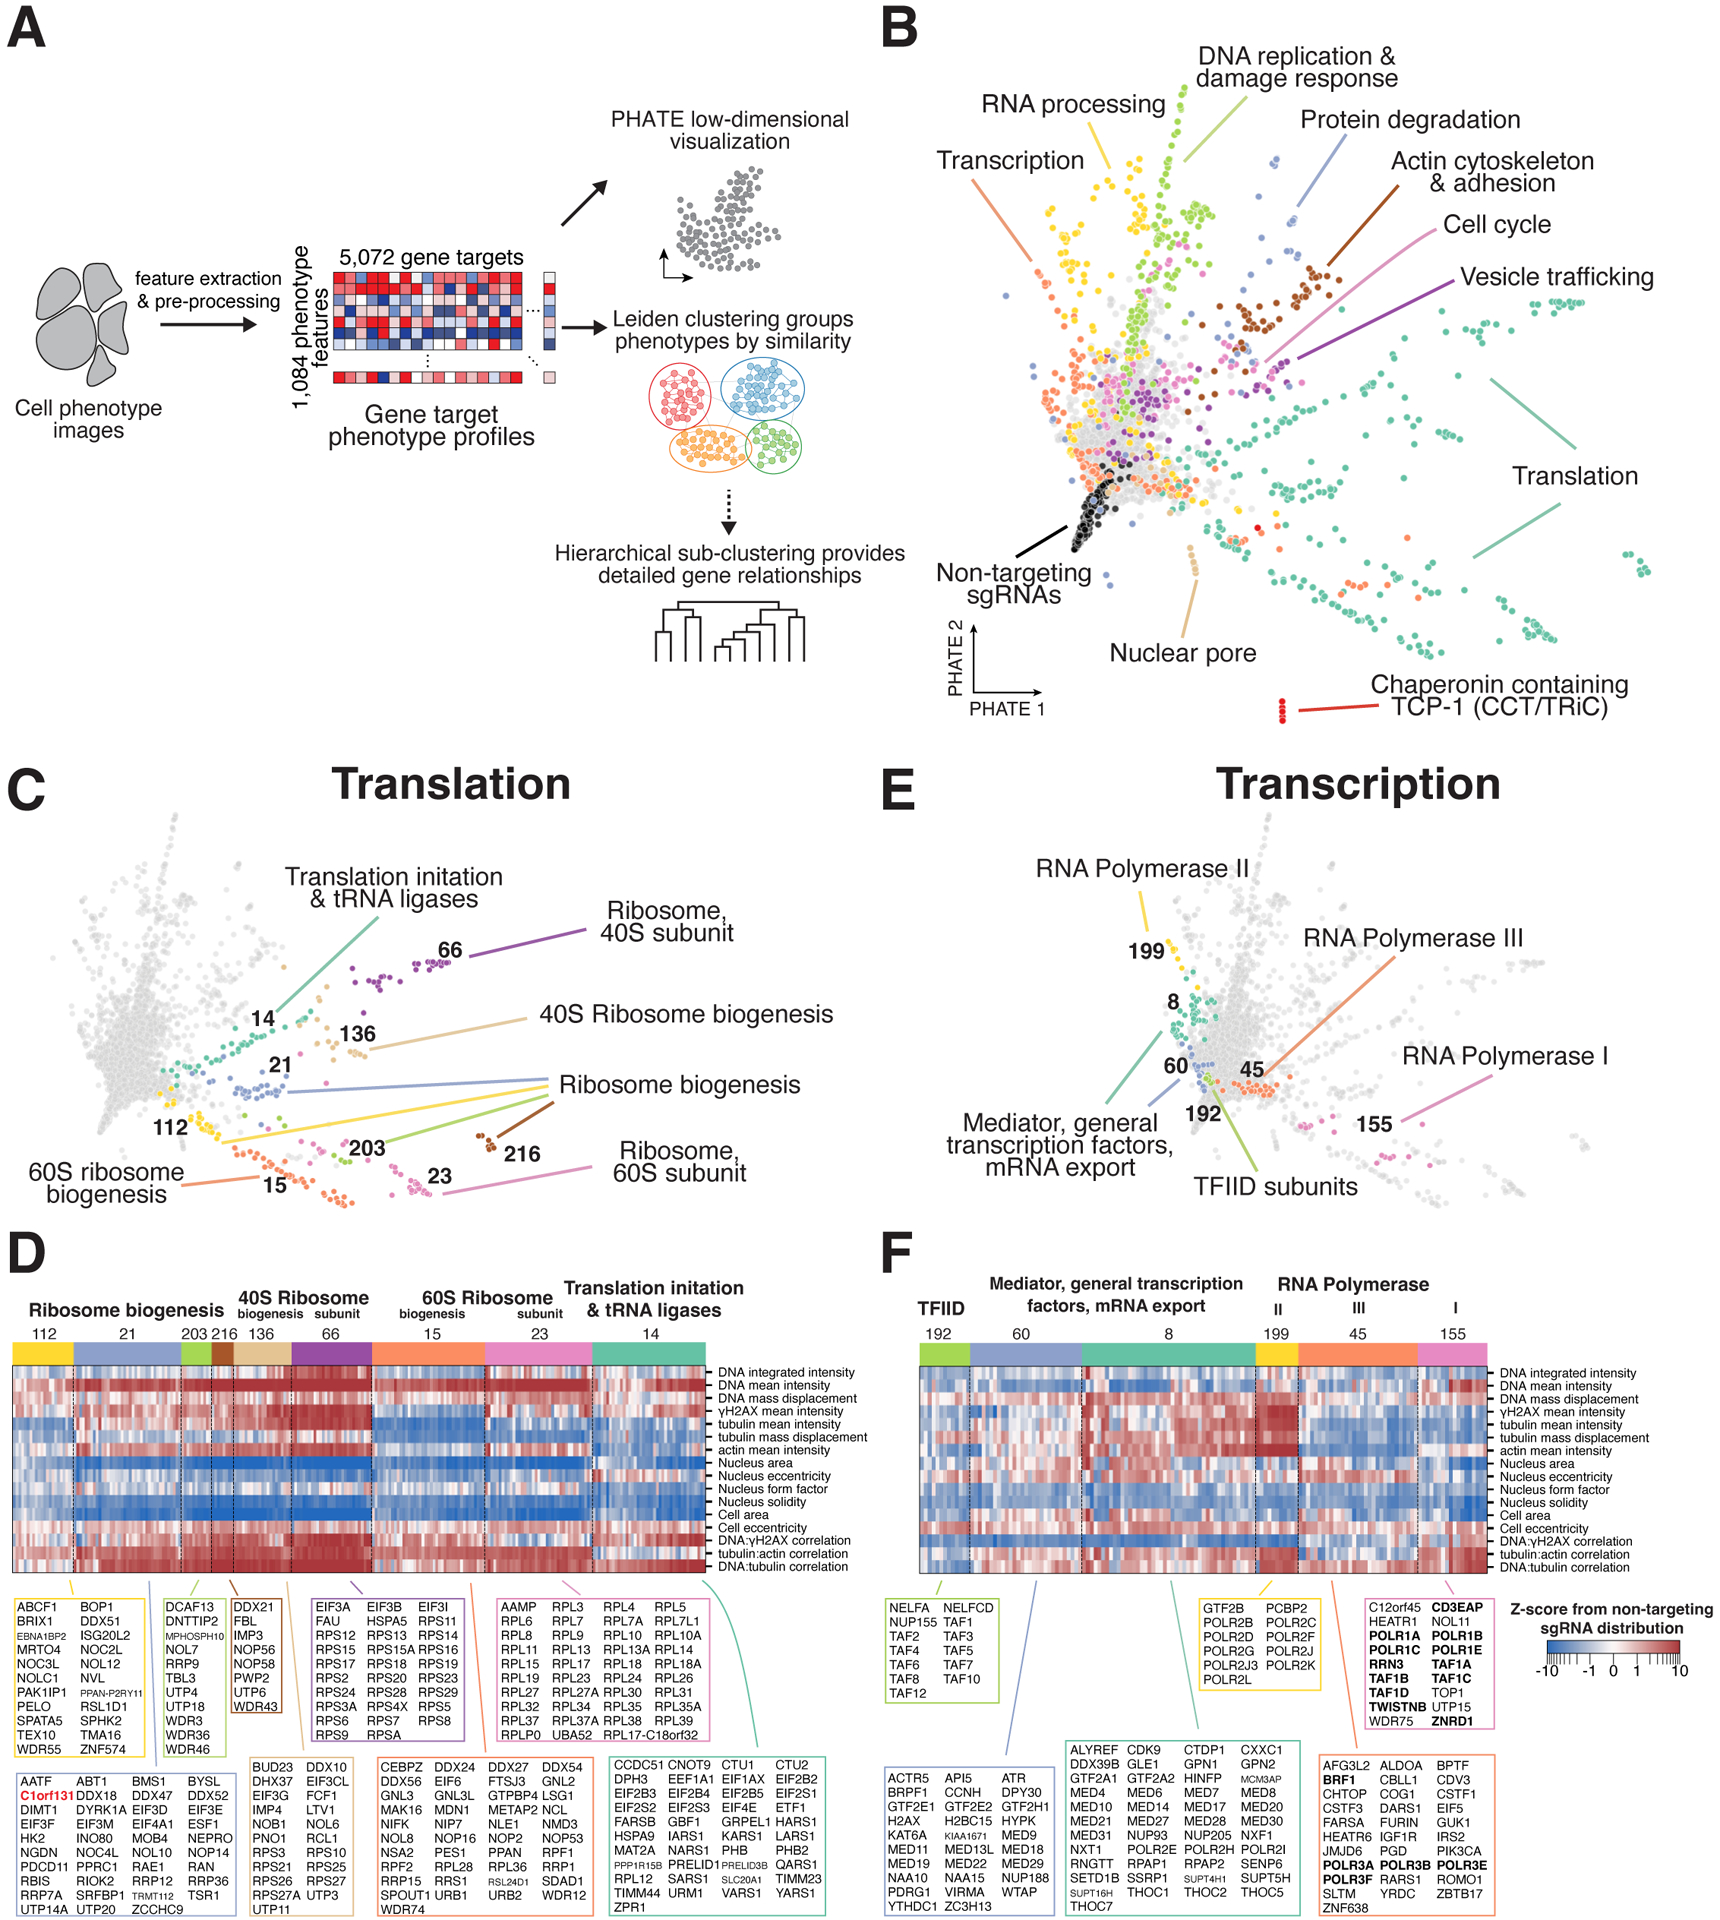
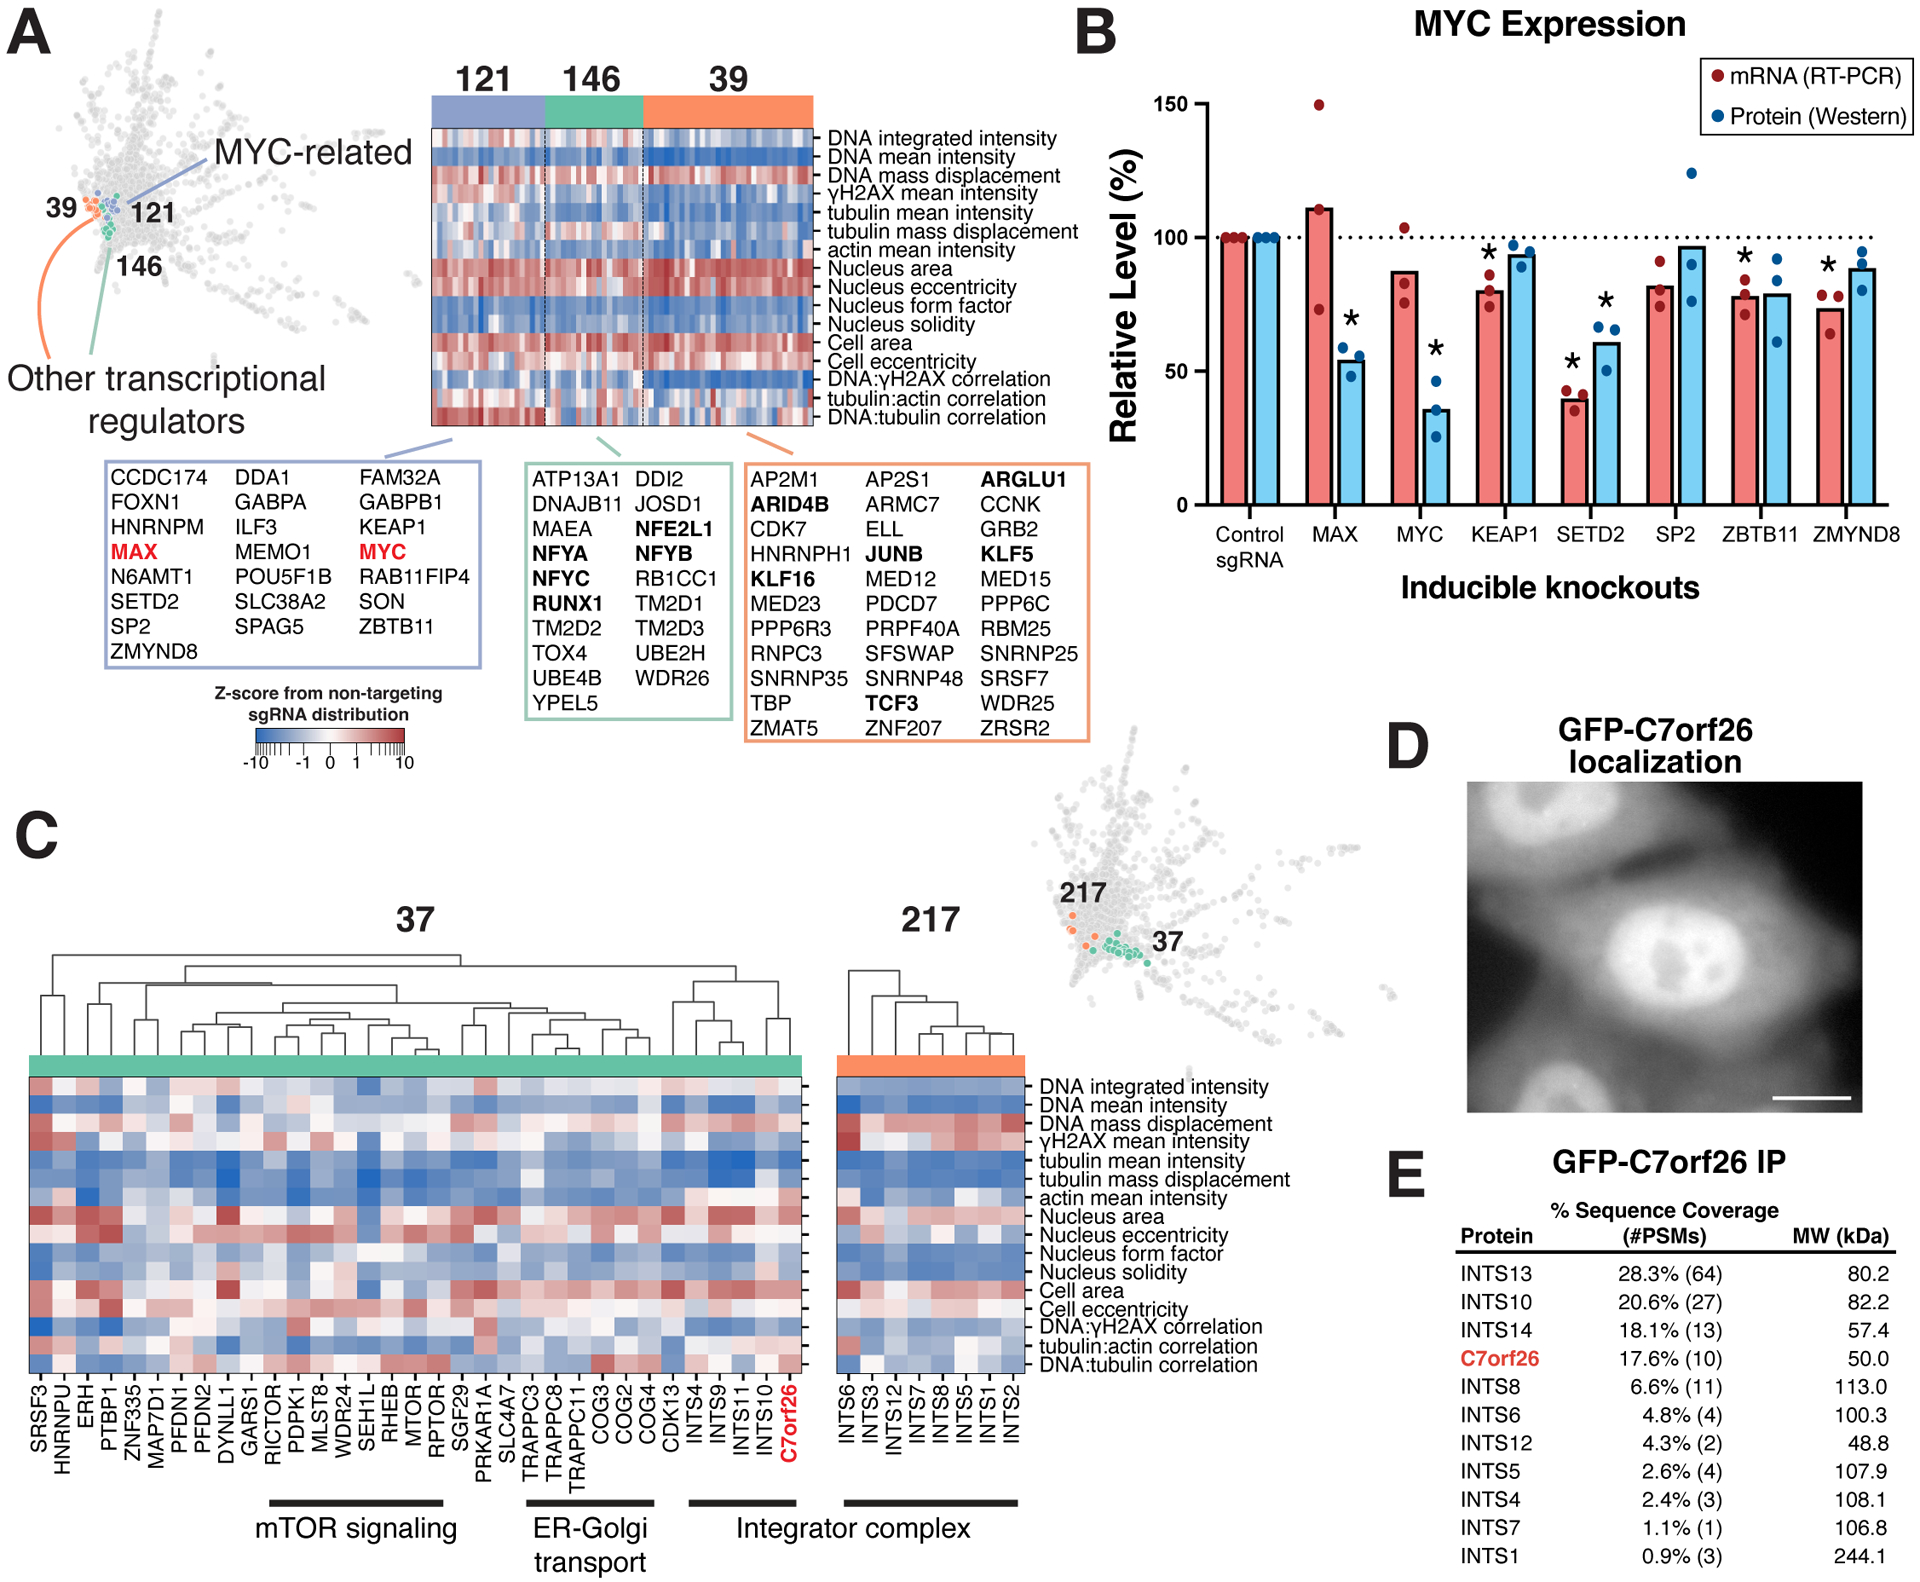
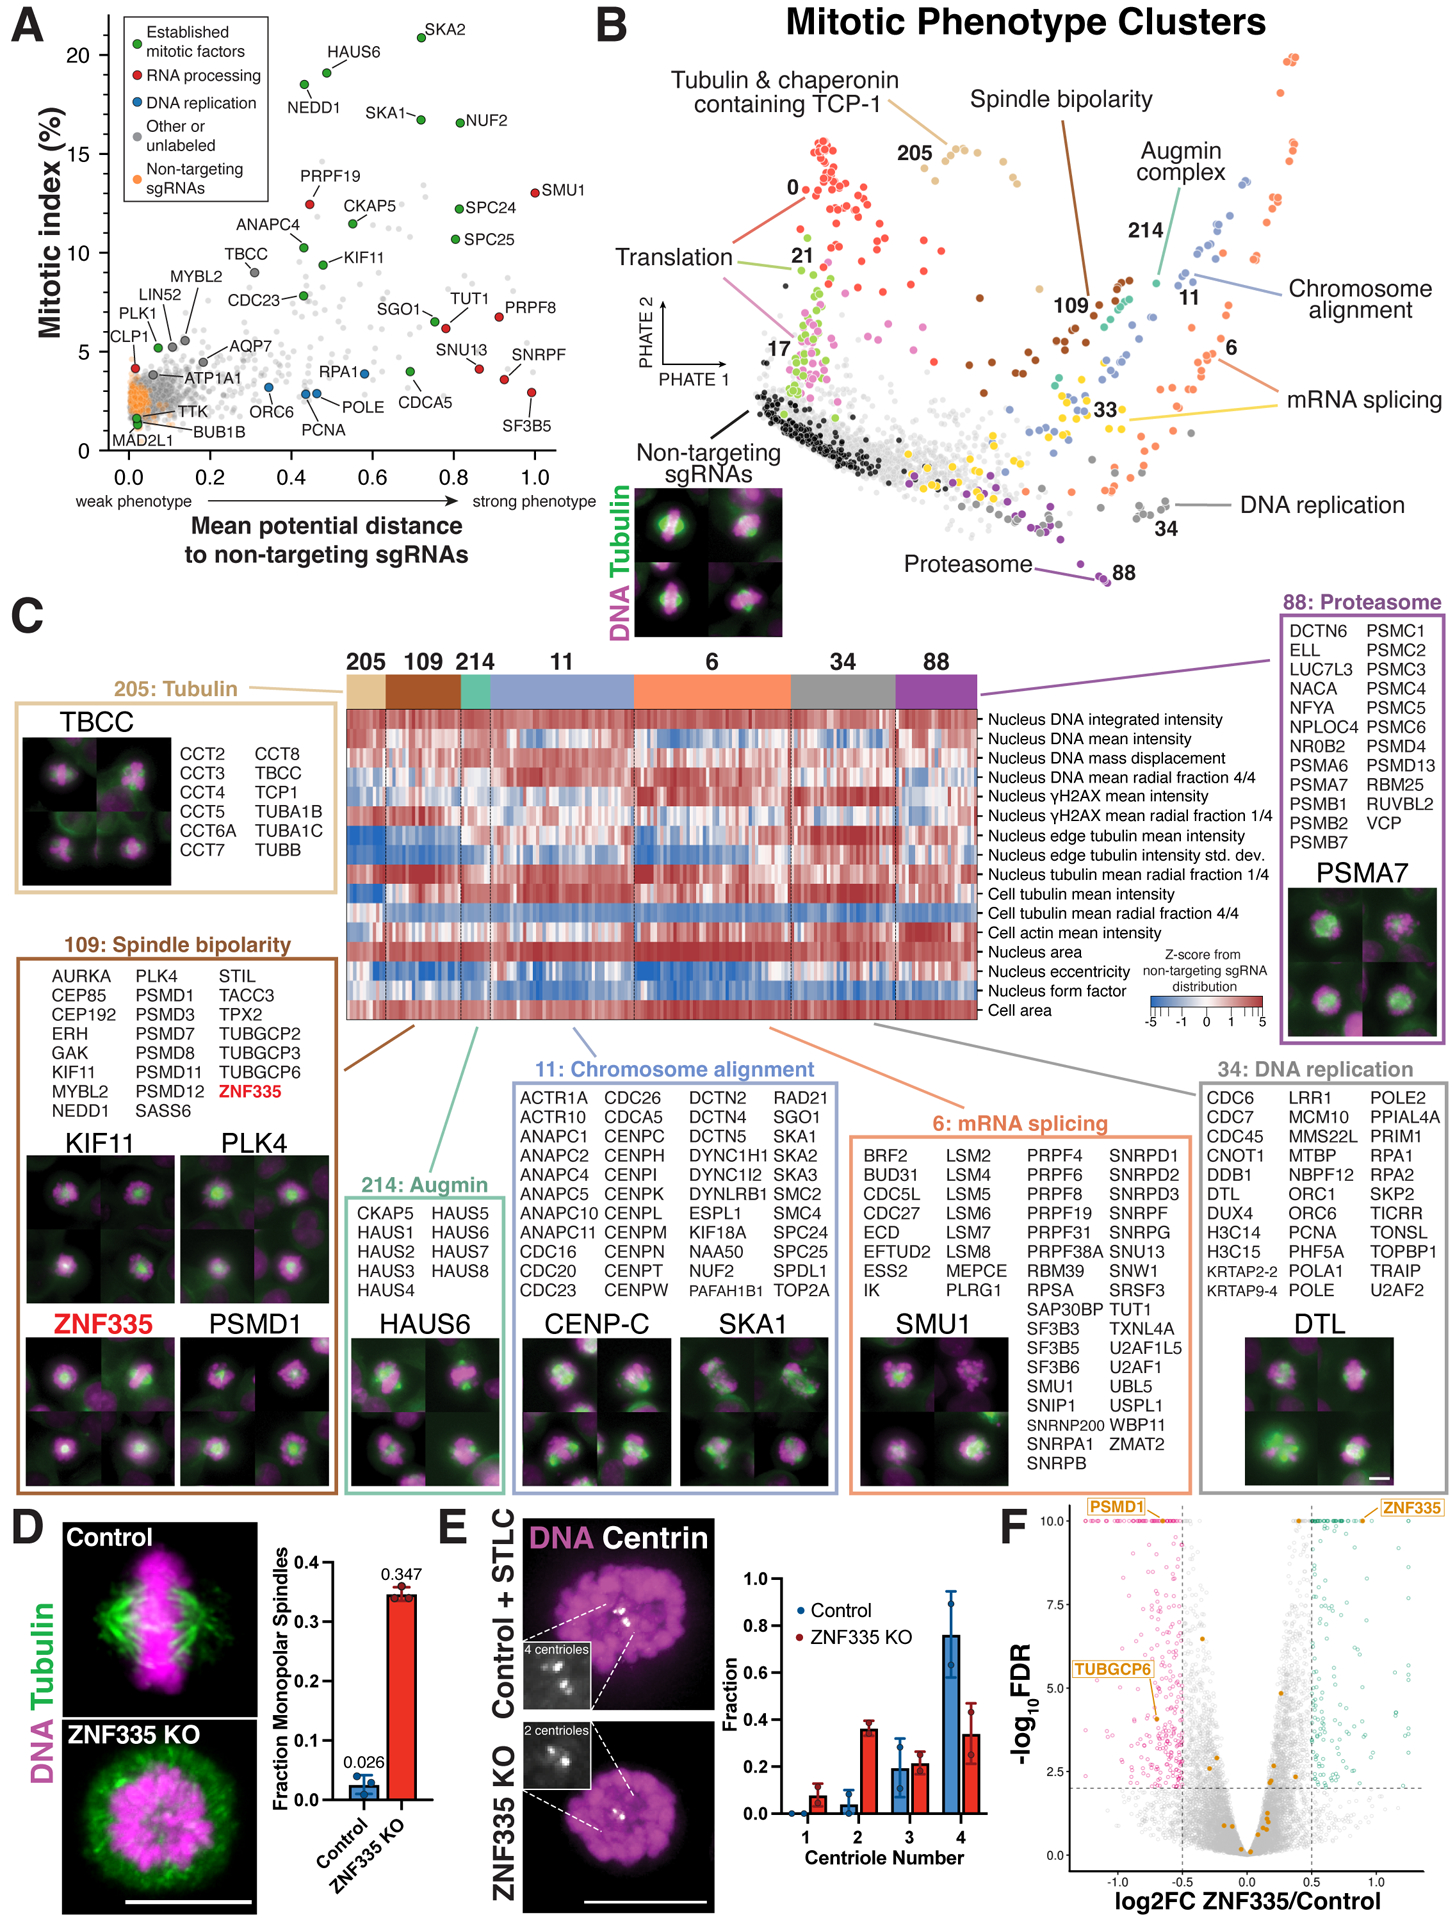
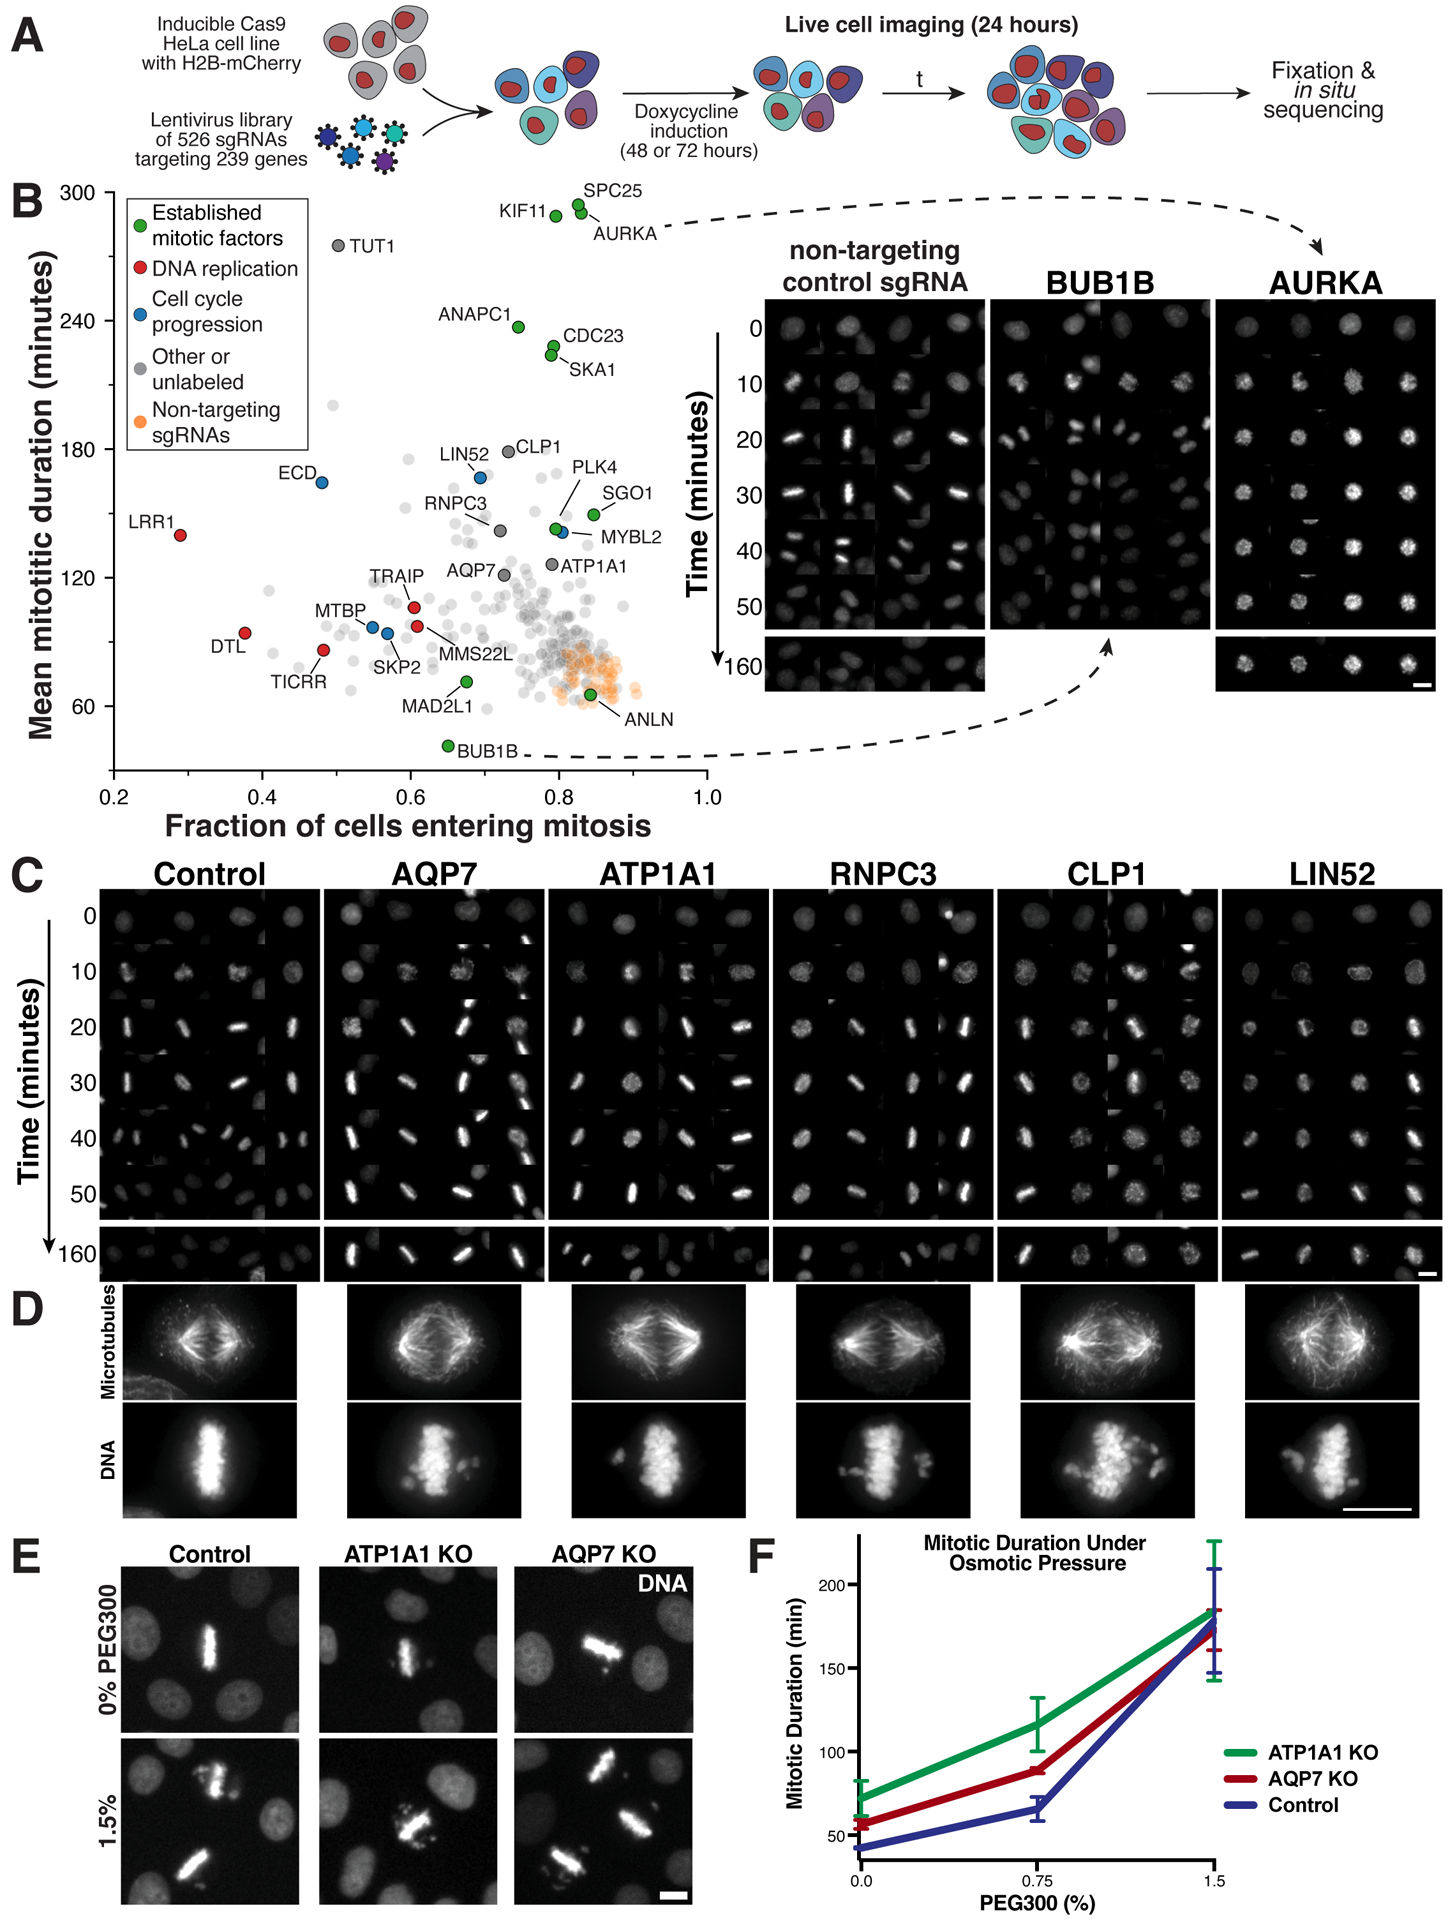
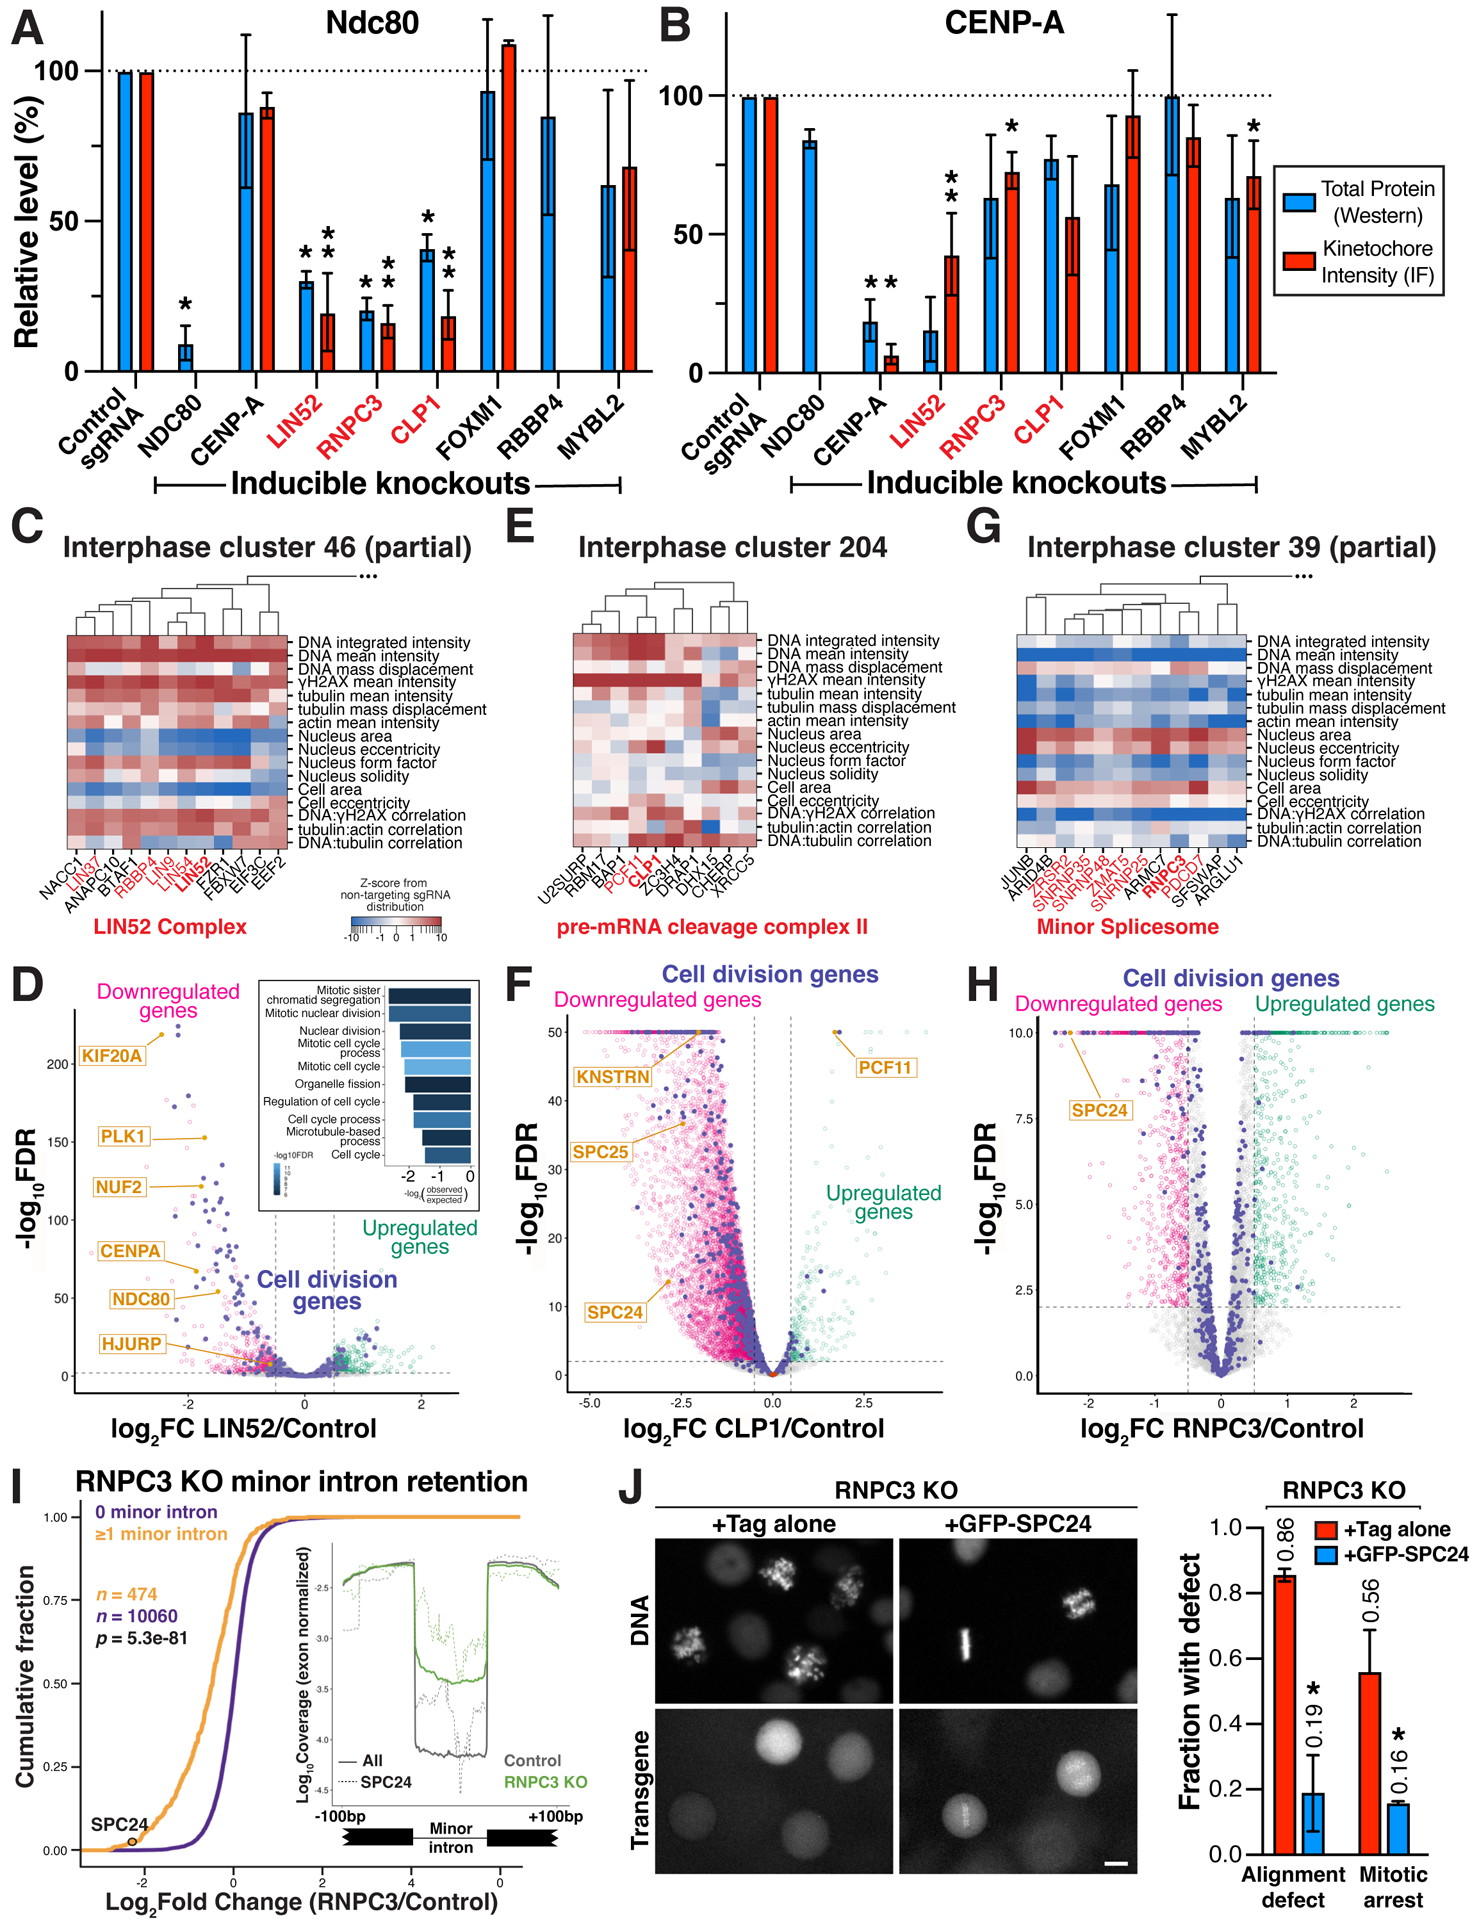
Understanding the basis for cellular growth, proliferation, and function requires determining the roles of essential genes in diverse cellular processes, including visualizing their contributions to cellular organization and morphology. Here, we combined pooled CRISPR-Cas9-based functional screening of 5,072 fitness-conferring genes in human HeLa cells with microscopy-based imaging of DNA, the DNA damage response, actin, and microtubules. Analysis of >31 million individual cells identified measurable phenotypes for >90% of gene knockouts, implicating gene targets in specific cellular processes. Clustering of phenotypic similarities based on hundreds of quantitative parameters further revealed co-functional genes across diverse cellular activities, providing predictions for gene functions and associations. By conducting pooled live-cell screening of ∼450,000 cell division events for 239 genes, we additionally identified diverse genes with functional contributions to chromosome segregation. Our work establishes a resource detailing the consequences of disrupting core cellular processes that represents the functional landscape of essential human genes.

Keywords: CRISPR-Cas9; cell division; essential genes; functional genomics; high-content screening; in situ sequencing; microscopy; mitosis; morphology; optical pooled screening.


Conflict of interest statement

Declaration of interests P.C.B. is a consultant to and/or equity holder in companies in the life sciences industries including 10X Genomics, GALT, Celsius Therapeutics, Next Generation Diagnostics, Cache DNA, Concerto Biosciences, and Stately. P.C.B.’s laboratory receives research funding from Calico Life Sciences and Merck for work related to genetic screening. The Broad Institute and MIT have filed U.S. patent applications on work described here and may seek to license the technology.

Figures

Figure 1.
Figure 1.. Large-scale image-based pooled CRISPR screen identifies essential genes with roles in genome integrity.
(A) Workflow for image-based pooled CRISPR screen (also see STAR Methods). (B) Histogram showing the number of cells analyzed for each gene target with image and single sgRNA sequence mapped. (C) Example image from the pooled screen showing the indicated stains together with fluorescent in situ sequencing (Laplacian-of-Gaussian filtered) and cell segmentation. Scale bar, 25 μm. (D) Volcano plot for mean nuclear γH2AX intensity across gene targets and selected images to highlight specific targets whose knockout results in increased (green) or decreased (magenta) γH2AX relative to random samples of cells expressing targeting sgRNAs (orange; FDR<0.05; STAR Methods). The median robust z-score is calculated relative to cells expressing non-targeting sgRNAs and is plotted on a symmetric log scale (linear between −1 and 1). Scale bar, 10 μm. (E) Volcano plot and selected images as in (D) for changes in integrated nuclear DAPI intensity relative to random samples of cells expressing non-targeting sgRNAs (STAR Methods). Scale bar, 10 μm. (F) Scatter plot comparing the relationship between DNA damage and content. Labeled genes are colored by functional category. Example images show tubulin (green) and DNA (magenta) to highlight multinucleated cells. Scale bar, 10 μm. (G) Western blot (top) and quantification (bottom) confirming the presence of increased DNA damage in individual knockout cell lines targeting either the indicated genes or a single copy locus control. Blue data points indicate independent replicates. For each sample, γH2AX intensity was referenced to its GAPDH loading control and normalized by negative control γH2AX relative intensity. Error bars indicate SD.
Figure 2.
Figure 2.. Identification of essential genes regulating cytoskeletal structures and cellular organization.
(A) Selected images and volcano plot for mean cellular F-actin (phalloidin) intensity highlighting gene targets that result in increased (green) or decreased (magenta) actin levels relative to non-targeting control cells (orange; FDR<0.05; STAR Methods). (B) Selected images and volcano plot as in (A) for mean cellular tubulin intensity. (C) Scatter plot comparing the relationship between actin and tubulin intensity highlighting targets that selectively affect one cytoskeletal element (see also Figures S3B–D). Labeled genes are colored by functional category. (D) Scatter plot comparing median cellular and nuclear area across gene targets. These morphological features are highly correlated across conditions (r = 0.96). Orthogonal regression was performed to identify targets resulting in an altered nuclear:cytoplasmic area ratio (dotted line). Labeled genes are also highlighted in the distribution of regression residuals (inset). Example images display DNA (magenta) and tubulin (green) staining for gene targets that result in altered cell and nuclear size. Scale bars, 10 μm.
Figure 3.
Figure 3.. Clustering of multi-dimensional interphase phenotypes reveals co-functional essential genes.
(A) Analysis workflow overview. 1,084 phenotype parameters were extracted from raw cell images and aggregated into profiles for each of the 5,072 genes. The relationships between profiles were visualized using PHATE and grouped by similarity using the Leiden clustering algorithm. In select cases, hierarchical sub-clustering was performed to identify gene-level phenotype similarities (STAR Methods). (B) Two-dimensional PHATE representation of the interphase phenotype gene profiles from the primary screen. Colors correspond to manually-annotated Leiden clusters containing the labeled functional gene categories. (C) Individual clusters related to translation from (B) identify fine-grained functional sub-categories of genes. Functional descriptions are based on manual annotations. (D) Heat map of interphase knockout phenotypes corresponding to the translation clusters in (C) for a manually-selected subset of phenotype parameters (STAR Methods). All genes from each cluster are listed. (E) Individual clusters of genes related to transcription from (B). (F) Heat map as in (D) corresponding to the clusters in (E) highlighting the phenotypic similarities that define each cluster of genes with transcriptional functions.
Figure 4.
Figure 4.. Phenotypic clustering relationships predict gene function.
(A) Heat map of interphase phenotypes for clusters containing transcriptional regulators (STAR Methods). (B) Western blot (see Figure S5G) and mRNA quantification of MYC mRNA and protein expression following knockout of selected genes from cluster 121. *P<0.05 by two-tailed independent T-test relative to corresponding controls. (C) Phenotype heat maps of interphase clusters 37 and 217 as in (A), demonstrating the phenotypic similarity between C7orf26 knockouts with those of Integrator complex subunits. Hierarchical clustering (top) within cluster 37 using the Pearson correlation of PCA-projected phenotype profiles (STAR Methods). (D) GFP-C7orf26 localizes to the nucleus consistent with Integrator complex function. Scale bar, 10 μm. (E) Mass spectrometry from an immunoprecipitation of GFP-C7orf26 from human cells relative to controls.
Figure 5.
Figure 5.. Mitotic phenotypes uncover essential genes required for cell division.
(A) Scatter plot of mitotic index for each gene target compared to a summary score of image-based mitotic phenotype strength computed by PHATE (STAR Methods). (B) Two-dimensional representation of the mitotic phenotype visualized using PHATE, clustered to form groups with similar phenotypes (STAR Methods). Each dot represents a single gene, colored corresponding to the indicated cluster. Functional descriptions correspond to manual annotations. (C) Selected screen images and heat map of mitotic phenotypes corresponding to the clusters in (B) for a manually-selected subset of parameters (STAR Methods). Scale bar, 10 μm. All gene targets from selected clusters are listed. (D) Left, immunofluorescence images of cell lines stably expressing a sgRNA targeting ZNF335 or control. Right, bar plot of the corresponding fraction of mitotic cells with monopolar spindles; each data point represents one experiment with >100 cells. Images are deconvolved maximum intensity projections of fixed cells stained for microtubules (anti-alpha-tubulin) and DNA (Hoechst). (E) Example images (left) of DNA (Hoechst, magenta) and Centrin (grayscale) stains of monopolar ZNF335 knockout cells along with quantification of reduced centriole numbers (right) compared to monopolar control cells generated by STLC treatment (n>88 cells per condition). Insets show magnified regions. Scale bars, 10 μm. Error bars indicate SD. (F) Volcano plot of differential gene expression in ZNF335 knockout. Yellow data points represent genes co-clustering with ZNF335 in mitotic cluster 109. 296 genes, including PSMD1 and TUBGCP6, are downregulated (magenta) and 177 genes are upregulated (green) in ZNF335 KO cells (FDR < 0.01, log2 effect size > 0.5).
Figure 6.
Figure 6.. A pooled live-cell screen identifies gene targets required for mitotic progression.
(A) Experimental workflow for the live-cell, image-based pooled CRISPR screen using a cell line expressing an H2B-mCherry fusion (STAR Methods). (B) Left, scatter plot comparing the fraction of cells that enter mitosis within the 24 hour time course and the mitotic duration of observed cell division events. Plotted values represent the mean of sgRNAs targeting the same gene. Right, example images of H2B-mCherry fluorescence at the indicated time points after mitotic entry for knockouts of established cell division components. (C) Example time course montages as in (B) demonstrating mitotic delay and mitotic defects for selected target genes. (D) Immunofluorescence images showing individual cell lines stably expressing a single sgRNA targeting the indicated genes (see also Figure S7A). Images are deconvolved maximum intensity projections of fixed cells stained for microtubules (anti-alpha-tubulin) and DNA (Hoechst). Scale bars, 10 μm. (E) Example images and (F) mitotic duration from time-lapse imaging of control, AQP7, and ATP1A1 inducible knockout cells incubated with varying PEG300 concentrations to induce hyperosmotic stress. n>50 cells per datapoint. Error bars indicate SD.
Figure 7.
Figure 7.. Lin52, Clp1 and RNPC3 functions to promote proper kinetochore assembly and chromosome segregation.
(A) Bar plot showing total protein levels (blue) and kinetochore-localized intensity (red) of the outer kinetochore microtubule-binding protein NDC80 in the indicated inducible knockout cell lines relative to a control sgRNA. N=2 biological replicates for total protein levels, which were normalized to GAPDH. N=2–10 biological replicates for kinetochore measurements, each replicate represents the median kinetochore signal from >10 cells. Both measurements were further normalized relative to controls from the same experiment. *P<0.05, **P<0.01 by two-tailed independent T-test relative to corresponding control samples. ND, no data. Error bars indicate SD. (B) Bar plot as in (A) showing total protein level (blue) and kinetochore-localized intensity for the inner kinetochore centromere-specific histone CENP-A in the indicated inducible knockout cell lines relative to a control sgRNA. Experimental design and statistical tests as in (A). (C) Phenotype heat map and hierarchical clustering for a subset of primary screen interphase cluster 46 genes (STAR Methods). (D) Volcano plot of LIN52 knockout differential expression based on RNA-seq. Genes involved in cell division processes are indicated in purple. Significance threshold FDR < 0.01, log2 effect size > 0.5 for up- (green) and down-regulated genes (magenta). Inset, GO term analysis of LIN52 downregulated genes shows a significant enrichment of mitotic genes. (E) Heat map of primary screen interphase cluster 204 phenotypes as in (C), demonstrating an association of knockout phenotypes for the pre-mRNA cleavage complex II factors CLP1 and PCF11, and the transcriptional termination factor ZC3H4. (F) Volcano plot of differential expression as in (D) following CLP1 knockout, identifying a global decrease in mRNA abundance in these cells including for SPC24 and SPC25, identified by normalizing to library spike-in control RNA (brown). (G) Heat map of a subset of primary screen interphase cluster 39 phenotypes as in (C), demonstrating tight clustering of minor spliceosome components including RNPC3. (H) Volcano plot of differential gene expression as in (D) after RNPC3 knockout, with the SPC24 outer kinetochore component significantly downregulated. (I) Cumulative distributions of mRNA fold change from RNPC3 knockout cells for transcripts containing at least 1 minor intron (orange) are significantly downregulated compared to transcripts with no minor introns (purple). Statistical significance between cumulative distributions was assessed using the Mann-Whitney U test. Inset, minor introns are retained in RNPC3 knockout cells (green), including the minor introns in SPC24 (dotted lines). (J) Left, representative images of H2B-mCherry (DNA) and transgene localization for live RNPC3 knockout cells expressing Tag only or GFP-SPC24. Right, bar plot showing fraction of mitotic RNPC3 knockout cells displaying chromosome alignment defects (n>100 cells) or arrest in mitosis (>2 hours in mitosis; n>45 cells) when expressing Tag only or GFP-SPC24. Error bars indicate SD.

Comment in

References

    1. Wang T, Wei JJ, Sabatini DM, and Lander ES (2014). Genetic Screens in Human Cells Using the CRISPR-Cas9 System. Science 343, 80–84. 10.1126/science.1246981. - DOI - PMC - PubMed
    1. Condon KJ, Orozco JM, Adelmann CH, Spinelli JB, van der Helm PW, Roberts JM, Kunchok T, and Sabatini DM (2021). Genome-wide CRISPR screens reveal multitiered mechanisms through which mTORC1 senses mitochondrial dysfunction. Proc. Natl. Acad. Sci. U. S. A 118, e2022120118. 10.1073/pnas.2022120118. - DOI - PMC - PubMed
    1. Nieuwenhuis J, Adamopoulos A, Bleijerveld OB, Mazouzi A, Stickel E, Celie P, Altelaar M, Knipscheer P, Perrakis A, Blomen VA, et al. (2017). Vasohibins encode tubulin detyrosinating activity. Science 358, 1453–1456. 10.1126/science.aao5676. - DOI - PubMed
    1. Dixit A, Parnas O, Li B, Chen J, Fulco CP, Jerby-Arnon L, Marjanovic ND, Dionne D, Burks T, Raychowdhury R, et al. (2016). Perturb-Seq: Dissecting Molecular Circuits with Scalable Single-Cell RNA Profiling of Pooled Genetic Screens. Cell 167, 1853–1866.e17. 10.1016/j.cell.2016.11.038. - DOI - PMC - PubMed
    1. Replogle JM, Saunders RA, Pogson AN, Hussmann JA, Lenail A, Guna A, Mascibroda L, Wagner EJ, Adelman K, Lithwick-Yanai G, et al. (2022). Mapping information-rich genotype-phenotype landscapes with genome-scale Perturb-seq. Cell 185, 2559–2575.e28. 10.1016/j.cell.2022.05.013. - DOI - PMC - PubMed

Publication types