. 2022 Nov 17;82(22):4262-4276.e5.
doi: 10.1016/j.molcel.2022.10.016. Epub 2022 Nov 7.

RASopathy mutations provide functional insight into the BRAF cysteine-rich domain and reveal the importance of autoinhibition in BRAF regulation

Affiliations

RASopathy mutations provide functional insight into the BRAF cysteine-rich domain and reveal the importance of autoinhibition in BRAF regulation

Russell Spencer-Smith et al. Mol Cell. .

Abstract

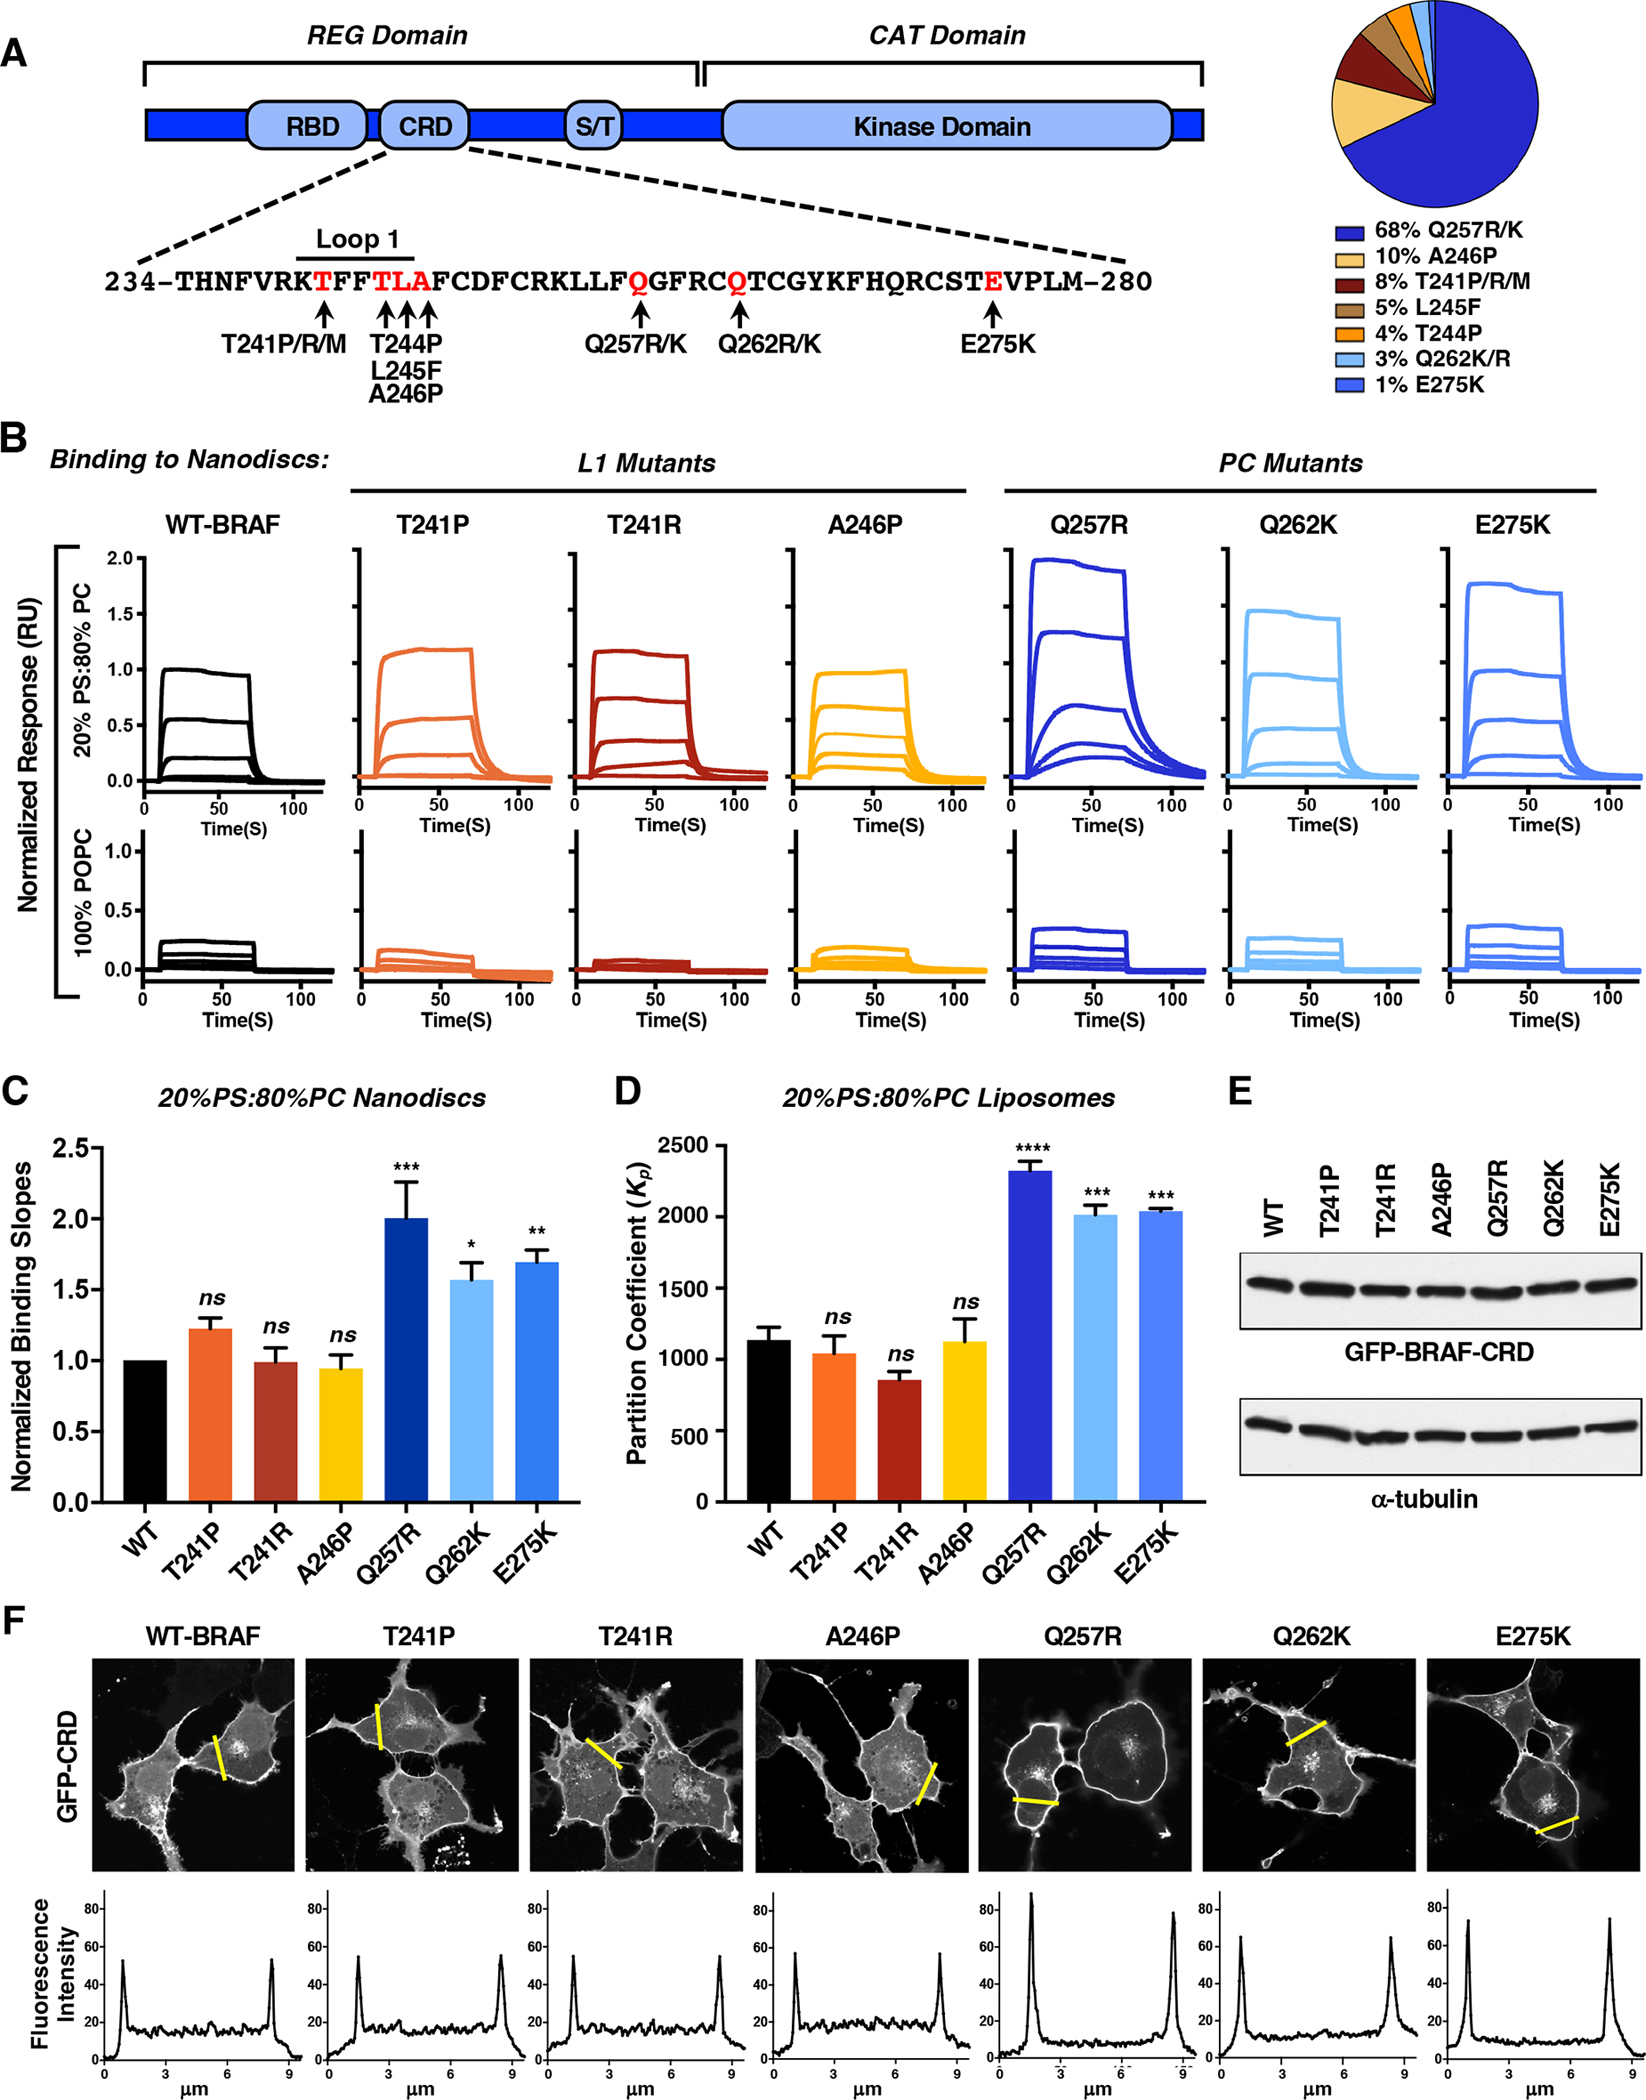
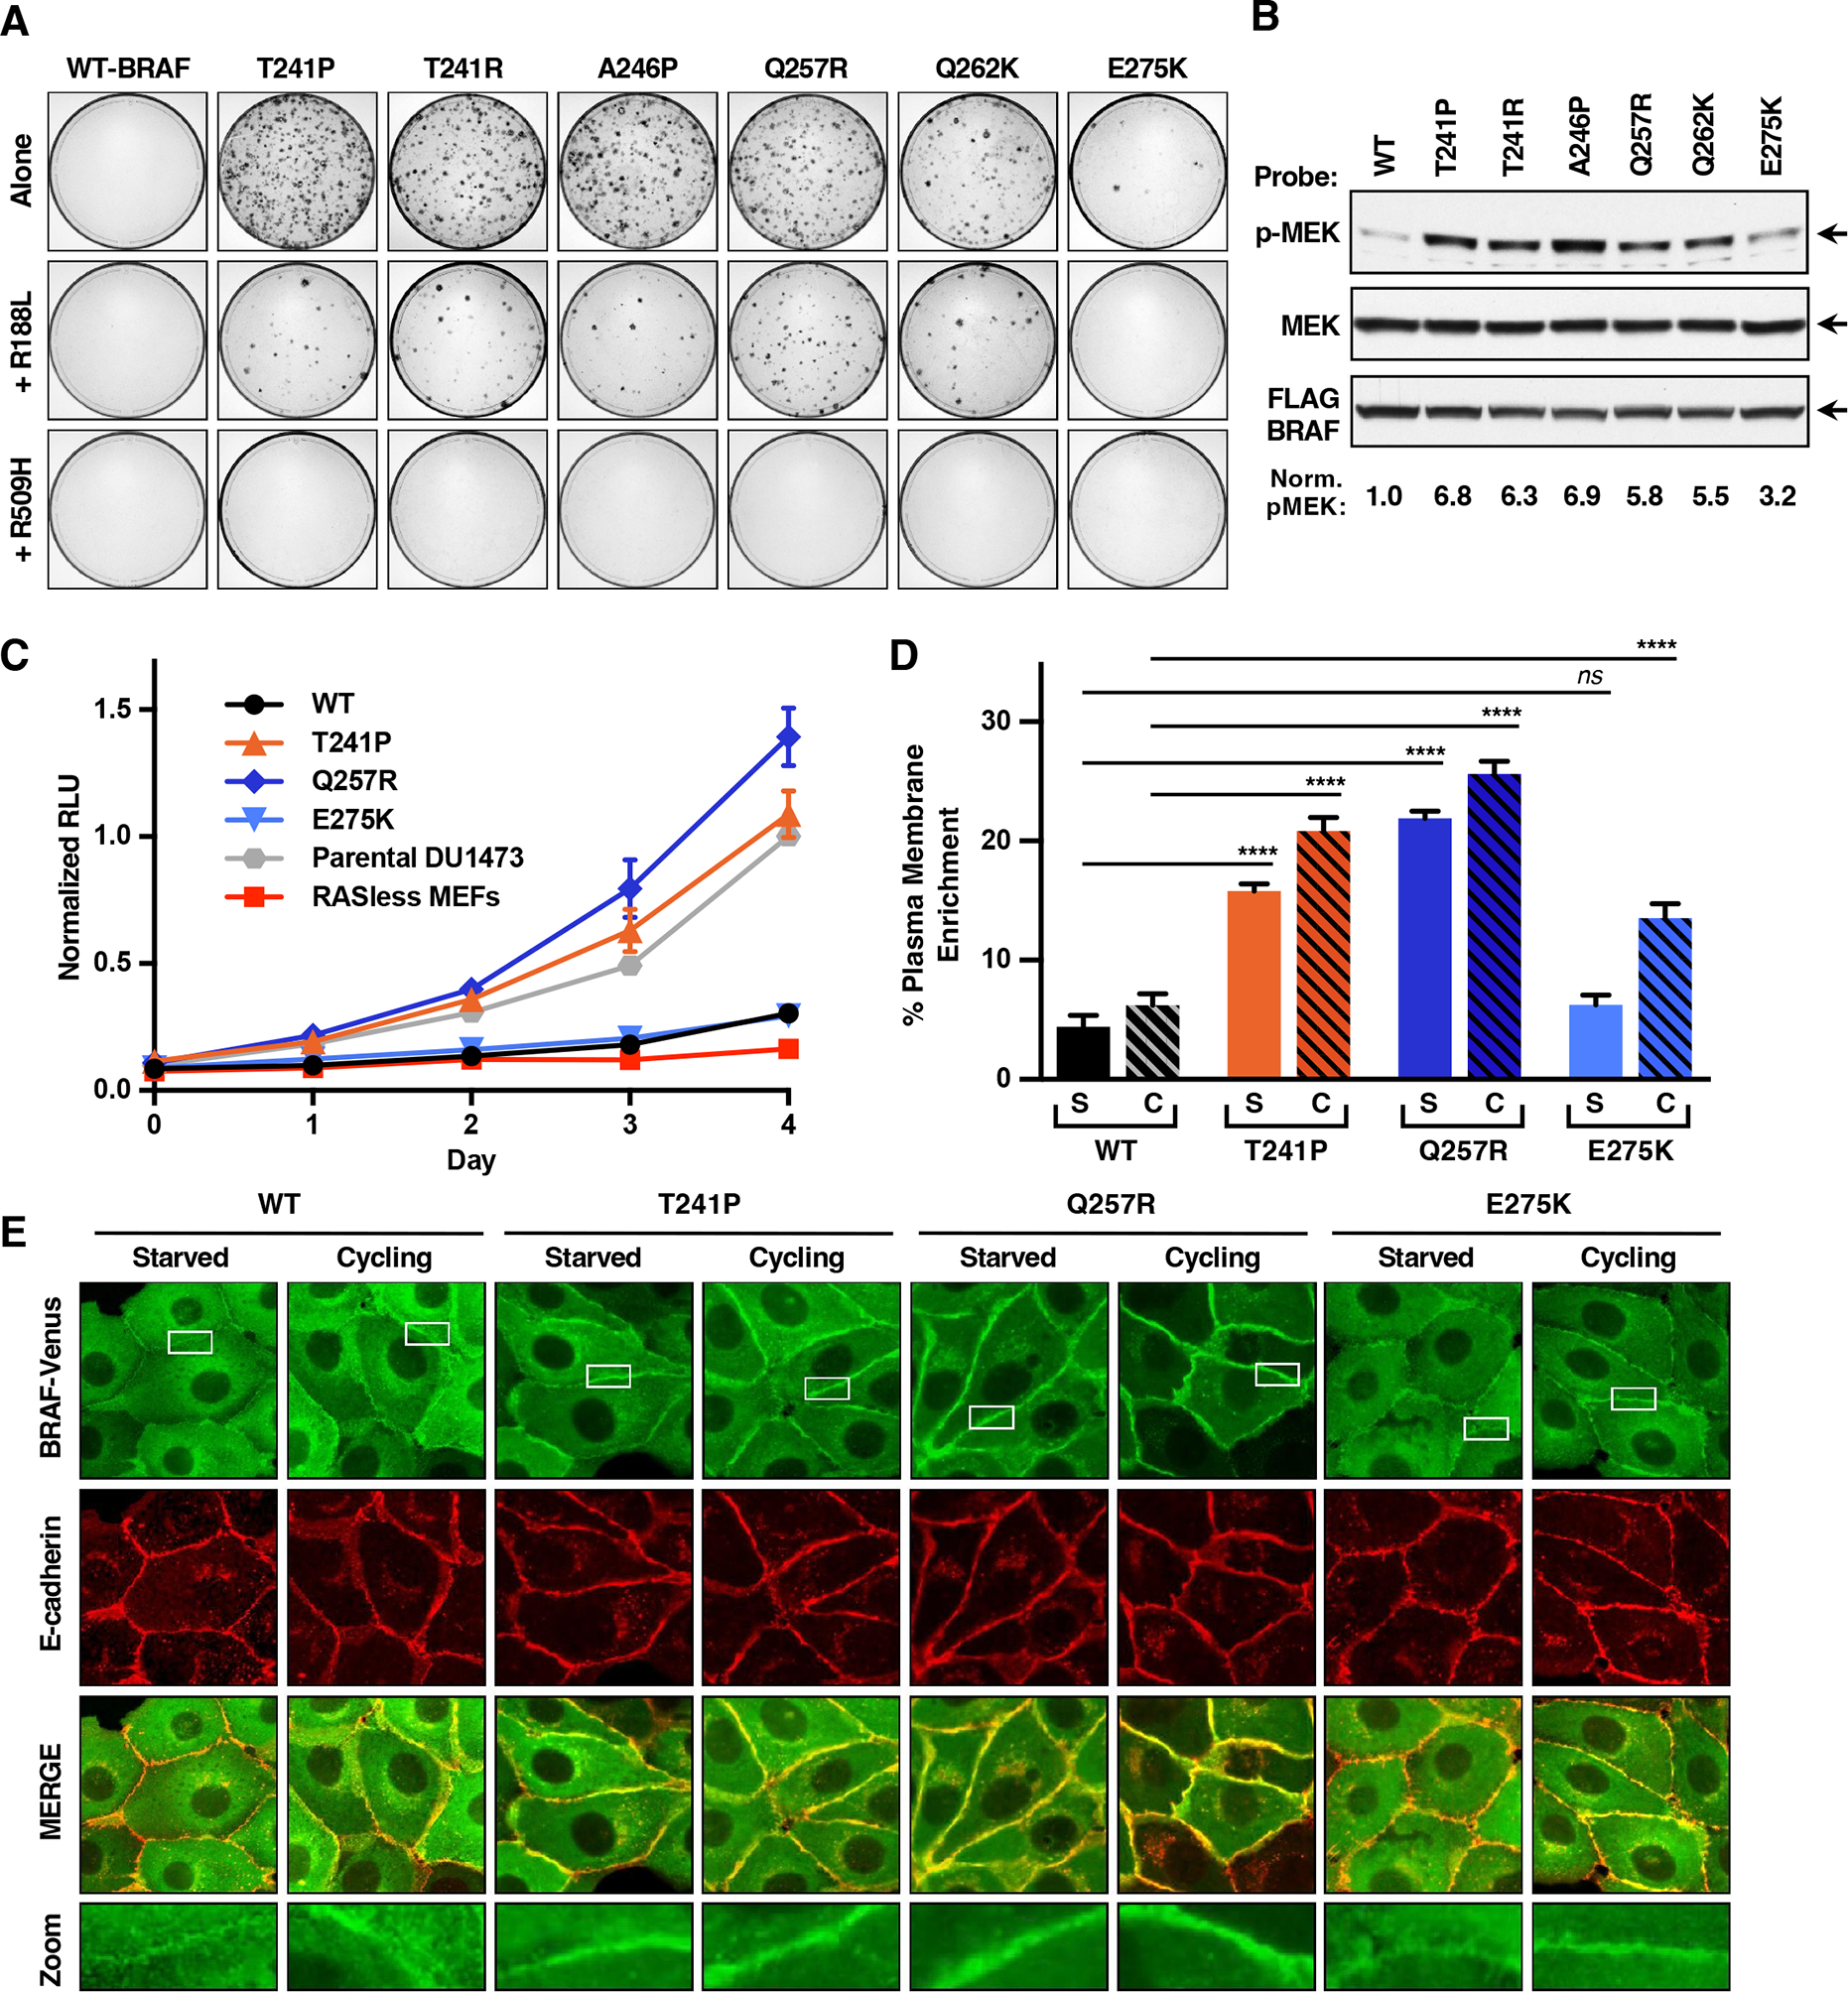
BRAF is frequently mutated in human cancer and the RASopathy syndromes, with RASopathy mutations often observed in the cysteine-rich domain (CRD). Although the CRD participates in phosphatidylserine (PS) binding, the RAS-RAF interaction, and RAF autoinhibition, the impact of these activities on RAF function in normal and disease states is not well characterized. Here, we analyze a panel of CRD mutations and show that they increase BRAF activity by relieving autoinhibition and/or enhancing PS binding, with relief of autoinhibition being the major factor determining mutation severity. Further, we show that CRD-mediated autoinhibition prevents the constitutive plasma membrane localization of BRAF that causes increased RAS-dependent and RAS-independent function. Comparison of the BRAF- and CRAF-CRDs also indicates that the BRAF-CRD is a stronger mediator of autoinhibition and PS binding, and given the increased catalytic activity of BRAF, our studies reveal a more critical role for CRD-mediated autoinhibition in BRAF regulation.

Keywords: BRAF; CRAF; CRD; RAF kinases; RAS; RASopathies; autoinhibition; cysteine-rich domain; development; phosphatidylserine.


Conflict of interest statement

Declaration of interests The authors declare no competing interests.

Figures

Figure 1.
Figure 1.. Identification of BRAF-CRD Mutations that Modulate PS Binding
(A) BRAF domain structure and amino acid sequence of the CRD. Arrows indicate the RASopathy-associated mutations (left). The percent occurrence of a particular BRAF-CRD mutation is also shown (right). Data were collected from nseuronet.com. (B) Binding responses of the BRAF-CRD variants to nanodiscs containing 20% POPS/80% POPC or 100% POPC were determined by SPR. Sensorgrams were normalized to the WT-BRAF-CRD binding response. (C) Binding slopes of the CRD mutants were normalized to that of WT-CRD (with WT equaling 1). Graph represents the mean of 3 independent experiments ± SD. (D) Partitioning coefficients for binding of the BRAF-CRDs to liposomes containing 20% POPS/80% POPC were determined, and the graph represents the mean of 3 independent experiments ± SD. (E, F) Serum-starved COS-7 cells transiently expressing the GFP-CRD variants were examined by immunoblot analysis (E) and by confocal microscopy (F). A tracing depicting the GFP intensity in the area indicated by the yellow line is shown. The images are representative of 2 independent experiments with similar results. For statistical analysis (C and D), student’s t-test (two-tailed, assuming unequal variance) was performed. ns, not significant; *, P < 0.05, P **, P < 0.01; ***, P < 0.001, and ****, P < 0.0001. See also Figure S1 and Table S1.
Figure 2.
Figure 2.. Identification of BRAF-CRD Mutations that Modulate RAF Autoinhibitory Interactions and RAS-RAF Binding in Live Cells
(A) NanoBRET interaction assay showing the BRET signal generated when increasing amounts of WT-BRAFREG-Halo were co-transfected with a constant amount of Nano-WT-BRAFCAT. Bars indicate the mean of quadruplicate wells from 3 independent assays ± SD. (B) Lysates of 293FT cells transiently expressing Nano-WT-BRAFCAT alone or with increasing amounts of WT-BRAFREG-Halo were examined by immunoblot analysis for BRAFREG, BRAFCAT, and pMEK levels. Blots are representative of 3 independent experiments with similar results. (C) NanoBRET assay measuring the interaction of WT or mutant BRAFREG-Halo proteins and Nano-WT-BRAFCAT. Also shown, is the effect of co-expressing HA-tagged KRASG12V or Nano-V600E-BRAFCAT. Data points represent BRET signals (normalized to WT set at 100) of quadruplicate wells from 3 independent assays ± SD. Student’s t-test (two-tailed, assuming unequal variance) was performed. ns, not significant and ****, P < 0.0001. Cell lysates were also examined by immunoblot analysis for BRAFREG, BRAFCAT, and HA-KRAS levels. (D) Cryo-EM structure of autoinhibited BRAF, showing the CRD (magenta), the BRAF catalytic domain (blue), and a bound 14-3-3 dimer (yellow). CRD residues mutated in the RASopathies are annotated (PDB: 6NYB). (E) BRET saturation curves examining the interaction of WT or mutant BRAFFL-RLuc8 proteins with Venus-KRASG12V. BRETmax and BRET50 values are listed ± SEM. Saturation curves were repeated 3 times with similar results. See also FigureS2 and Table S1
Figure 3.
Figure 3.. Effect of BRAF-CRD Mutations on the Signaling Activity and Plasma Membrane Localization of BRAF
(A) NIH-3T3 cells were infected with retroviruses encoding the indicated FLAG-BRAFFL proteins. Foci were visualized by methylene blue staining 3 weeks post-infection. Assays were repeated 3 times with similar results. (B) Lysates of serum-starved NIH-3T3 cells expressing the indicated FLAG-BRAFFL proteins were examined for pMEK, FLAG-BRAFFL, and total MEK levels. Blots are representative of 3 independent experiments with similar results. (C) The proliferation rate of RAS-deficient MEF lines stably expressing the indicated FLAG-BRAFFL proteins is shown. Data points represent the mean of quadruplicate wells from 2 independent experiments ± SEM. (D and E) MDCK cells stably expressing the indicated BRAFFL-Venus variants were left in growth media or serum-starved. Percent plasma membrane enrichment of BRAFFL (D) was calculated from fluorescence traces of n=20 cells ± SEM that were imaged by confocal microscopy (E). Imaging studies were repeated 3 times with similar results. See also Figure S3 and Table S1.
Figure 4.
Figure 4.. BRAF-CRD Mutants Induce Developmental Alterations in Zebrafish Embryos
(A) mRNA encoding the indicated Venus-tagged BRAF proteins were injected into one-cell stage zebrafish embryos and the embryo axes were measured at 11 hrs post-fertilization (hpf). Representative images of the embryos and expression of the BRAF-Venus proteins (green) are shown, as is the average axis ratio of embryos analyzed in 3 independent experiments ± SEM. The average axis ratio of uninjected embryos is 1 ± SEM 0.005. (B) Embryos injected as in (A) are shown 3 days post-fertilization (dpf) with normal and endemic hearts (left). The graph represents the percentage of embryos with heart edema in 3 independent experiments ± SEM (right). (C) One-cell stage embryos from the Tg (col2a1aBAC:GFP) transgenic line were injected as in (A). At 5dpf, the ceratohyal angle was determined (left, dotted red line). The graph represents the quantification of the angle of the ceratohyal from 4 independent experiments ± SEM. Average ceratohyal angle for uninjected embryos is 59° ± SEM 3°. (D) Summary of phenotypic characteristics of RASopathy patients with BRAF-CRD mutations. Data were collected from nseuronet.com and references are cited in Table S2. For statistical analysis (A-C), one-way analysis of variance (ANOVA) with Bonferroni correction was used. ns, not significant; *, P < 0.05, P **, P < 0.01; ***, P < 0.001, and ****, P < 0.0001. See also Tables S1 and S2.
Figure 5.
Figure 5.. The CRDs of BRAF and CRAF Differ in Their Abilities to Bind PS
(A) The indicated BRAF- and CRAF-CRD proteins were examined by SPR for binding to PS-containing nanodiscs. Sensorgrams were normalized to the WT-BRAF-CRD binding response. (B) Binding slopes for the CRAF-CRD and the indicated CRD mutants were normalized to the binding slope of the BRAF-CRD (with BRAF-CRD equaling 1). The graph represents the mean of 3 independent experiments ± SD. Student’s t-test (two-tailed, assuming unequal variance) was performed. ns, not significant and ***, P < 0.001. (C) Serum-starved COS-7 cells transiently expressing the indicated GFP-CRD proteins were examined by immunoblot analysis and confocal microscopy. A tracing depicting the GFP intensity in the area indicated by the yellow line is shown. The images are representative of 2 independent experiments with similar results. (D, E) Electrostatic surface representation of the BRAF-CRD (PDB: 6NYB) and CRAF-CRD (PDB: 1FAR) structures are shown, with blue and red representing positively and negatively charged areas, respectively, and key residues indicated. See also Figure S4.
Figure 6.
Figure 6.. The BRAF- and CRAF-CRDs Differ in Their Abilities to Mediate Autoinhibition
(A) NanoBRET interaction assay showing the BRET signal generated when the indicated RAFREG-Halo constructs were co-transfected with Nano-WT-BRAFCAT (left) or Nano-WT-CRAFCAT (right). Cell lysates were also examined by immunoblot analysis for RAFREG and RAFCAT proteins levels. Data points represent quadruplicate wells from 3 independent experiments ± SD. (B) BRET saturation curves examining the interaction of WT or C-CRD-BRAFFL-RLuc8 proteins with Venus-KRASG12V. BRETmax and BRET50 values are listed ± SEM. Saturation curves were repeated 3 times with similar results. (C) NIH-3T3 cells were infected with retroviruses encoding the indicated FLAG-BRAFFL variants. Foci were visualized by methylene blue staining 3 weeks post-infection. Assays were repeated 2 times with similar results. (D) NanoBRET assay measuring the interaction of WT- or mutant BRAFREG-Halo proteins and Nano-WT-BRAFCAT. Cell lysates were also examined by immunoblot analysis for BRAFREG and BRAFCAT levels. Data points represent quadruplicate wells from 3 independent experiments ± SD. Proximity of the BRAF-CRD residue T244 (magenta) and the BRAF catalytic domain residue R719 (blue) is also shown (PDB: 6NYB). For (A, D), student’s t-test (two- tailed, assuming unequal variance) was performed. ns, not significant and ****, P < 0.0001. See also Table S3.
Figure 7.
Figure 7.. Analysis of CRAF Proteins Containing Mutations Analogous to RASopathy-associated BRAF-CRD Mutations
(A) NIH-3T3 cells were infected with retroviruses encoding the indicated WT or mutant FLAG-CRAFFL proteins. Foci were visualized by methylene blue staining 3 weeks post-infection. Assays were repeated 3 times with similar results. (B) In vitro kinase assays demonstrating the increased catalytic activity of FLAG-CRAFFL containing the N-region sequence of BRAF (N-region swap) versus WT-FLAG-CRAFFL (with WT activity equaling 1). Data represent the mean of duplicate samples from 3 independent experiments ± SD. Student’s t-test (two-tailed, assuming unequal variance) was performed. ****, P < 0.0001. (C) Model comparing the properties of the BRAF- and CRAF-CRDs. See text for details.

Comment in

References

    1. Agamasu C, Ghirlando R, Taylor T, Messing S, Tran TH, Bindu L, Tonelli M, Nissley DV, McCormick F, and Stephen AG (2019). KRAS Prenylation Is Required for Bivalent Binding with Calmodulin in a Nucleotide-Independent Manner. Biophys. J. 116, 1049–1063. 10.1016/j.bpj.2019.02.004. - DOI - PMC - PubMed
    1. Askary A, Mork L, Paul S, He X, Izuhara AK, Gopalakrishnan S, Ichida JK, McMahon AP, Dabizljevic S, Dale R, et al. (2015). Iroquois Proteins Promote Skeletal Joint Formation by Maintaining Chondrocytes in an Immature State. Dev. Cell 35, 358–365. 10.1016/j.devcel.2015.10.004. - DOI - PMC - PubMed
    1. Brtva TR, Drugan JK, Ghosh S, Terrell RS, Campbell-Burk S, Bell RM, and Der CJ (1995). Two distinct Raf domains mediate interaction with Ras. J. Biol. Chem. 270, 9809–9812. 10.1074/jbc.270.17.9809. - DOI - PubMed
    1. Chong H, and Guan K-L (2003). Regulation of Raf through phosphorylation and N-terminus-C terminus interaction. J. Biol. Chem. 278, 36269–36276. - PubMed
    1. Colon-Gonzalez F, and Kazanietz MG (2006). C1 domains exposed: From diacylglycerol binding to protein-protein interactions. Biochim. Biophys. Acta. 1761, 827–837. 10.1016/j.bbalip.2006.05.001. - DOI - PubMed

Publication types