. 2022 Nov 9;12(11):151.
doi: 10.1038/s41408-022-00747-w.

The PIP4K2 inhibitor THZ-P1-2 exhibits antileukemia activity by disruption of mitochondrial homeostasis and autophagy

Affiliations

The PIP4K2 inhibitor THZ-P1-2 exhibits antileukemia activity by disruption of mitochondrial homeostasis and autophagy

Keli Lima et al. Blood Cancer J. .

Abstract

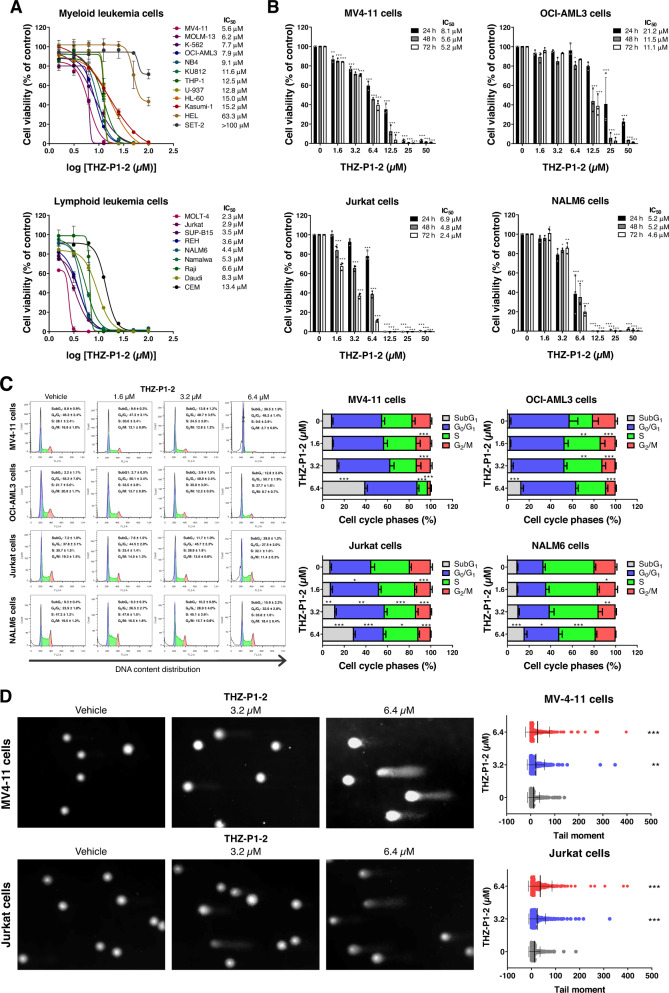
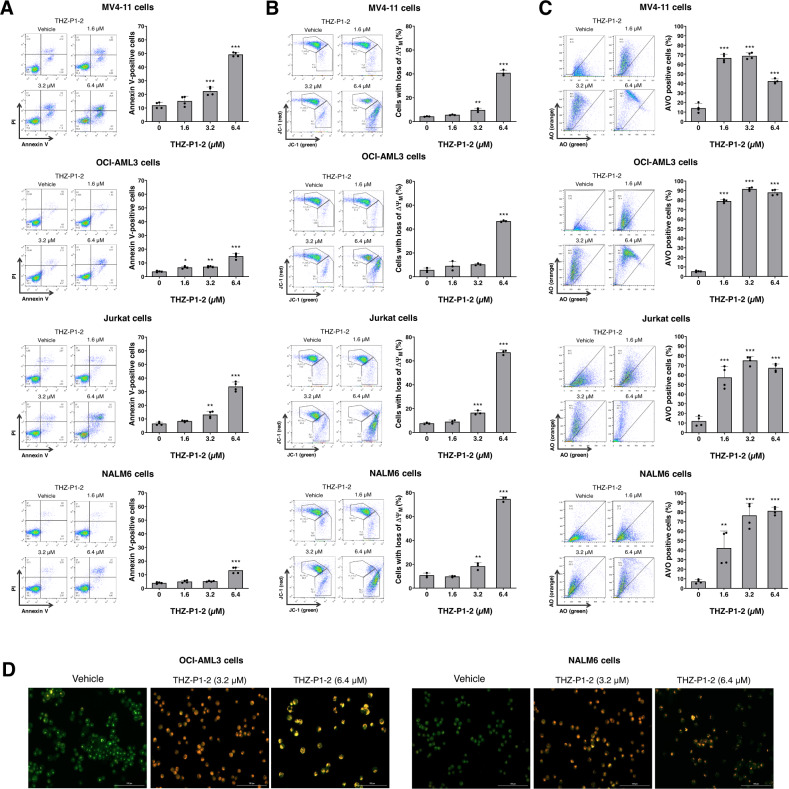
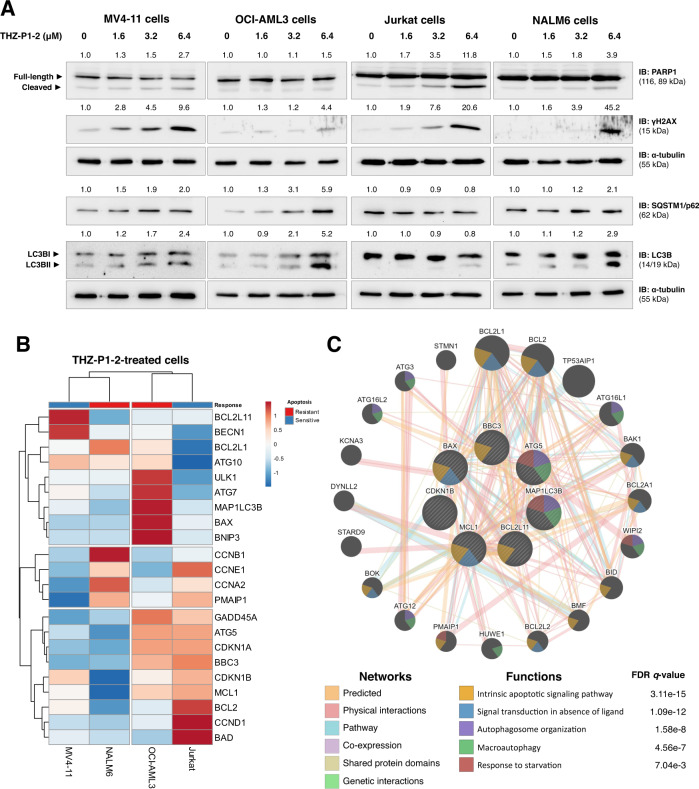
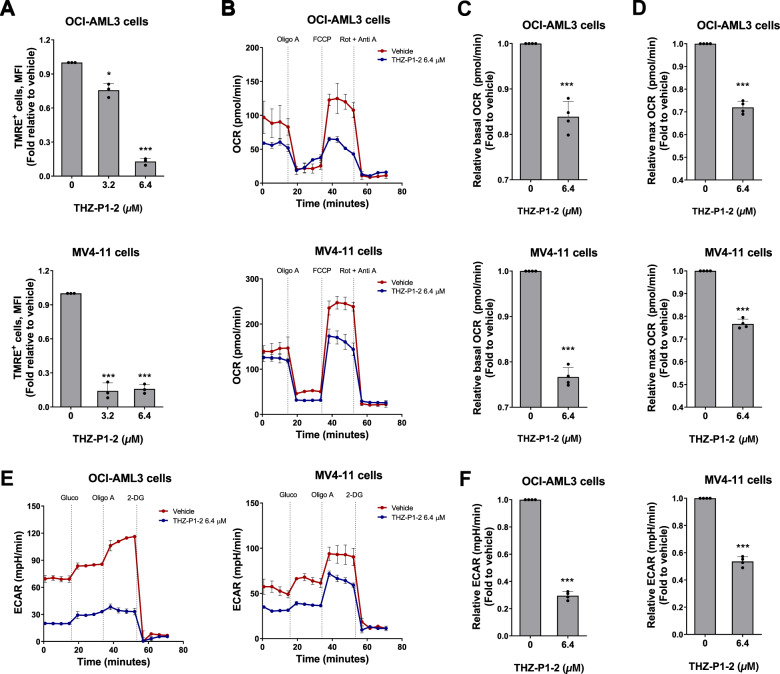
The treatment of acute leukemia is challenging because of the genetic heterogeneity between and within patients. Leukemic stem cells (LSCs) are relatively drug-resistant and frequently relapse. Their plasticity and capacity to adapt to extracellular stress, in which mitochondrial metabolism and autophagy play important roles, further complicates treatment. Genetic models of phosphatidylinositol-5-phosphate 4-kinase type 2 protein (PIP4K2s) inhibition have demonstrated the relevance of these enzymes in mitochondrial homeostasis and autophagic flux. Here, we uncovered the cellular and molecular effects of THZ-P1-2, a pan-inhibitor of PIP4K2s, in acute leukemia cells. THZ-P1-2 reduced cell viability and induced DNA damage, apoptosis, loss of mitochondrial membrane potential, and the accumulation of acidic vesicular organelles. Protein expression analysis revealed that THZ-P1-2 impaired autophagic flux. In addition, THZ-P1-2 induced cell differentiation and showed synergistic effects with venetoclax. In primary leukemia cells, LC-MS/MS-based proteome analysis revealed that sensitivity to THZ-P1-2 is associated with mitochondrial metabolism, cell cycle, cell-of-origin (hematopoietic stem cell and myeloid progenitor), and the TP53 pathway. The minimal effects of THZ-P1-2 observed in healthy CD34+ cells suggest a favorable therapeutic window. Our study provides insights into the pharmacological inhibition of PIP4K2s targeting mitochondrial homeostasis and autophagy, shedding light on a new class of drugs for acute leukemia.


Conflict of interest statement

The authors declare no competing interests.

Figures

Fig. 1
Fig. 1. Pharmacological PIP4K2s inhibition reduces cell viability and induces DNA damage in leukemia cells.
A Dose-response cytotoxicity was analyzed using a methylthiazoletetrazolium (MTT) assay in a panel of myeloid and lymphoid leukemic cell lines treated with vehicle or increasing concentrations of THZ-P1-2 (1.6, 3.2, 6.4, 12.5, 25, 50, and 100 μM) for 72 h. Values are expressed as the percentage of viable cells for each condition relative to vehicle-treated cells. The IC50 values and leukemia cell lines used are described in the figure. B Dose- and time-response cytotoxicity was evaluated by methylthiazoletetrazolium (MTT) in MV4-11, OCI-AML3, Jurkat, and NALM6 cells treated with vehicle or with increasing concentrations of THZ-P1-2 (1.6, 3.2, 6.4, 12.5, 25, and 50 μM) for 24, 48, and 72 h. Bar graphs represent values expressed as a percentage for each condition relative to vehicle-treated controls. Results are presented as the mean ± SD of at least three independent experiments. The p values and cell lines are indicated in the graphs; *p < 0.05; **p < 0.01; *** p < 0.001, ANOVA and Bonferroni post-test. C Phases of the cell cycle were determined by analyzing the DNA content by staining with propidium iodide and acquiring the data by flow cytometry following exposure of MV4-11, OCI-AML3, Jurkat, and NALM6 cells to the vehicle or THZ-P1-2 (1.6, 3.2, and 6.4 μM) for 24 h. A representative histogram for each condition is illustrated. The mean ± SD of at least three independent experiments is represented in the bar graph. The p values and cell lines are indicated in the graphs; *p < 0.05; **p < 0.01; ***p < 0.001, ANOVA and Bonferroni post-test. D DNA damage was evaluated by the single-cell comet assay in MV4-11 and Jurkat treated with vehicle or THZ-P1-2 (3.2 or 6.4 µM) for 48 h. Scatter plots represent the tail moment values (head/tail DNA ratio) obtained using the LUCIA Comet Assay™ software. **p < 0.01; ***p < 0.001, ANOVA and Bonferroni post-test.
Fig. 2
Fig. 2. THZ-P1-2 induces apoptosis and dysfunction in mitochondria and autophagic flux.
A Apoptosis was detected by flow cytometry in MV4-11, OCI-AML3, Jurkat, and NALM6 cells treated with vehicle or with increasing concentrations of THZ-P1-2 (1.6, 3.2, and 6.4 μM) for 24 h using an APC-annexin V/PI staining method. Representative dot plots are shown for each condition. The upper and lower right quadrants (Q2 plus Q3) cumulatively contain the apoptotic cell population (annexin V+ cells). Bar graphs represent the mean ± SD of at least three independent experiments. The p values and cell lines are indicated in the graphs; *p < 0.05, **p < 0.01, ***p < 0.0001; ANOVA and Bonferroni post-test. B Mitochondrial membrane potential (ΔΨM) analysis was evaluated using the JC-1 staining method and flow cytometry. Leukemic cells were treated with vehicle or THZ-P1-2 (1.6, 3.2, and 6.4 μM) for 24 h. Representative dot plots are shown for each condition; the gate FL-2 contains cells with intact mitochondria and the gate FL-2/FL-1 contains cells with damaged mitochondria. Bar graphs represent the mean ± SD of at least three independent experiments and the p values are indicated; **p < 0.01, ***p < 0.0001; ANOVA and Bonferroni post-test. C The evaluation of acidic vesicular organelles (AVOs) was investigated through acridine orange (AO) labeling and flow cytometry in AML and ALL cell lines treated with vehicle or THZ-P1-2 (1.6, 3.2, and 6.4 μM) for 24 h. Bar graphs represent the mean ± SD of at least three independent experiments and the p values are indicated; *p < 0.05, **p < 0.01, ***p < 0.001; ANOVA and Bonferroni post-test. D Alternatively, the presence of AVOs was confirmed by immunofluorescence on OCI-AML3 and NALM6 cell lines treated with vehicle or THZ-P1-2 (3.2 and 6.4 μM) for 72 h on a Lionheart FX automated microscope at magnification, ×400. The overlapping GFP and RFP channels are shown.
Fig. 3
Fig. 3. THZ-P1-2 induces markers of apoptosis, DNA damage, and blockage of autophagic flow.
A Western blot analysis for PARP1, γH2AX, p62/SQSTM1, and LC3B in total extracts from MV4-11, OCI-AML3, Jurkat, and NALM6 cells treated with vehicle or with increasing doses of THZ-P1-2 (1.6, 3.2, and 6.4 µM) for 24 h. Membranes were reincubated with α-tubulin antibody and developed with the SuperSignal™ West Dura Extended Duration Substrate system and GBox. Band intensities of cleaved-PARP1, γH2AX, p62/SQSTM1, and LC3B were corrected by α-tubulin expression and normalized by vehicle-treated cells. B Heatmap depicting the gene expression profile of leukemic cell lines treated with vehicle or THZ-P1-2 (6.4 μM) for 24 h. The blue color in the heatmap indicates decreased mRNA levels, while red indicates induced mRNA levels, which were normalized by vehicle-treated cells (n = 4). Leukemia cells that showed the lowest rates of THZ-P1-2-induced apoptosis were considered resistant. C Network for THZ-P1-2 modulated genes constructed using the GeneMANIA database (https://genemania.org/). A total of seven genes (BBC3, ATG5, MAP1LC3B, MCL1, CDKN1B, BAX, and BCL211) were significantly modulated in all cell lines tested and are illustrated as crosshatched circles; the interacting genes included by modeling the software are indicated by circles without crosshatched. The main biological interactions and associated functions are described in the literature.
Fig. 4
Fig. 4. THZ-P1-2 reduces cellular metabolism in leukemic cells.
A Mitochondrial membrane potential analysis was evaluated using the tetramethylrhodamine, ethyl ester, perchlorate (TMRE) staining method and flow cytometry. OCI-AML3 and MV4-11 cells were treated with vehicle or THZ-P1-2 (3.2, and 6.4 μM) for 24 h. Values are expressed as the fold-change of vehicle-treated cells. Bar graphs represent the mean ± SD of at least three independent experiments and the p values are indicated; *p < 0.05, ***p < 0.0001; ANOVA and Bonferroni post-test. B Oxygen consumption rate (OCR) was determined in vehicle- or THZ-P1-2-treated (6.4 μM) OCI-AML3 and MV4-11 cells using a high-resolution respirometry. A representative line graph containing OCR upon sequential addition of oligomycin (Oligo A), carbonyl cyanide-p-trifluoromethoxyphenylhydrazone (FCCP), and rotenone plus antimycin (Rot + Anti A) are illustrated; OCR was measured over time. Values are expressed as the fold-change of vehicle-treated cells. Bar graphs represent the mean ± SD of OCR at baseline (C) and maximum state (upon FCCP) (D) of at least three independent experiments. The p values and cell lines are indicated in the graphs; ***p < 0.0001; Student t-test. E Extracellular acidification rate (ECAR) was evaluated in vehicle- or THZ-P1-2-treated (6.4 μM) OCI-AML3 and MV4-11 cells by Seahorse XF96 analyzer. A representative line graph containing ECAR upon sequential addition of glucose (Gluco), oligomycin (Oligo A), and 2-deoxy-d-glucose (2-DG) is illustrated; ECAR was measured over time. F Values are expressed as the fold-change of vehicle-treated cells. Bar graphs represent the mean ± SD of at least three independent experiments. The p values and cell lines are indicated in the graphs; ***p < 0.0001; Student t-test.
Fig. 5
Fig. 5. Pharmacological PIP4K2s inhibition selectively reduces cell viability of primary leukemic blasts.
A Dose-response cytotoxicity was analyzed using a methylthiazoletetrazolium (MTT) assay in samples from acute myeloid leukemia (AML) or T- and B-acute lymphoblastic leukemia (T- or B-ALL) patients treated with vehicle or increasing concentrations of THZ-P1-2 (1.6, 3.2, 6.4, 12.5, 25, 50, and 100 μM) for 72 h. Values are expressed as the percentage of viable cells for each condition relative to vehicle-treated cells. The IC50 values for each patient sample are described. B Apoptosis was detected by flow cytometry in gated human Sca1-CD45+CD34+ (or CD117+ cells for NPM1-mutant AMLs) of acute myeloid leukemia (AML) samples in a co-culture system using a FITC-annexin V/DAPI staining method. Cells were treated with vehicle, cytarabine (AraC, 250 and 500 nM), venetoclax (VEN, 100 and 500 nM), and/or THZ-P1-2 (3.2 or 6.4 μM) for 72 h. Bar graphs represent the mean ± SD of all the independent patients screened, each point represents a patient. The p values are indicated in the graphs; *p < 0.05, **p < 0.01, ***p < 0.0001; ANOVA and Bonferroni post-test. C Correlation analysis of THZ-P1-2 response with clinical, laboratory, molecular, and metabolic characteristics of the samples. Note that THZ-P1-2 responsiveness (area under curve, AUC) was clusterized with markers of mitochondrial metabolic markers (Levels of MMP in the blasts – Blast_TMRE; Basal OCR and Max OCR). Data were processed using the Morpheus platform (https://software.broadinstitute.org/morpheus/) D Association of THZ-P1-2 sensitivity (area under the curve, AUC), mutations in FLT3, NPM1, and RUNX1, and European LeukemiaNet (ELN) risk stratification. E Evaluation of long-term proliferation in neonatal cord blood (CB) CD34+ and primary AML mononuclear cells using a co-culture system. Data were expressed as mean ± SD of at least three independent experiments. The time points and p values are indicated in the graphs; *p < 0.05, **p < 0.01, ***p < 0.0001; ANOVA and Bonferroni post-test. F Neonatal cord blood (CB) CD34+ cells were plated in cytokine-supplemented methylcellulose in the presence of vehicle or THZ-P1-2 (3.2 or 6.4 μM). Colonies were counted after 8–14 days of culture and are represented as the percent of vehicle-treated controls. Bars indicate the mean ± SD of at least three assays. G, H Mitochondrial membrane potential was detected by flow cytometry in gated human CD45+CD34+ (or CD117+ for NPM1-mutant AMLs)/annexin V from samples from acute myeloid leukemia (AML) in a co-culture system using the TMRE staining method. Cells were treated with vehicle, cytarabine (AraC, 250 nM), venetoclax (VEN, 100 or 500 nM), and/or THZ-P1-2 (3.2 [alone or in combination with VEN 100 nM] or 6.4 μM) for 72 h. Bar graphs represent the mean ± SD of at least three independent experiments, each point represents a patient. The p values are indicated in the graphs; *p < 0.05, **p < 0.01, ***p < 0.0001; ANOVA and Bonferroni post-test. I Differently expressed proteins obtained from THZ-P1-2 (THZ)-sensitive (n = 3) and THZ-resistant (n = 3) AML patients were included in the heatmap (all false discovery rate (FDR) q values (FDR q) <0.25). AML patients with higher AUC were considered resistant to THZ-P1-2. J The bar graph represents the normalized enrichment scores (NES) for Hallmark, Reactome, and Kegg gene sets with FDR q < 0.05. K GSEA plots for enriched molecular signatures in THZ-P1-2 (THZ) resistant vs. sensitive AML patient’s proteome are also shown. NES and FDR q are indicated.

References

    1. Malard F, Mohty M. Acute lymphoblastic leukaemia. Lancet. 2020;395:1146–62. doi: 10.1016/S0140-6736(19)33018-1. - DOI - PubMed
    1. Short NJ, Rytting ME, Cortes JE. Acute myeloid leukaemia. Lancet. 2018;392:593–606. doi: 10.1016/S0140-6736(18)31041-9. - DOI - PMC - PubMed
    1. Ley TJ, Miller C, Ding L, Raphael BJ, Mungall AJ, Robertson A, et al. Genomic and epigenomic landscapes of adult de novo acute myeloid leukemia. N Engl J Med. 2013;368:2059–74. doi: 10.1056/NEJMoa1301689. - DOI - PMC - PubMed
    1. Tyner JW, Tognon CE, Bottomly D, Wilmot B, Kurtz SE, Savage SL, et al. Functional genomic landscape of acute myeloid leukaemia. Nature. 2018;562:526–31. doi: 10.1038/s41586-018-0623-z. - DOI - PMC - PubMed
    1. Kayser S, Levis MJ. Updates on targeted therapies for acute myeloid leukaemia. Br J Haematol. 2022;196:316–28. doi: 10.1111/bjh.17746. - DOI - PubMed

Publication types