. 2022 Nov 8;13(11):938.
doi: 10.1038/s41419-022-05356-w.

The mycotoxin viriditoxin induces leukemia- and lymphoma-specific apoptosis by targeting mitochondrial metabolism

Affiliations

The mycotoxin viriditoxin induces leukemia- and lymphoma-specific apoptosis by targeting mitochondrial metabolism

Fabian Stuhldreier et al. Cell Death Dis. .

Abstract

Inhibition of the mitochondrial metabolism offers a promising therapeutic approach for the treatment of cancer. Here, we identify the mycotoxin viriditoxin (VDT), derived from the endophytic fungus Cladosporium cladosporioides, as an interesting candidate for leukemia and lymphoma treatment. VDT displayed a high cytotoxic potential and rapid kinetics of caspase activation in Jurkat leukemia and Ramos lymphoma cells in contrast to solid tumor cells that were affected to a much lesser extent. Most remarkably, human hematopoietic stem and progenitor cells and peripheral blood mononuclear cells derived from healthy donors were profoundly resilient to VDT-induced cytotoxicity. Likewise, the colony-forming capacity was affected only at very high concentrations, which provides a therapeutic window for cancer treatment. Intriguingly, VDT could directly activate the mitochondrial apoptosis pathway in leukemia cells in the presence of antiapoptotic Bcl-2 proteins. The mitochondrial toxicity of VDT was further confirmed by inhibition of mitochondrial respiration, breakdown of the mitochondrial membrane potential (ΔΨm), the release of mitochondrial cytochrome c, generation of reactive oxygen species (ROS), processing of the dynamin-like GTPase OPA1 and subsequent fission of mitochondria. Thus, VDT-mediated targeting of mitochondrial oxidative phosphorylation (OXPHOS) might represent a promising therapeutic approach for the treatment of leukemia and lymphoma without affecting hematopoietic stem and progenitor cells.


Conflict of interest statement

The authors declare no competing interests.

Figures

Fig. 1
Fig. 1. VDT is highly cytotoxic in leukemia and lymphoma cells in comparison to solid tumor cells.
A Structure of viriditoxin (VDT). B, C Cytotoxicity in Ramos (B; human B cell lymphoma) or Jurkat cells (C; human T cell acute lymphoblastic leukemia; T-ALL) was determined after 24 h or 72 h treatment with VDT using the AlamarBlue® viability assay. The respective IC50 values are given in parenthesis. D Ramos cells were treated with increasing VDT concentrations for 5 min, 15 min, or 24 h. In the first two treatment series, VDT was washed away at the end of the indicated incubation periods (5 or 15 min) and cells were further cultivated in medium. After 24 h upon start of the experiment, viability was determined by MTT assay. E Cytotoxicity of VDT after 24 h of incubation was determined by MTT assay in a panel of human solid tumor cell lines including 143B (osteosarcoma), HCT116 (colorectal carcinoma), HeLa (cervix carcinoma), HT29 (colon carcinoma), MCF7 (breast carcinoma), RT112 (urinary bladder carcinoma) and SH-SY5Y (neuroblastoma). F Overview of the resulting IC50 values upon VDT treatment of the individual tested cell lines after 24 h and 72 h. Upper panel: leukemia and lymphoma cell lines. In addition, to Jurkat and Ramos cells IC50 values of 6 additional human leukemic cell lines i.e., HL60 (acute myeloid leukemia; AML), HPBALL (T cell acute lymphoblastic leukemia; T-ALL), K562 (chronic myeloid leukemia; CML), KOPTK1 (T-ALL), MOLT4 (T-ALL), SUPB15 (B cell acute lymphoblastic leukemia; B-ALL) are shown. Viability assays for these leukemic cell lines are depicted in Supplementary Fig. 1. Lower panel: solid tumor cell lines. “n.d.” indicates “not done”.
Fig. 2
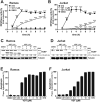
Fig. 2. VDT induces apoptosis in rapid kinetics in leukemia and lymphoma cells.
(A) Ramos or (B) Jurkat cells were treated with VDT or 2.5 µM staurosporine (STS; as a positive control for apoptosis induction) for up to 8 h. Subsequently, DEVDase activity as a surrogate marker for caspase-3 activation was determined via measurement of the fluorescence of the profluorescent caspase-3 substrate DEVD-AMC in a spectrofluorometer. The slope of the linear range of fluorescence increase served as a measure for DEVDase activity. The DMSO control values were set to 1 and the normalized relative fold induction was calculated as described in Materials and Methods. Error bars = SD of three independent experiments performed in triplicates; p-values were calculated by two-way ANOVA with the Holm–Sidak post-test; *p ≤ 0.05, ***p ≤ 0.001. (C, D) Cleavage of the caspase-3 substrate poly(ADP-ribose) polymerase 1 (PARP) as an indicator for apoptotic cell death was measured in (C) Ramos and (D) Jurkat cells after 8 h of incubation via immunoblotting. Cells were treated with the indicated concentrations of VDT (µM) or 2.5 µM STS either alone or in combination with the pan-caspase inhibitor QVD (10 µM). Solid arrowheads indicate the uncleaved p116 form of PARP; open arrowheads indicate the cleaved p85 form. Immunoblotting for tubulin was used as loading control. Numbers under PARP immunoblot indicate densitometric analyses of the ratio of unfragmented (p116) to total PARP (p116/p116 + p85). E, F Apoptosis-related DNA degradation was detected after 24 h of incubation via flow-cytometric measurement of propidium iodide stained apoptotic hypodiploid nuclei in (E) Ramos or (F) Jurkat cells.
Fig. 3
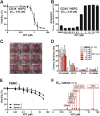
Fig. 3. VDT shows low cytotoxicity in non-transformed HSPC and PBMC and displays a therapeutic window.
A Cytotoxicity in hematopoietic stem and progenitor cells (HSPC) derived from healthy donors via apheresis and magnetic-activated cell sorting (MACS) against the stem cell marker CD34 was determined after 72 h of incubation with VDT using MTT viability assay. B HSPC from healthy donors were treated for 24 h with either increasing concentrations of VDT or 2.5 µM staurosporine (STS). Subsequently, apoptotic events were identified via flow-cytometric measurement of apoptotic hypodiploid nuclei. C HSPC were plated at low cell density in semi-solid medium MethoCult 4436 and treated with 0.1% (v/v) DMSO, viriditoxin (VDT), paclitaxel (PTX; 0.1 µM) or vinblastine (VBL; 0.1 µM) for 14 d. Thereafter, the resulting colonies were counted and differentiated under light microscope. Depicted are representative pictures. Asterisks indicate BFU-E and CFU-E colonies. D To determine the proliferation colonies were counted under light microscope after 14 days of the colony-forming unit (CFU) assay: (i) colony-forming unit-granulocyte, colony-forming unit-granulocyte/macrophage, colony-forming unit-macrophage (CFU-G/GM/M), (ii) colony-forming unit-erythroid (CFU-E), (iii) burst-forming unit-erythroid (BFU-E), and (iv) colony-forming unit-granulocyte/erythrocyte/macrophage/megakaryocyte (CFU-GEMM). E Cytotoxicity in human peripheral blood mononuclear cells (PBMC) obtained from two healthy donors was determined after 72 h of incubation with VDT using MTT viability assay. F Overview of the determined IC50 values for 72 h of incubation with VDT in human transformed cell lines (Ramos, Jurkat, HL60 (AML), HPBALL (T-ALL), K562 (CML), KOPTK1 (T-ALL), MOLT4 (T-ALL), and SUPB15 (B-ALL); for IC50 values see Fig. 1F and Supplementary Fig. 1) and untransformed cells (CD34+ HSPC IC50: 0.85 µM; PBMC IC50: > 30 µM).
Fig. 4
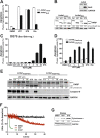
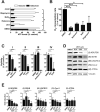
Fig. 4. VDT directly activates the mitochondrial apoptosis pathway in Bcl-2 overexpressing Jurkat cells or Bax-/Bak-deficient DG75 cells.
A VDT induces apoptosis in the presence of antiapoptotic Bcl-2. Apoptosis induction was analyzed in Jurkat cells stably transfected with vectors encoding Bcl-2 (Jurkat Bcl2; black bars) or empty vector (Jurkat vector; white bars). 5 × 104 cells were stimulated with viriditoxin (VDT; 10 µM), staurosporine (STS; 2.5 µM), etoposide (Eto; 50 µM) or diluent control (DMSO; 0.1% v/v). After 24 h, apoptosis was assessed by propidium iodide staining of apoptotic hypodiploid nuclei and flow cytometry. B Lower panel: 2 × 106 Jurkat cells transfected with empty vector (Jurkat-vector) or Bcl-2 (Jurkat-Bcl2; expression level of Bcl-2 is shown in upper panel) were treated with viriditoxin (VDT; 10 µM), staurosporine (STS; 2.5 µM), etoposide (Eto; 50 µM) or DMSO diluent control (Ctrl; 0.1% v/v). After 8 h, cellular proteins were resolved by SDS-PAGE and investigated for the proteolytic processing of PARP by immunoblotting. Solid arrowheads indicate the uncleaved form of PARP (p116); open arrowheads indicate the cleaved form (p85). Immunoblotting for glyceraldehyde 3-phosphate dehydrogenase (GAPDH) was used as loading control. Numbers under PARP immunoblot indicate densitometric analyses of the ratio of unfragmented (p116) to total PARP (p116/p116 + p85). C VDT induces apoptosis in Bax- and Bak-deficient DG75 Burkitt lymphoma cells. 5 × 104 DG75 cells were treated for 24 h with the indicated concentrations of VDT, staurosporine (STS; 2.5 µM), or diluent control (DMSO; 0.1% v/v), respectively. Subsequently, apoptosis was assessed by propidium iodide staining of apoptotic hypodiploid nuclei and flow cytometry. D, E Caspase-9 is required for VDT-induced apoptosis. D 5 × 104 caspase-9 deficient Jurkat cells transfected with empty vector (Jurkat Casp9-neg.) or untagged wild type caspase-9 (Jurkat Casp9-pos.) were treated for 24 h with the indicated concentrations of VDT, staurosporine (STS; 2.5 µM), etoposide (Eto; 50 µM) or diluent control (DMSO; 0.1% v/v), respectively. Subsequently, apoptosis was assessed by propidium iodide staining of apoptotic hypodiploid nuclei and flow cytometry. E Caspase-9 deficient (Jurkat Casp9-neg.) or capase-9 proficient Jurkat cells (Jurkat Casp9-pos.) were treated with the indicated concentrations of VDT, staurosporine (STS; 2.5 µM), etoposide (Eto; 50 µM) or DMSO diluent control (Ctrl; 0.1% v/v). After 8 h, the proteolytic processing of PARP and caspase-9 was detected by immunoblotting. Solid arrowheads indicate the uncleaved form of PARP (p116); open arrowheads indicate the cleaved form (p85). Immunoblotting for glyceraldehyde 3-phosphate dehydrogenase (GAPDH) was used as loading control. Numbers under PARP immunoblot indicate densitometric analyses of the ratio of unfragmented (p116) to total PARP (p116/p116 + p85). F Monitoring of the mitochondrial membrane potential (ΔΨm) of Ramos cells after addition of 10 µM VDT, 0.1% (v/v) DMSO (negative control), or 10 µM CCCP (mitochondrial uncoupler, positive control) by flow cytometric measurement of TMRE fluorescence. G For the detection of mitochondrial release of cytochrome c, Ramos cells (5 × 106) were treated with 0.1% DMSO (0.1% v/v), 1 µM VDT, or 2.5 µM STS for 8 h. Subsequently, cytosolic extracts were prepared by applying a digitonin lysis buffer protocol. Cytosolic cytochrome c was detected by immunoblotting. Numbers under cytochrome c immunoblot indicate densitometric analyses of the fold detection of cytochrome c relative to loading control (GAPDH).
Fig. 5
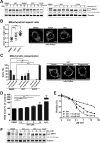
Fig. 5. VDT impairs mitochondrial structure and function.
A Left panel: The kinetics of VDT-induced OPA1 cleavage as determined by immunoblotting in Ramos cells. Co-treatment with the pan-caspase-inhibitor QVD (10 µM) was conducted to ensure independence from apoptotic signaling. Treatment with CCCP (10 µM) served as a positive control. Right panel: To study the recovery of long forms of OPA1, Ramos cells were treated for 30 min with either VDT (10 µM) or CCCP (10 µM), followed by substance removal and a recovery time of up to 6 h. Numbers under OPA1 immunoblot indicate densitometric analyses of the ratio of the long forms of OPA1 (L1, L2) to total OPA1 (L1,L2/L1,L2 + S3-5). B, C Changes in mitochondrial morphology after treatment with DMSO (0.1% v/v), VDT (10 µM), or CCCP (10 µM; positive control) for 7 h were assessed by spinning disc confocal microscopy of HeLa cells stably expressing the fluorescent dye mito-DsRed, which stains the mitochondrial matrix. B Shown are representative images. For mitochondrial aspect ratio determination, the minor axis was divided by the major axis and manually measured for 30 mitochondria of at least 20 cells per condition averaged for each cell, with individual values and mean shown. Error bars show SD, statistics: one-way ANOVA with Dunnett’s multiple comparison test. ****p ≤ 0.0001. C Mitochondrial morphology was assessed by categorizing 40 to 60 cells per condition in 2 independent experiments into tubular, intermediate, or fragmented (representative microscopy images of VDT-treated cells are shown next to the graph). The bars show the average, error bars show the range; statistics: two-way ANOVA with Dunnett’s multiple comparison test. ****p ≤ 0.0001. D VDT-induced effects on intracellular reactive oxygen species (ROS) activity as analyzed via DCF-assay. Ramos cells were loaded with the fluorogenic dye 2’,7’-dichlorodihydrofluorescein diacetate (H2DCF-DA; 20 µM) and then treated with the indicated concentrations of VDT or 1 mM H2O2 (positive control) for 6 h. Subsequently, the ROS mediated generation of fluorescent DCF was measured in a spectrophotometer. Endogenous ROS level of cells treated with DMSO (0.1% v/v) was set to 100%. Error bars = SD of three independent experiments performed in triplicates; p-values were calculated by one sample t-test; *p ≤ 0.05, **p ≤ 0.01. E Measurement of the cytotoxicity of VDT with or without co-treatment with the ROS scavenger N-acetylcysteine (NAC; 10 or 30 mM) after an incubation period of 24 h via resazurin reduction assay (AlamarBlue® assay). F Immunoblot of Ramos cells treated for 60 min with VDT (1 or 10 µM) with or without NAC pretreatment (10 or 30 mM). CCCP served as positive control for OPA1 cleavage. Numbers under OPA1 immunoblot indicate densitometric analyses of the ratio of the long forms of OPA1 (L1, L2) to total OPA1 (L1,L2 / L1,L2 + S3-5).
Fig. 6
Fig. 6. VDT impairs mitochondrial respiration.
A Measurement of the effect of VDT (10 µM) and a selection of known mitotoxins on the ATP levels of Ramos cells. Ramos cells were treated for 90 min with the indicated agents in full growth medium containing either glucose or galactose as the only available sugar. Galactose alone forces the cells to rely entirely on OXPHOS for ATP synthesis. The following complex-specific inhibitors of the respiratory chain were used: rotenone (complex I; 10 µM), sodium azide (NaN3, 1 mM; complex IV), oligomycin A (complex V; 10 µM). Subsequently, the ATP levels were measured using the luminescence-based mitochondrial ToxGlo™ assay (Promega). The depicted values were normalized to cells treated with DMSO (0.1% v/v) in glucose containing growth medium (set to 100%). Error bars = SD of three independent experiments performed in triplicates; p-values were calculated by two-way ANOVA with the Holm–Sidak post-test; *p ≤ 0.05. B Comparative measurement of the oxygen consumption rate of Ramos cells treated with VDT (10 µM) or a range of known complex-specific inhibitors of the respiratory chain (see Fig. 6A) using the MITO-ID® Extracellular O2 Sensor Kit (High Sensitivity; Enzo). The oxygen consumption rate of cells treated with 0.1% DMSO (v/v) was set to 100%. Error bars = SD of three independent experiments performed in triplicates; p-values were calculated by one sample t-test; *p ≤ 0.05, ***p ≤ 0.001. C The activities of the individual complexes of the respiratory chain were measured after treatment with VDT (10 µM) or respective complex inhibitors [complex I: 10 µM rotenone; complex II: 10 mM thenoyltrifluoroacetone (TTFA); complex III: 10 µM antimycin A; complex IV: 1 mM potassium cyanide (KCN)] for 15 min using the corresponding MitoCheck® kit (Cayman Chemical; utilizing mitochondria isolated from bovine heart). Depicted activities were normalized to cells treated with DMSO (0.1% v/v). p-values were calculated by one sample t-test; *p ≤ 0.05, ***p ≤ 0.001, ns not significant. D For each complex of the respiratory chain a subunit was selected which is unstable and degraded if the respective complex is incorrectly assembled. The following complex-specific proteins were detected by immunoblotting: NADH ubiquinone oxidoreductase subunit B8 (NDUFB8; complex I), succinate dehydrogenase subunit B (SDHB; complex II), ubiquinol-cytochrome c reductase core protein 2 (UQCRC2; complex III), cytochrome c oxidase-2 (Cox-2; complex IV), ATP synthase F1α (ATP5A; complex V). Therefore, Ramos cells were treated with nanomolar concentrations of VDT for 24 h before an immunoblot against these subunits was performed. Vinculin served as loading control. E The bar chart shows the quantification of the signal of immunoblots from Fig. 6D for the subunits of ETC complexes I - V, based on at least three independent experiments. Error bars = SD of at least three independent experiments; p-values were calculated by two-way ANOVA with the Holm–Sidak post-test; *p ≤ 0.05, **p ≤ 0.01, ***p ≤ 0.001, ns not significant.
Fig. 7
Fig. 7. Thermal proteome profiling of potential VDT target proteins and effect of the inhibition of mitochondrial and cytosolic translation on protein expression and viability.
A For mass spectrometry based thermal proteome profiling (TPP), Ramos cells were treated with 10 µM VDT or diluent control for 30 min. The statistical significance for the VDT-induced difference in protein melting behavior (expressed as the negative decadic logarithm of the adjusted NPARC p-value, -lg(adj. p, NPARC)) is plotted against the melting point difference (difference of the means of the melting points, ΔTm). Mitoribosomal proteins are shown in red within the plot. B Shown is the functional protein association network (based on the STRING database) of the top 43 proteins destabilized by VDT, selected by p-value and melting point difference. Mitochondrial proteins are labeled in blue, mitoribosomal proteins in blue/red and non-mitochondrial proteins in gray. C Ramos cells were treated with increasing concentrations of VDT. Cycloheximide (CHX; 1 µM) was used as inhibitor of cytosolic protein translation and chloramphenicol (CAP; 150 µM) and tigecycline (TIG; 10 µM) as inhibitors of mitochondrial translation. To prevent caspase-mediated protein degradation the pan-caspase inhibitor QVD (10 µM) was added before application of cycloheximide (CHX; 1 µM), chloramphenicol (CAP; 150 µM), tigecycline (TIG; 10 µM) or viriditoxin (VDT; 3 µM; right lane). After 36 h immunoblotting against cytochrome c oxidase 2 and 4 (Cox-2 and Cox-4) was performed. Cox-2 is translated within the mitochondria whereas Cox-4 is translated in the cytosol. Immunoblotting for vinculin was used as loading control. Numbers under Cox-2 and Cox-4 immunoblots indicate densitometric analyses of the fold induction of Cox-2/-4 relative to loading control (vinculin). D Ramos cells were treated with increasing concentrations of VDT, cycloheximide (CHX), chloramphenicol (CAP), or tigecycline (TIG) for 36 h and 48 h, respectively. Subsequently, cell viability was monitored by AlamarBlue® assay. Mean ± SD values of triplicates are shown. Respective IC50 values are given in parenthesis.

Similar articles

Cited by

References

    1. Liberti MV, Locasale JW. The Warburg effect: how does it benefit cancer cells? Trends Biochem Sci. 2016;41:211–8. - PMC - PubMed
    1. Hay N. Reprogramming glucose metabolism in cancer: can it be exploited for cancer therapy? Nat Rev Cancer. 2016;16:635–49. - PMC - PubMed
    1. Pavlova NN, Thompson CB. The emerging hallmarks of cancer metabolism. Cell Metab. 2016;23:27–47. - PMC - PubMed
    1. Dong L, Gopalan V, Holland O, Neuzil J. Mitocans revisited: mitochondrial targeting as efficient anti-cancer therapy. Int J Mol Sci. 2020;21:7941–61. - PMC - PubMed
    1. Bosc C, Selak MA, Sarry JE. Resistance is futile: targeting mitochondrial energetics and metabolism to overcome drug resistance in cancer treatment. Cell Metab. 2017;26:705–7. - PubMed

Publication types