. 2022 Nov 8;13(1):6733.
doi: 10.1038/s41467-022-34526-9.

T cell responses at diagnosis of amyotrophic lateral sclerosis predict disease progression

Affiliations

T cell responses at diagnosis of amyotrophic lateral sclerosis predict disease progression

Solmaz Yazdani et al. Nat Commun. .

Abstract

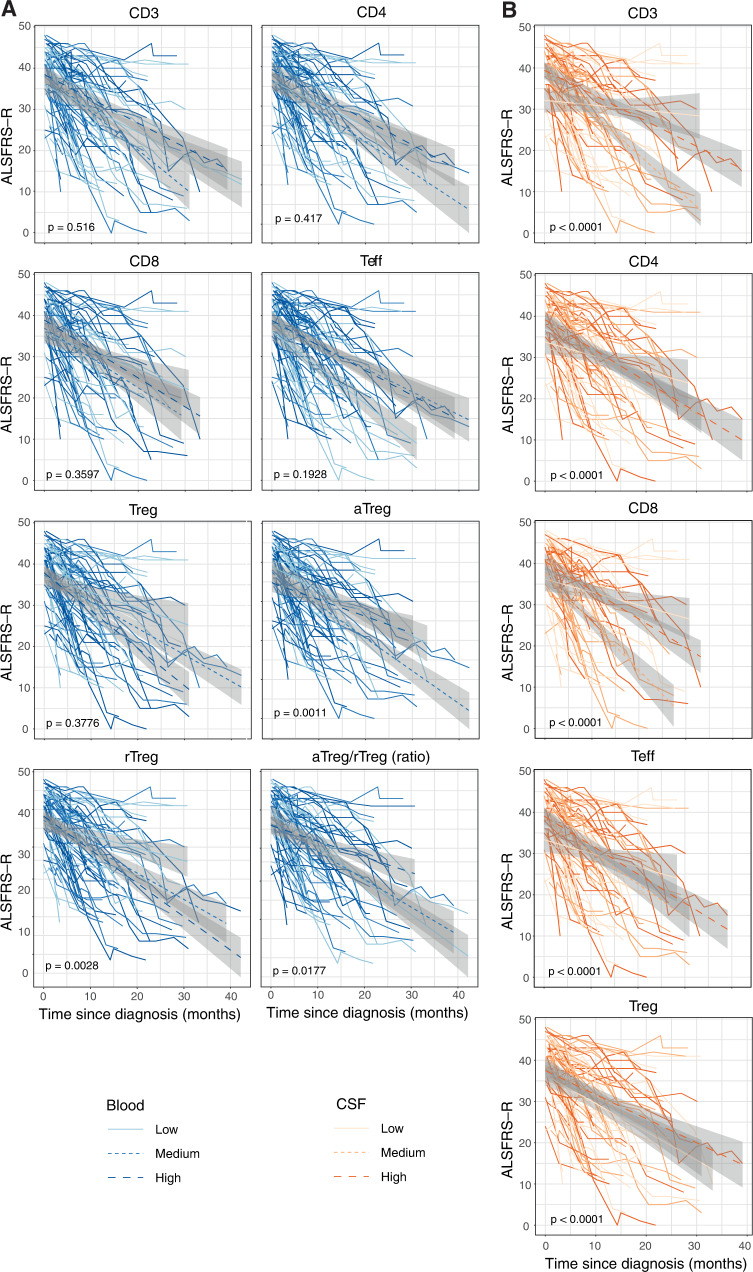
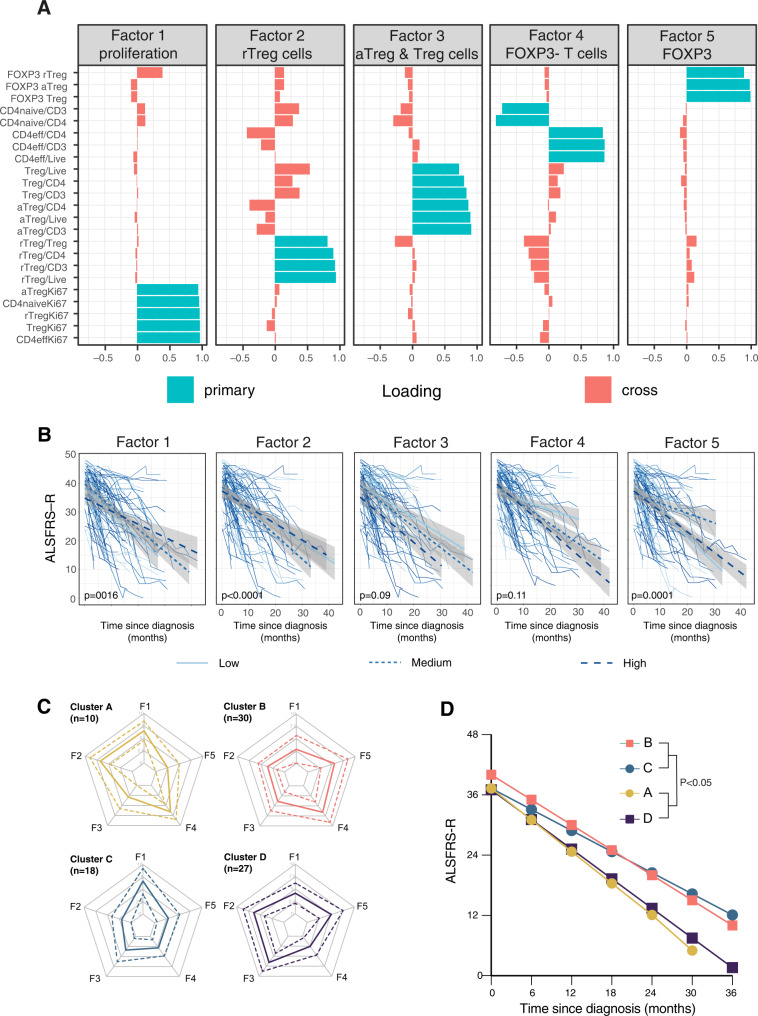
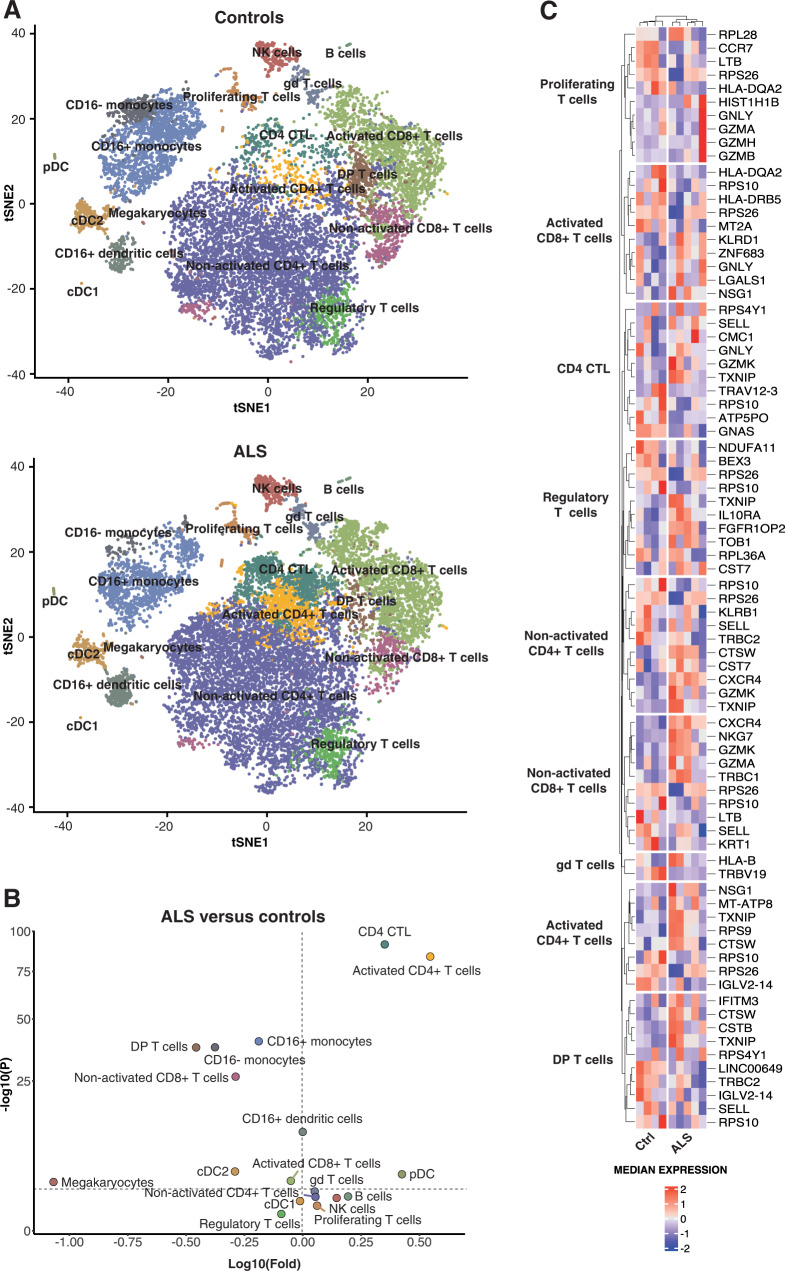
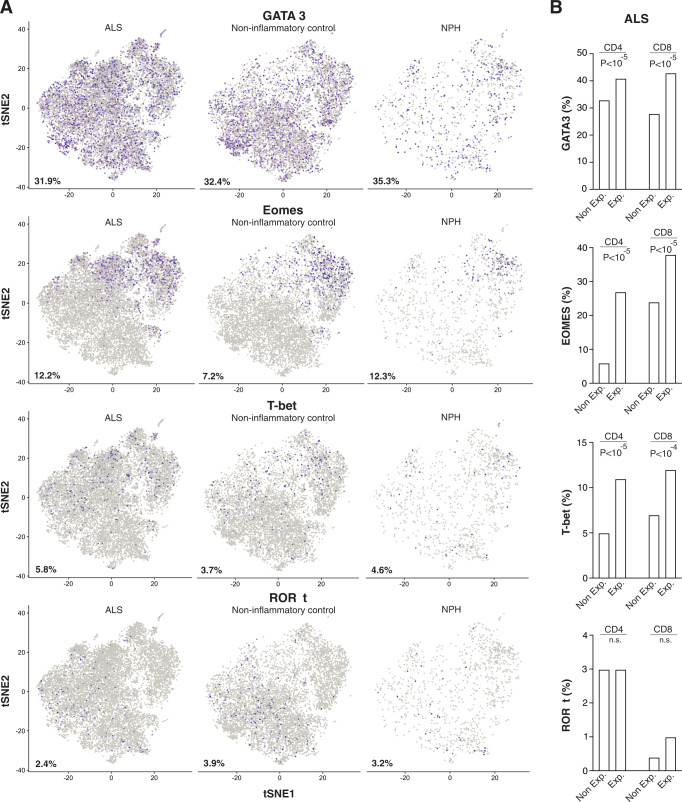
Amyotrophic lateral sclerosis (ALS) is a fatal neurodegenerative disease, involving neuroinflammation and T cell infiltration in the central nervous system. However, the contribution of T cell responses to the pathology of the disease is not fully understood. Here we show, by flow cytometric analysis of blood and cerebrospinal fluid (CSF) samples of a cohort of 89 newly diagnosed ALS patients in Stockholm, Sweden, that T cell phenotypes at the time of diagnosis are good predictors of disease outcome. High frequency of CD4+FOXP3- effector T cells in blood and CSF is associated with poor survival, whereas high frequency of activated regulatory T (Treg) cells and high ratio between activated and resting Treg cells in blood are associated with better survival. Besides survival, phenotypic profiling of T cells could also predict disease progression rate. Single cell transcriptomics analysis of CSF samples shows clonally expanded CD4+ and CD8+ T cells in CSF, with characteristic gene expression patterns. In summary, T cell responses associate with and likely contribute to disease progression in ALS, supporting modulation of adaptive immunity as a viable therapeutic option.


Conflict of interest statement

The authors declare no competing interests.

Figures

Fig. 1
Fig. 1. Progression rate of newly diagnosed ALS patients.
ALS patients were stratified by the proportion of T cell subsets in the blood (A) and cerebrospinal fluid (B) at the time of diagnosis. The longitudinal evolution of ALS functional rating scale-revised (ALSFRS-R) in relation to the baseline categories of T cell subsets is plotted with 95% confidence intervals. The p value is of the interaction term of time and T cell subset category from the linear mixed model fitted without adjustments.
Fig. 2
Fig. 2. Distinct T cell profiles are associated with differential ALS disease progression.
Exploratory factor analysis was used to reduce the flow cytometric data into summary variables and resulted in five factors that explained 89.5% of the total variance (A). ALS patients were stratified by the factors. Longitudinal changes in the ALS functional rating scale-revised (ALSFRS-R) in blood were analysed using linear mixed models with mean and 95% confidence intervals for each category of factors. B Cluster analysis was used to identify patients with similar factor profiles and resulted in four clusters. Standardized and centered parallel profile plots of the individual patients’ factor scores are colored according to cluster membership (C). Disease progression in the different clusters was analysed using a linear mixed model (D).
Fig. 3
Fig. 3. Differential cell composition and gene expression in CSF of ALS patients versus controls.
t-SNE plots of 10X scRNA-seq data showing leukocyte subsets from five ALS patients and four controls (A). A pairwise comparison of ALS and controls in terms of cell count abundance for every cell type was performed using a two-sided proportions z-test (horizontal dotted lines correspond to P = 0.05) which was followed by Yate’s continuity correction. Correction for multiple testing was done using Benjamini–Hochberg (BH) correction (B). Heat map illustrating the top-up to five most up- and down-regulated genes in different T cell subsets in ALS patients (N = 5) versus controls (N = 4) (C).
Fig. 4
Fig. 4. Clonal expansion of CD4+ T cell subsets in ALS.
t-SNE plots of 10X scRNA-seq data showing T cell subsets and contour plots outlining TCR expansions identified using 10X VDJ scRNA-seq in five ALS patients, two non-inflammatory controls, and two normal pressure hydrocephalus (NPH) controls individuals (A). Quantification of TCR expansion from 10X VDJ scRNA-seq from ALS patients and controls (B) with significance displayed in ascending order (C). For each cell type, p values were calculated using Pearson’s Chi-squared test and Monte Carlo simulation with 2000 replicates.
Fig. 5
Fig. 5. Distinct expression of lineage-defining transcription factors among clonally expanded T cells in CSF of ALS patients.
t-SNE plots of 10X scRNA-seq data showing expression of GATA3, Eomesodermin, Tbet, and RORγt with the percentage of positive cells (shown in purple) noted (A). Quantification of GATA3, Eomesodermin, Tbet, and RORγt expressing cells among expanded (>5 identical TCR sequences) and non-expanded (≤5 identical TCR sequences) T cells. The p values were calculated using the chi-squared test (B).

References

    1. Brown RH, Al-Chalabi A. Amyotrophic lateral sclerosis. N. Engl. J. Med. 2017;377:162–172. doi: 10.1056/NEJMra1603471. - DOI - PubMed
    1. Thonhoff JR, Simpson EP, Appel SH. Neuroinflammatory mechanisms in amyotrophic lateral sclerosis pathogenesis. Curr. Opin. Neurol. 2018;31:635–639. doi: 10.1097/WCO.0000000000000599. - DOI - PubMed
    1. Liu, Z. et al. Peripheral and central nervous system immune response crosstalk in amyotrophic lateral sclerosis. Front. Neurosci. 14, 575 (2020). - PMC - PubMed
    1. Engelhardt JI, Tajti J, Appel SH. Lymphocytic infiltrates in the spinal cord in amyotrophic lateral sclerosis. Arch. Neurol. 1993;50:30–36. doi: 10.1001/archneur.1993.00540010026013. - DOI - PubMed
    1. McCombe PA, Henderson RD. The role of immune and inflammatory mechanisms in ALS. Curr. Mol. Med. 2011;11:246–254. doi: 10.2174/156652411795243450. - DOI - PMC - PubMed

Publication types

MeSH terms