. 2022 Nov 8;13(1):6740.
doi: 10.1038/s41467-022-34495-z.

Single cell sequencing reveals that CD39 inhibition mediates changes to the tumor microenvironment

Affiliations

Single cell sequencing reveals that CD39 inhibition mediates changes to the tumor microenvironment

Lilong Liu et al. Nat Commun. .

Abstract

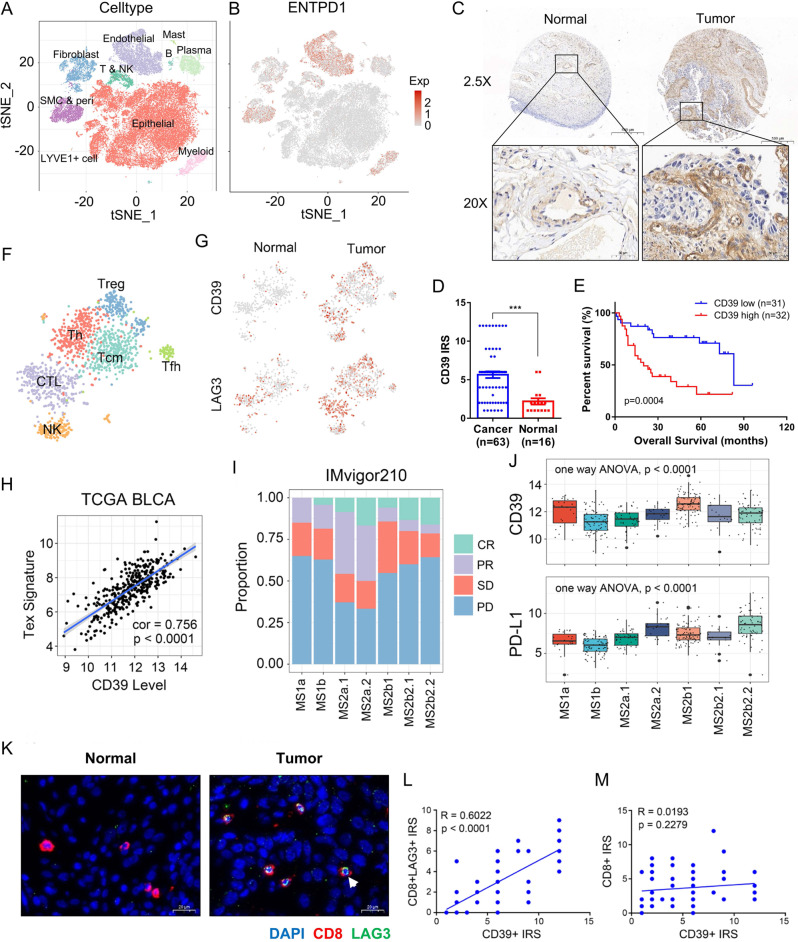
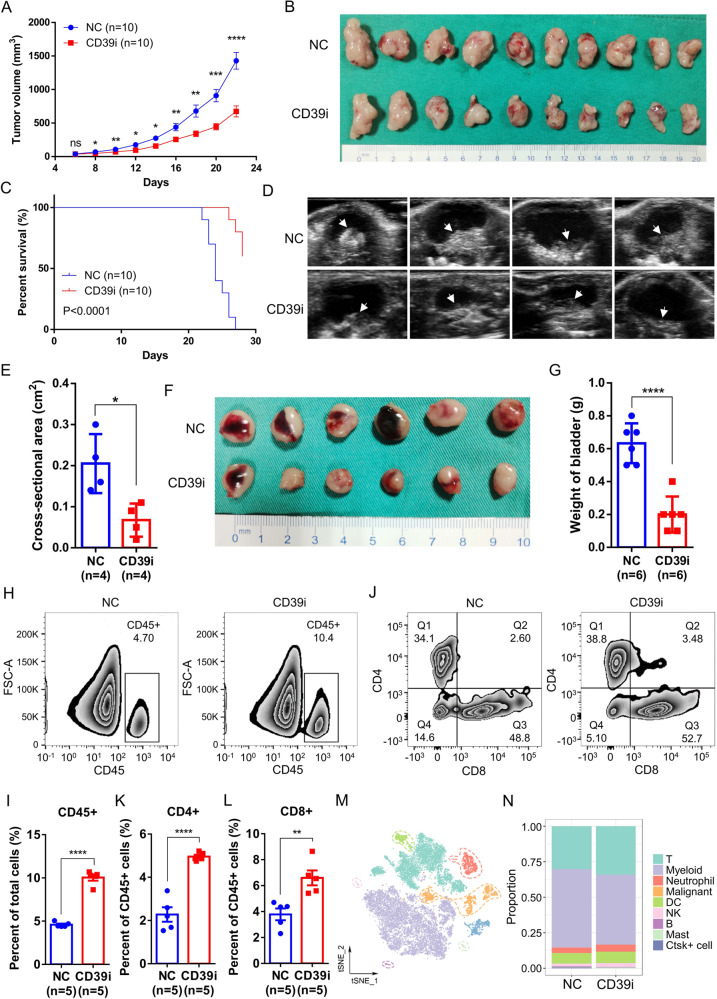
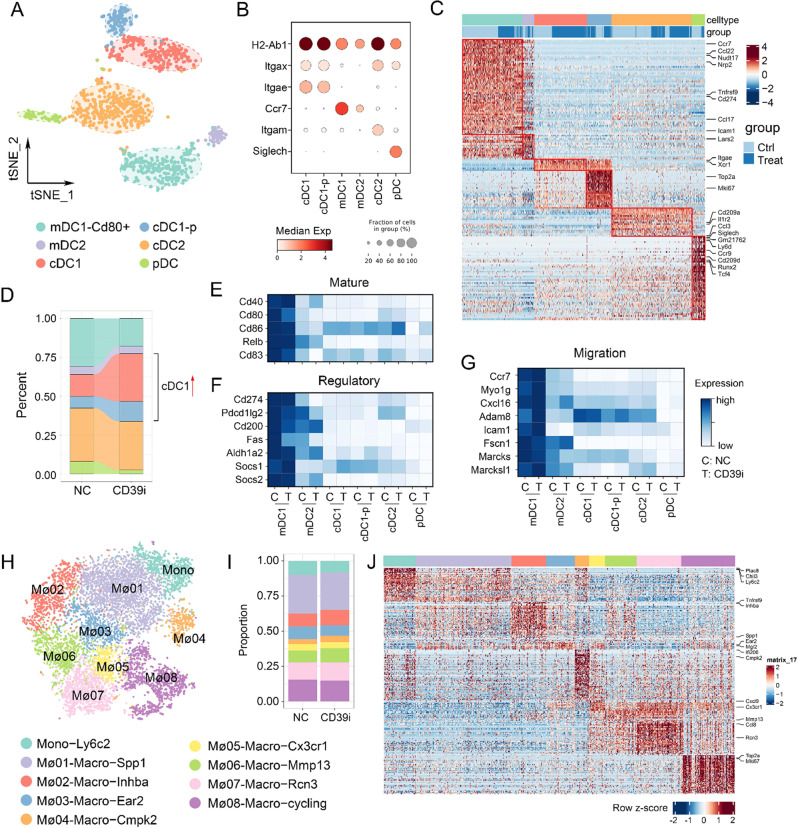
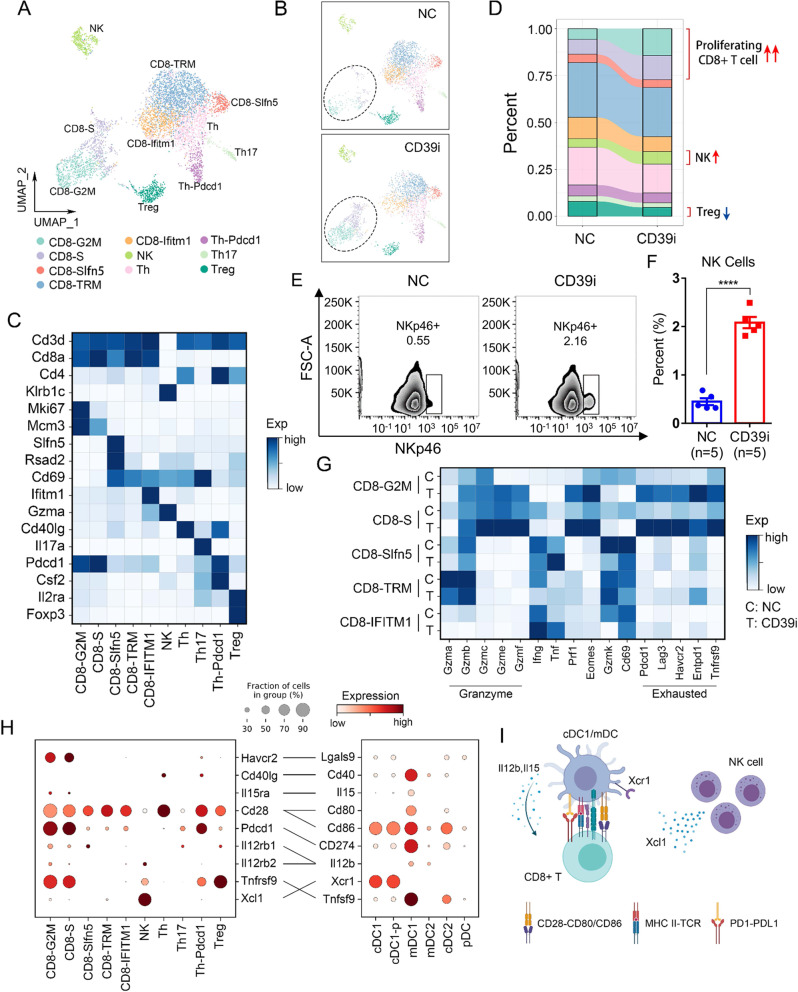
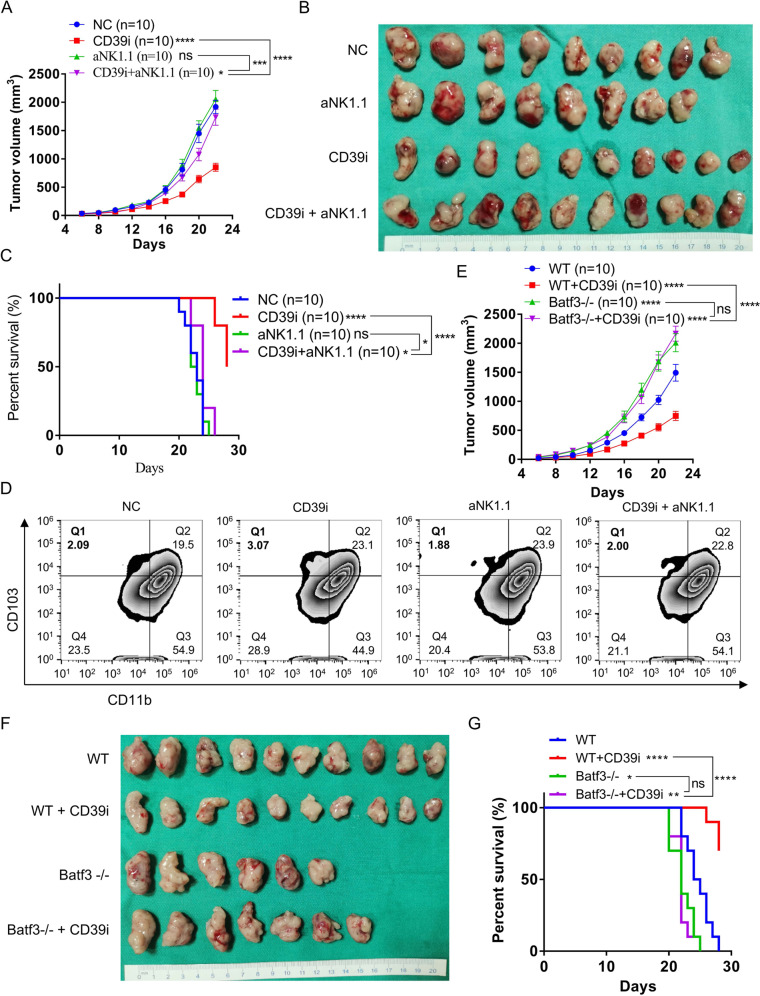
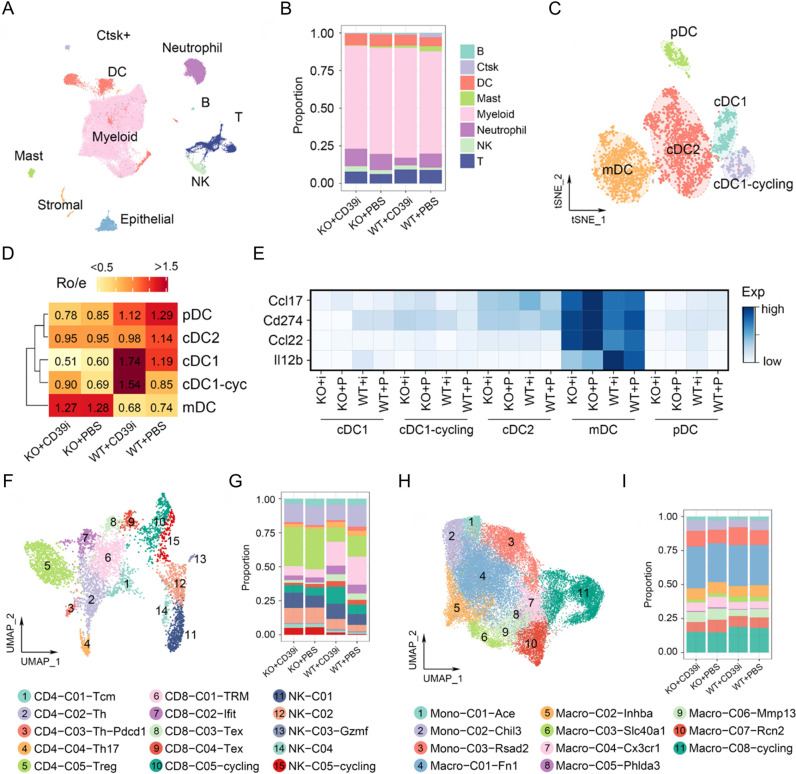
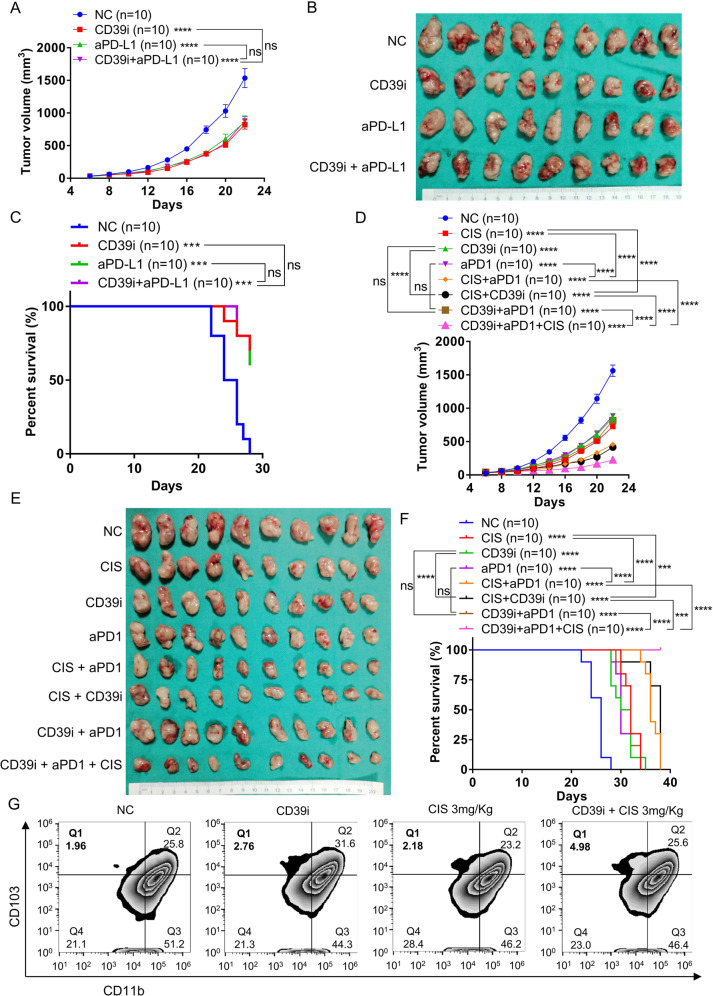
Single-cell sequencing technologies have noteworthily improved our understanding of the genetic map and molecular characteristics of bladder cancer (BC). Here we identify CD39 as a potential therapeutic target for BC via single-cell transcriptome analysis. In a subcutaneous tumor model and orthotopic bladder cancer model, inhibition of CD39 (CD39i) by sodium polyoxotungstate is able to limit the growth of BC and improve the overall survival of tumor-bearing mice. Via single cell RNA sequencing, we find that CD39i increase the intratumor NK cells, conventional type 1 dendritic cells (cDC1) and CD8 + T cells and decrease the Treg abundance. The antitumor effect and reprogramming of the tumor microenvironment are blockaded in both the NK cells depletion model and the cDC1-deficient Batf3-/- model. In addition, a significant synergistic effect is observed between CD39i and cisplatin, but the CD39i + anti-PD-L1 (or anti-PD1) strategy does not show any synergistic effects in the BC model. Our results confirm that CD39 is a potential target for the immune therapy of BC.


Conflict of interest statement

The authors declare no competing interests.

Figures

Fig. 1
Fig. 1. Expression distribution and function of CD39.
A The single cells from 8 BC and 3 paracancer tissues were clustered into 10 major clusters. B The CD39 was mainly expressed in endothelial cells, smooth muscle cells, pericytes, myeloid cells, fibroblasts, and lymphocytes. C Immunohistochemical staining of CD39 in BC (n = 63) and paracancer (n = 16) tissues in a tissue array. Scale bars, 500 μm (upper) and 50 μm (lower). D The expression levels of CD39 staining in BC (Mean ± SEM: 5.651 ± 0.4354, n = 63) and paracancer (Mean ± SEM: 2.188 ± 0.4105, n = 16) tissues were assessed using Remmele and Stegner’s semiquantitative immunoreactive score (IRS) scale. The two-side unpaired Student’s t-test was used for two-group comparisons of values. E A high level of CD39 predicted poor prognosis in 63 BC patients. The log-rank (Mantel–Cox) test was used to compare the survival curves. F, G The differences in CD39 expression patterns between lymphocytes of BC (n = 8) and paracancer (n = 3) tissue origin, and the correlation between CD39 and LAG3. H Correlation between the CD39 expression level and T-cell exhaustion in the TCGA-BLCA cohort. A linear regression model (Pearson’s correlation) was used to determine the individual correlations between different variables. I, J Correlation between the clinical outcome of aPD-L1 agent (atezolizumab) and the expression level of PD-L1 or CD39 in 7 molecular types of BC patients reported by Mariathasan et al., MS1a: n = 23, MS1b: n = 79, MS2a1: n = 45, MS2a2: n = 25, MS2b1: n = 92, MS2b2.1: n = 18, MS2b2.2: n = 66. Bounds of the box spans from 25% percentile to 75% percentile, a dashed line shows median, and whiskers indicate minima and maxima. K Immunofluorescence staining (DAPI: blue, CD8: red, LAG3: green) of exhausted T cells in BC (n = 63) and paracancer (n = 16) tissues in a tissue array, Mean ± SEM of CD8 + LAG3 + IRS: 2.778 ± 0.2971, n = 63, Mean ± SEM of CD8 + IRS: 3.698 ± 0.3108, n = 63. Scale bars = 20 μm. L, M Correlation between the expression level of CD39 and the proportion of T-cell exhaustion (Mean ± SEM: 2.778 ± 0.2971, n = 63) or CD8 + T-cell infiltration (Mean ± SEM: 3.698 ± 0.3108, n = 63). A linear regression model (Pearson’s correlation) was used to determine the individual correlations between different variables. Source data are provided as a Source Data file (D, E, L, M). P-values <0.05 were considered significant: *P < 0.05; **P < 0.01; ***P < 0.001; ****P < 0.0001.
Fig. 2
Fig. 2. CD39i suppressed BC progression by increasing the CD45 + immune cell populations in tumor tissues.
CD39i noteworthily inhibited the subcutaneous tumor growth (A, B) and improved the survival rate of mice (C), n = 10 for each group. The two-side unpaired Student’s t-test was used for the tumor size comparison of different groups at the same time point. The log-rank (Mantel–Cox) test was used to compare the survival curves. CD39i noteworthily reduced the maximum cross-sectional area (Mean ± SEM: 0.2050 ± 0.0359 vs. 0.0675 ± 0.0202) of the orthotopic mouse bladder tumor, n = 4 for each group (D, E) and the bladder weight (Mean ± SEM: 0.6333 ± 0.0494 vs. 0.2000 ± 0.0447) of mice, n = 6 for each group (F, G). The two-side unpaired Student’s t-test was used for two-group comparisons of values. Flow cytometry analysis showed that CD39i treatment induced a significant increase in immune cell infiltration within the tumor tissues, including CD45 + cells (H, I), CD4 + and CD8 + T cells (JL). Mean ± SEM: I 4.598 ± 0.1262 vs. 10.05 ± 0.3638, K 2.277 ± 0.3334 vs. 4.958 ± 0.0859, L 3.782 ± 0.4524 vs. 6.598 ± 0.5756. All the flow cytometry analyses were repeated 3 times with 5 samples in each group. M The single cells from subcutaneous tumors (3 subcutaneous tumors from 3 mice mixed 1:1:1) of the control and CD39i groups were clustered into 9 major cell types. N There was no difference in the proportion of the cell clusters between the control and CD39i groups. Source data are provided as a Source Data file (A, C, E, G, I, K, L). P-values <0.05 were considered significant: *P < 0.05; **P < 0.01; ***P < 0.001; ****P < 0.0001.
Fig. 3
Fig. 3. The proportion of DC subpopulations and mononuclear macrophage subpopulations changed after CD39i treatment.
A, B The DCs were clustered into 6 clusters according to classical markers. C The expression of function-related genes in different DC subpopulations from the control group and the CD39i treatment group. D The proportion of DC subpopulations derived from the control group and CD39i treatment group (3 subcutaneous tumors from 3 mice mixed 1:1:1). EG There were no differences in mature, regulatory, and migration related functional gene expression after CD39i treatment. HJ. The mononuclear macrophages showed greater heterogeneity and a large number of different subpopulations, but the proportion of each subpopulation and the functional gene expression levels were not noteworthily changed after CD39i treatment.
Fig. 4
Fig. 4. The proportion of lymphocyte subpopulations changed after CD39i treatment.
A, B The lymphocytes derived from the control group and the CD39i treatment group were clustered into 10 clusters according to classical markers. C The expression of classical markers in different lymphocyte subpopulations. D The proportions of different lymphocyte subpopulations in the control group and the CD39i treatment group (3 subcutaneous tumors from 3 mice mixed 1:1:1). E, F Flow cytometry showed that CD39i treatment resulted in the upregulation of NK cells (CD45 + CD3-NKP46 + ), Mean ± SEM: 0.4480 ± 0.0718 vs. 2.082 ± 0.1169. The two-side unpaired Student’s t-test was used for two-group comparisons of values. The flow cytometry analyses were repeated 3 times with 5 samples in each group. Source data are provided as a Source Data file. G CD39i treatment resulted in enhanced function (cytotoxicity) of CD8 + T cells and upregulated expression of several inhibitory receptors (Pd1, Lag3, and Tim3). H The molecular interactions between CD45 + immune cell populations via specific protein complexes, predicted by CellPhoneDB 2, . I A conceivable cell–cell communication network (Created with BioRender.com.) of immune cells in the subcutaneous tumor. P-values <0.05 were considered significant: *P < 0.05; **P < 0.01; ***P < 0.001; ****P < 0.0001.
Fig. 5
Fig. 5. Depletion of NK cells reverses the antitumor effects of CD39i in vivo.
AC CD39i significantly inhibited the tumor growth and improved the overall survival rate in normal mice, but the effect of CD39i was remarkably reversed in the NK cell-depleted mice (n = 10 for each group). Comparisons of tumor growth curves were performed by a two-way ANOVA test followed by Tukey’s multiple comparison test. The log-rank (Mantel–Cox) test was used to compare the survival curves. D CD39i treatment increased the proportion of tumor infiltrated cDC1 (CD45 + CD11c + MHC II + CD103 + CD11b-) in control mice, but not in NK cells absent mice. The flow cytometry analyses were repeated 3 times with 5 samples in each group. EG CD39i was confirmed to inhibit the progression of BC and improve the prognosis of mice, but it failed to effectively inhibit the growth of subcutaneous tumors or improve the mouse prognosis in cDC1-deficient Batf3−/− mice, n = 10 for each group. Comparisons of tumor growth curves were performed by a two-way ANOVA test followed by Tukey’s multiple comparison test. The log-rank (Mantel–Cox) test was used to compare the survival curves. Source data are provided as a Source Data file (A, C, E, G). Bar graphs show the mean ± SEM, and P-values <0.05 were considered significant: *P < 0.05; **P < 0.01; ***P < 0.001; ****P < 0.0001.
Fig. 6
Fig. 6. The effects of Batf3−/− cDC1-deficient on tumor microenvironment and CD39i efficacy.
A Single cells from WT and Batf3−/− cDC1-deficient mice treated with or without CD39i were clustered into 10 major clusters, 3 subcutaneous tumors from 3 mice in each group mixed 1:1:1. B The proportions of 8 major clusters without stromal cells and epithelial cells. C The DCs were clustered into 5 clusters based on classical markers. D Ratios of observed to expected cell numbers (Ro/e) for each DC subcluster in different groups, Ro/e > 1.1 was considered as enriched in the group. E Compared to WT mice, mDC from Batf3−/− mice expressed more Ccl17 and Ccl22 and less Il12b. F Lymphocytes were clustered into 15 clusters. G CD39i treatment significantly increased the proportions of proliferating CD8 + T cells and NK cells, but decreased the proportion of Treg and Th cells in Batf3+/+ mice. In Batf3−/− mice, only a slight increase in NK cells was observed. H, I CD39i was not responsive to mononuclear macrophages in both Batf3+/+ mice and Batf3−/− mice.
Fig. 7
Fig. 7. Effects of CD39i combined with commonly used anti-bladder cancer drugs.
AC Monotherapy with CD39i or aPD-L1 antibody conspicuously inhibited the tumor growth and improved the mouse prognosis, but the combination therapy with CD39i and aPD-L1 did not show any synergistic effect, n = 10 for each group. DF The combination strategies, CD39i + CIS and aPD1 + CIS, but not CD39i + aPD1, had a significant synergistic effects on inhibiting tumor growth and improving prognosis, and the combination of CD39i, CIS, and aPD1 had the strongest antitumor efficacy in vivo, n = 10 for each group. Comparisons of tumor growth curves were performed by a two-way ANOVA test followed by Tukey’s multiple comparison test. The log-rank (Mantel–Cox) test was used to compare the survival curves. G CD39i (but not 3 mg/kg cisplatin alone) treatment significantly increased the proportion of tumor infiltrated cDC1 cells, and cisplatin at dose of 3 mg/kg had a synergistic effect with CD39i on increasing the proportion of cDC1 in tumors. cDC1: CD45 + CD11c + MHC II + CD103 + CD11b−. The flow cytometry analyses were repeated at 3 times with 5 samples in each group. Source data are provided as a Source Data file (A, C, D, F). Bar graphs show the mean ± SEM, and P-values <0.05 were considered significant: *P < 0.05; **P < 0.01; ***P < 0.001; ****P < 0.0001.

Similar articles

Cited by

References

    1. Siegel RL, Miller KD, Jemal A. Cancer statistics, 2020. CA Cancer J. Clin. 2020;70:7–30. - PubMed
    1. Burger M, et al. Epidemiology and risk factors of urothelial bladder cancer. Eur. Urol. 2013;63:234–241. - PubMed
    1. Ghandour R, Singla N, Lotan Y. Treatment options and outcomes in nonmetastatic muscle invasive bladder cancer. Trends Cancer. 2019;5:426–439. - PubMed
    1. Im S-W, et al. Genomic landscape of young-onset bladder cancer and its prognostic implications on adult bladder cancer. Cancers. 2020;12:307. - PMC - PubMed
    1. Zhang Z, Zhang G, Kong C. Targeted inhibition of Polo-like kinase 1 by a novel small-molecule inhibitor induces mitotic catastrophe and apoptosis in human bladder cancer cells. J. Cell Mol. Med. 2017;21:758–767. - PMC - PubMed

Publication types