. 2022 Nov 8;13(1):6744.
doi: 10.1038/s41467-022-34559-0.

Pharmacological blockade of TEAD-YAP reveals its therapeutic limitation in cancer cells

Affiliations

Pharmacological blockade of TEAD-YAP reveals its therapeutic limitation in cancer cells

Yang Sun et al. Nat Commun. .

Abstract

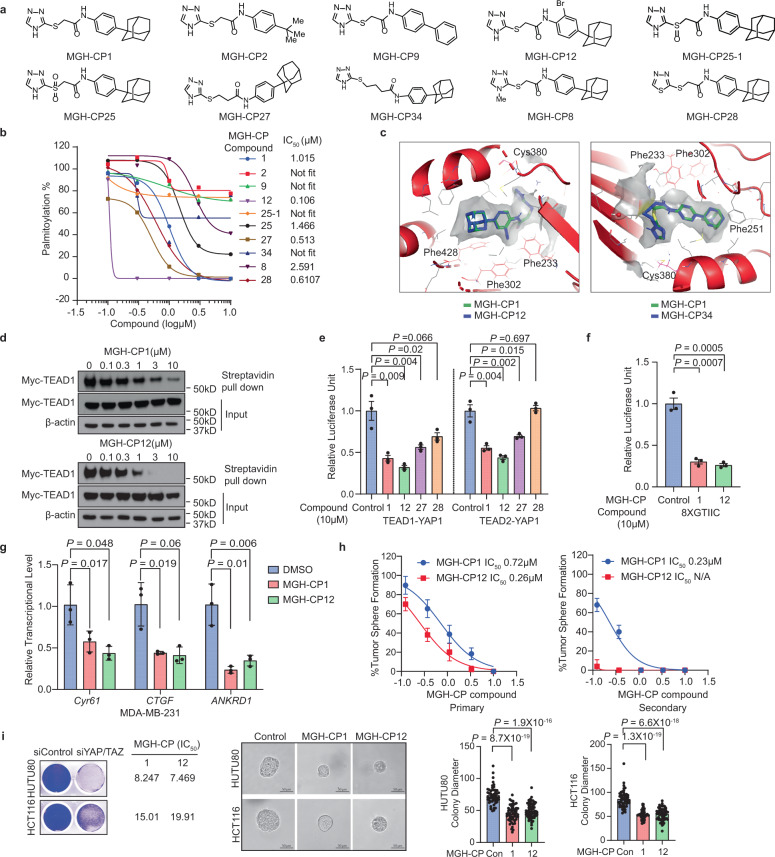
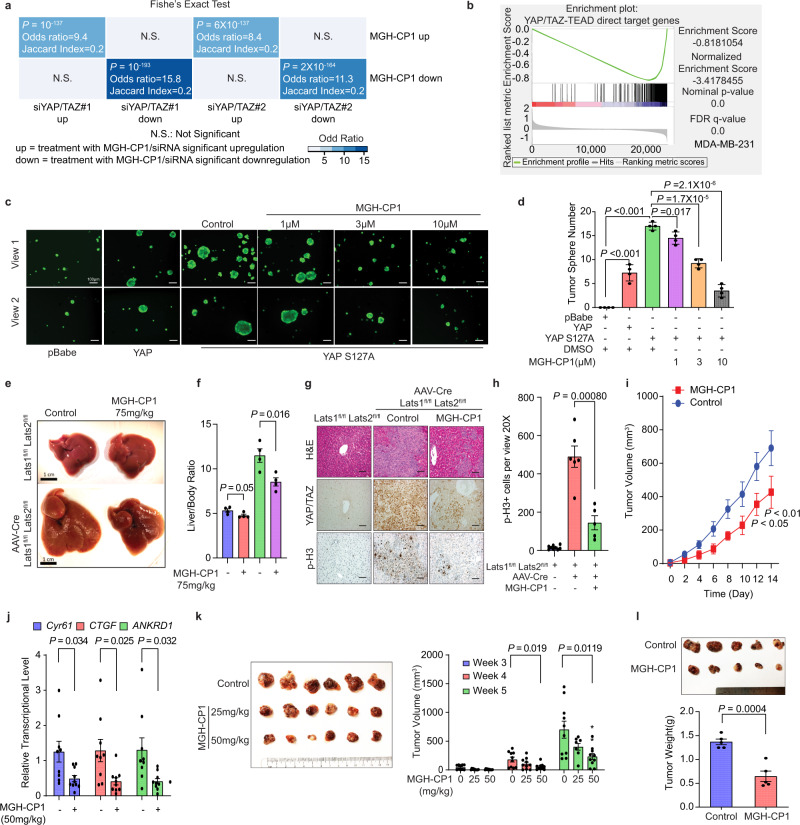
Targeting TEAD autopalmitoylation has been proposed as a therapeutic approach for YAP-dependent cancers. Here we show that TEAD palmitoylation inhibitor MGH-CP1 and analogues block cancer cell "stemness", organ overgrowth and tumor initiation in vitro and in vivo. MGH-CP1 sensitivity correlates significantly with YAP-dependency in a large panel of cancer cell lines. However, TEAD inhibition or YAP/TAZ knockdown leads to transient inhibition of cell cycle progression without inducing cell death, undermining their potential therapeutic utilities. We further reveal that TEAD inhibition or YAP/TAZ silencing leads to VGLL3-mediated transcriptional activation of SOX4/PI3K/AKT signaling axis, which contributes to cancer cell survival and confers therapeutic resistance to TEAD inhibitors. Consistently, combination of TEAD and AKT inhibitors exhibits strong synergy in inducing cancer cell death. Our work characterizes the therapeutic opportunities and limitations of TEAD palmitoylation inhibitors in cancers, and uncovers an intrinsic molecular mechanism, which confers potential therapeutic resistance.


Conflict of interest statement

X.W. has a financial interest in Tasca Therapeutics, which is developing small molecule modulators of TEAD palmitoylation and transcription factors. Dr. Wu’s interests were reviewed and are managed by Mass General Hospital, and Mass General Brigham in accordance with their conflict of interest policies. The remaining authors declare no competing interests.

Figures

Fig. 1
Fig. 1. MGH-CP1 and analogues are palmitoylation inhibitors with different outcomes in blocking TEAD–YAP activities.
a Structures of MGH-CP1 and its analogues. b Inhibition of TEAD2 YAP-binding domain (YBD) in vitro autopalmitoylation by MGH-CP compounds. c The MGH-CP12 and MGH-CP34 were docked into MGH-CP1 binding pocket of TEAD2 YAP binding domain. d Cell-based palmitoylation assay using metabolic probe alkyne palmitic acid labeled protein. HEK293A cells were treated with MGH-CP1 and MGH-CP12 separately. e Inhibition of TEAD1/2 and YAP binding in Gal4-TEAD1/2-YAP binding reporter assay by MGH-CP1, 12, 27 and 28 (n = 3 biological repeats). f MGH-CP1 and CP12 inhibit TEAD-binding element–driven luciferase reporter (8xGTIIC-luciferase) (n = 3 biological repeats). g MDA-MB-231 cells were treated with MGH-CP1 and MGH-CP12. Transcriptional levels of Cyr61, CTGF and ANKRD1 were determined using qPCR (n = 3 biological repeats). h Primary and secondary Huh7 tumor spheres treated with MGH-CP1 and MGH-CP12 with indicated concentrations. Dose response curves show MGH-CP1 and MGH-CP12 in Huh7 tumor sphere formation assay (n = 3 biological repeats). i Representative images of HCT116 and HUTU80 cells with knockdown of YAP/TAZ, compared to MGH-CP1 and MGH-CP12 IC50 values, and representative images in 3D tumor cultures with MGH-CP1 and MGH-CP12 treatment in HUTU80 and HCT116 cells. The 3D colonies were measured by diameter at day 4 with compound treatment (n = 51, 53, 59 colonies for control, CP1 and CP12, respectively in HUTU80 cells, n = 52, 58, 66 colonies for control, CP1 and CP12, respectively in HCT116 cells). Scale bar, 50 µm. Data are represented as mean ± S.E.M. P values were determined using two-tailed t-tests. Source data are provided as a Source Data file.
Fig. 2
Fig. 2. MGH-CP1 treatment overlaps with YAP/TAZ suppression in transcriptional output and inhibits YAP-dependent transformation, organ enlargement, and tumor initiation.
a Fisher’s Exact Test using RNA-seq datasets of MGH-CP1 (GSE177052) versus YAP/TAZ knockdown (GSE102407) in MDA-MB-231 cells. Two tailed P values are shown. b Gene set enrichment analysis of YAP/TAZ-TEAD target gene signature upon MGH-CP1 treatment. c Tumor sphere formation assay of MCF10A cells transduced with YAP WT or S127A mutation. Indicated doses of MGH-CP1 were applied. Tumor sphere numbers were counted in d (n = 4 biological repeats). Scale bar, 100 µm. e MGH-CP1 inhibits liver enlargement induced by liver specific Lats1/Lats2 deletion in vivo. Scale bar, 1 cm. f Quantification of relative liver weight of control or MGH-CP1-treated Lats1fl/fl;Last2fl/fl mice with control or Lentiviral-Cre delivery (n = 4 mice). g Representative images of histology and IHC of YAP/TAZ and phospho-histone H3 (p-H3) in the liver. Scale bar, 50 µm. (Images were chosen from n = 9, 6, 5 histology fields for Control, Lats1/Lats2 double knockout and Lats1/Lats2 double knockout with MGH-CP1, respectively) h Percentage of phospho-histone H3 positive cells in the liver of control and Lats1/Lats2 double knockout mice treated with MGH-CP1 (n = 9, 6, 5 histology fields for Control, Lats1/Lats2 double knockout and Lats1/Lats2 double knockout with MGH-CP1, respectively). i Xenograft tumor volumes of Huh7 cells inoculated in SCID mice, and then treated with vehicle control or MGH-CP1 (n = 9, 10 tumors for control and MGH-CP1, respectively). j Relative mRNA levels of CTGF and Cyr61 were determined using qPCR in xenograft tumors. All the mRNA levels were normalized to 18S rRNA (n = 9, 10 tumors for control and MGH-CP1, respectively). k The image of xenograft tumors are shown for tumor initiation. Tumor volumes were determined (n = 10 tumors). l The images of xenograft tumors pre-treated with Control or MGH-CP1 (10 µM for 24 h) ex vivo, before inoculation into animals. Tumor weights were measured (n = 5 tumors). Data are represented as mean ± S.E.M. P values were determined using two-tailed t-tests. Source data are provided as a Source Data file.
Fig. 3
Fig. 3. Cancer cell growth sensitivity to MGH-CP1 correlates with YAP-dependency in a large-scale cancer cell line profiling.
a Heatmap shows viability through color-coding as percentage of cell viability normalized to vehicle control in tumor cells treated with serial concentrations of MGH-CP1. b Violin plot shows viability fold change by MGH-CP1 treatment relative to vehicle control in different type of tumor cells. c A receiver operating characteristic curve shows YAP-dependency of MGH-CP1 sensitive tumor cells (MGH-CP1 IC50 < 10 µM) relative to insensitive tumor cells (MGH-CP1 IC50 > 20 µM). d Pearson correlation of MGH-CP1 IC50 against YAP dependency score in a large panel of cancer cell lines. The cell line proliferation profiling in the presence of MGH-CP1 and intersecting with cancer cell dependency map showed significant correlation of YAP-dependency score with MGH-CP1 sensitivity (IC50 values) in colon cancer cell lines (e), non-small-cell lung carcinoma (NSCLC) cancer cell lines (f) and ovarian cancer cell lines (g). h MGH-CP1 inhibits the proliferation of YAP-dependent, but not of YAP-independent liver cancer cell lines (n = 3 biological repeats). i MGH-CP1 inhibits the proliferation of YAP-dependent GNAQ mutant uveal melanoma cells compared to BRAF or NRAS mutant uveal melanoma and melanoma cell lines (n = 6 biological repeats for Huh7, SK-HEP-1 and SNU449, n = 3 biological repeats for SNU398). j Tet-on inducible shRNA knockdown of YAP or MGH-CP1 treatment in Huh7 cells was administrated for 8 days. Doxycycline or MGH-CP1 was withdrawn after 8 days, and cell proliferation is monitored for additional 4 days. YAP knockdown efficiency after doxycycline treatment was evaluated by qPCR after 48 h (n = 3 biological repeats). DOX, Doxycycline. Data are represented as mean ± S.E.M. P values were determined using two-tailed t-tests. Source data are provided as a Source Data file.
Fig. 4
Fig. 4. TEAD–YAP/TAZ blockade promotes transcriptional activation of PIK3C2B and SOX4 mediated by VGLL3.
a Volcano plot of RNA-seq results of MDA-MB-231 cells treated with MGH-CP1. b Venn diagram of significantly upregulated genes treated with MGH-CP1 and siYAP/TAZ in various cancer cell lines. c Heatmap of 51 genes commonly upregulated with TEAD–YAP/TAZ blockade. Top 10 genes with the highest fold change were shown in the box. d Pearson correlation of PIK3C2B transcriptional level against YAP signature in tumor cells. Transcriptional level of YAP, TAZ, Cyr61, CTGF, ANKRD1 (e), PIK3C2B and SOX4 (f) were examined in DLD1, Huh7, HUTU80, H1299, H226 and MDA-MB-231 cells with siYAP/TAZ knockdown. All the gene expression levels of siYAP/TAZ treated samples were normalized to siControl (dashline). (n = 3 biological repeats). siYT, siYAP/TAZ. g PIK3C2B and SOX4 transcriptional levels in Huh7, MDA-MB-231, HCT116, DLD1 and HCT15 treated with MGH-CP1 treatment were assessed by qPCR (n = 3 biological repeats). h H226 cells were treated with MGH-CP1 and K-975, PIK3C2B and SOX4 expression levels were shown (n = 3 biological repeats). i HEK293A cells were overexpressed with YAP or TAZ, transcriptional levels of YAP, TAZ, Cyr61, CTGF, ANKRD1, PIK3C2B and SOX4 were assessed (n = 3 biological repeats). j PIK3C2B and SOX4 transcriptional levels in HEK293A cells with overexpression of human VGLL3 (n = 3 biological repeats). k HEK293A cells were treated with Control siRNA or VGLL3 siRNA in the presence of vehicle control of MGH-CP1, VGLL3, PIK3C2B and SOX4 expression levels were shown (n = 3 biological repeats). l VGLL3 was silenced with siRNA in MDA-MB-231, and VGLL3, PIK3C2B and SOX4 transcriptional levels were determined (n = 3 biological repeats). Data are represented as mean ± S.E.M. P values were determined using two-tailed t-tests. Source data are provided as a Source Data file.
Fig. 5
Fig. 5. TEAD–YAP blockade activates AKT activity through PIK3C2B and SOX4.
a Immunoblot of p-AKT (T308), p-AKT (S473) and total AKT in Huh7, DLD1, HCT116, HCT15, H226 and H1299 cells treated with MGH-CP1 at indicated time point. b Immunoblot of p-AKT (S473) and total AKT in DLD1 and HCT116 cells treated with TEAD-YAP inhibitors, including celastrol, TEAD347 and CIL56 at indicated time point. c DLD1 and HCT116 cells were treated with either of MGH-CP1, pan-PI3K inhibitor Wortmannin, or combination. p-AKT (S473) and total AKT levels were determined by immunoblot. ac Representative images were chosen from n = 3 biological repeats. d DLD1 cells were transfected with sets of SOX2 siRNAs, followed by MGH-CP1 treatment for 24 h, p-AKT (T308), p-AKT (S473) and total AKT were examined by immunoblot. SOX4 expression levels were evaluated by qPCR after SOX4 siRNA knockdown (n = 3 biological repeats). Huh7 (e) and HCT116 (f) cells were overexpressed with SOX4 or PIK3C2B in the presence of MGH-CP1. Cell viability was shown at different concentrations (n = 3 biological repeats). Huh7 (g) and HCT116 (h) cells were treated with control siRNA and SOX4/PIK3C2B siRNA. Cell viability with treatment of different concentration of MGH-CP1was determined (n = 3 biological repeats). Data are represented as mean ± S.E.M. P values were determined using two-tailed t-tests. Source data are provided as a Source Data file.
Fig. 6
Fig. 6. Synergistic effects of TEAD and AKT inhibitors combination in cancer cells.
a Drug combination experiments using MGH-CP1 and AKT inhibitor ipatasertib, and Heatmaps show color-coding as percentage of cell viability normalized to untreated controls. Heatmaps of Bliss score for MGH-CP1 and ipatasertib combination were shown. b Representative images in 3D tumor cultures of HUTU80 cells treated with MGH-CP1, MGH-CP12, ipatasertib or combination. Colony diameters were measured to assess the tumor growth with inhibitors (n = 51, 53, 59, 33, 44, 75 colonies for control, CP1, CP12, ipatasertib, CP1 with ipatasertib, and CP12 with ipatasertib, respectively at day 4, n = 104, 94, 75, 97, 74, 77 colonies for the same sample order as above at day 8). Colony numbers were determined (n = 3 biological repeats). Scale bar, 200 µm. c Representative images in 3D tumor cultures of HCT116 cells treated with MGH-CP1, MGH-CP12, ipatasertib or combination. Colony diameters were measured to assess the tumor growth with inhibitors (n = 52, 58, 66, 45, 67, 69 colonies at day 4, n = 68, 79, 85, 58, 66, 84 colonies at day 11, for the same sample order as in b. Colony numbers were determined (n = 3 biological repeats). Scale bar, 200 µm. d Representative images of fluorescent staining with Calcein-AM and Propidium Iodide in Huh7 and HUTU80 cells treated with MGH-CP1, ipatasertib and combination. Cell death percentages were determined by dead cell/total cells (n = 3 biological repeats). Scale bar, 200 µm. e 7-AAD exclusion assay showing the histogram of 7-AAD staining in MDA-MB-231, DLD1 cells treated with MGH-CP1, ipatasertib and combination (representative histograms were chosen from n = 3 biological repeats). Data are represented as mean ± S.E.M. P values were determined using two-tailed t-tests. Source data are provided as a Source Data file.

References

    1. Pan D. Hippo signaling in organ size control. Genes Dev. 2007;21:886–897. - PubMed
    1. Harvey KF, Zhang X, Thomas DM. The Hippo pathway and human cancer. Nat. Rev. Cancer. 2013;13:246–257. - PubMed
    1. Huang J, Wu S, Barrera J, Matthews K, Pan D. The Hippo signaling pathway coordinately regulates cell proliferation and apoptosis by inactivating Yorkie, the Drosophila Homolog of YAP. Cell. 2005;122:421–434. - PubMed
    1. Zhao B, et al. TEAD mediates YAP-dependent gene induction and growth control. Genes Dev. 2008;22:1962–1971. - PMC - PubMed
    1. Wu S, Liu Y, Zheng Y, Dong J, Pan D. The TEAD/TEF family protein Scalloped mediates transcriptional output of the Hippo growth-regulatory pathway. Dev. Cell. 2008;14:388–398. - PubMed

Publication types

MeSH terms

Substances