. 2022 Nov 8;13(1):6752.
doi: 10.1038/s41467-022-34467-3.

GZMKhigh CD8+ T effector memory cells are associated with CD15high neutrophil abundance in non-metastatic colorectal tumors and predict poor clinical outcome

Affiliations

GZMKhigh CD8+ T effector memory cells are associated with CD15high neutrophil abundance in non-metastatic colorectal tumors and predict poor clinical outcome

Silvia Tiberti et al. Nat Commun. .

Erratum in

Abstract

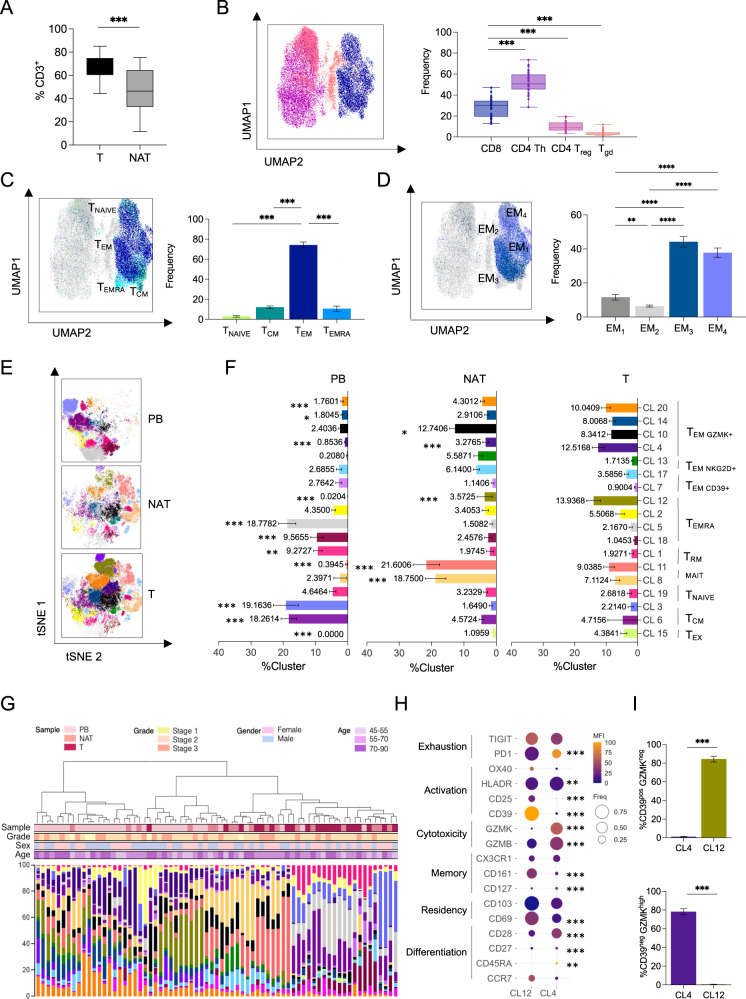
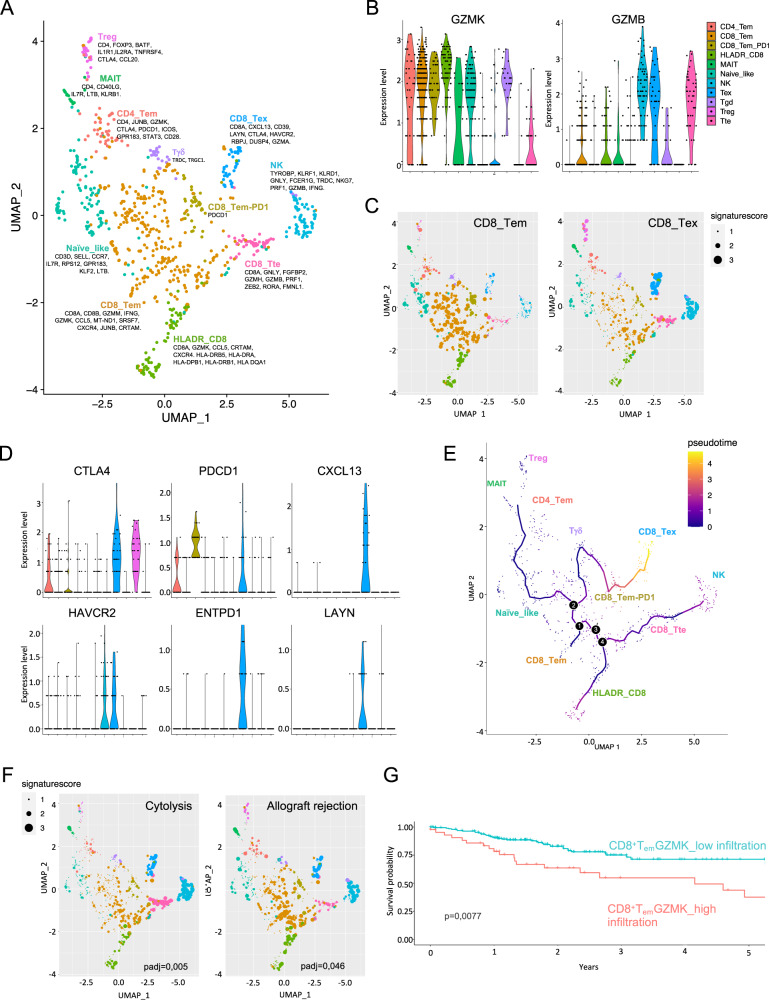
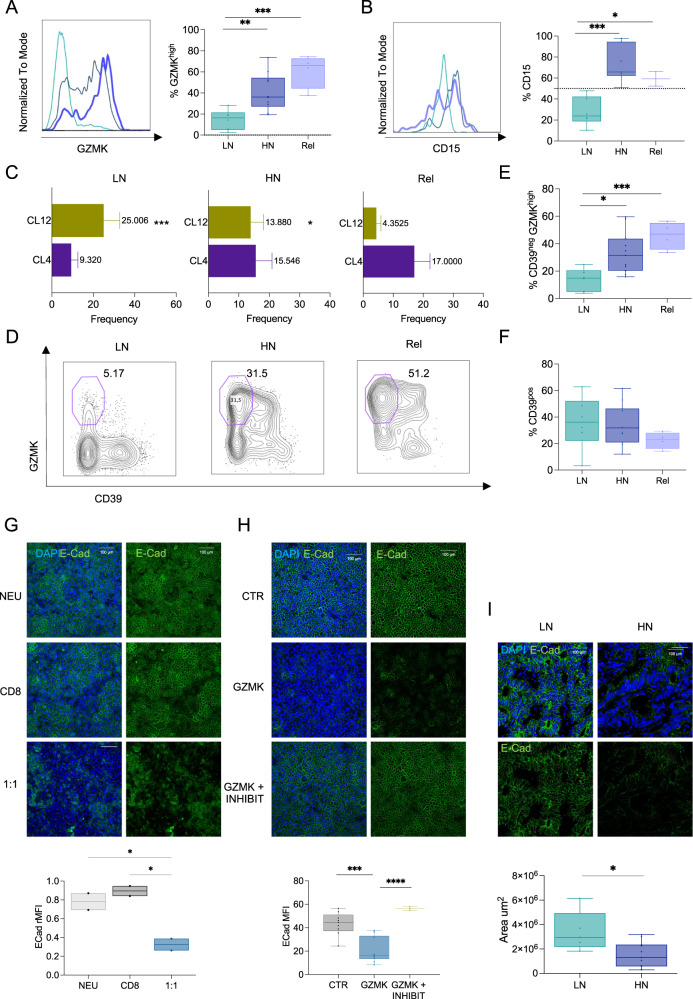
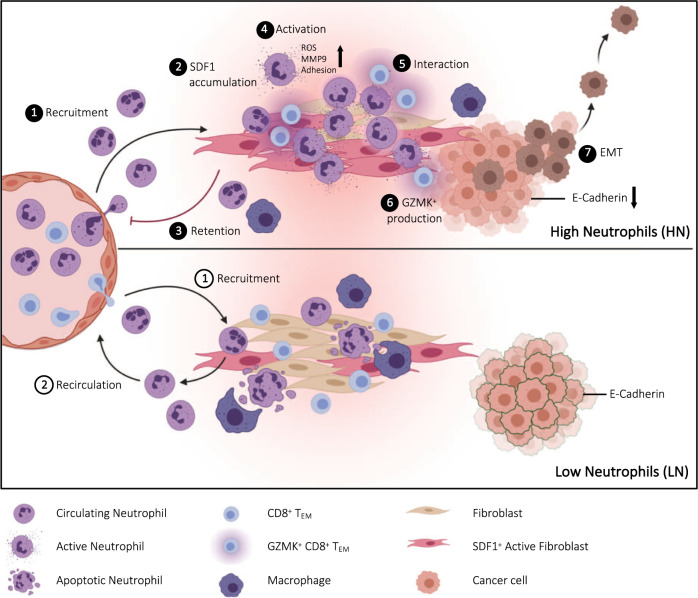
CD8+ T cells are a major prognostic determinant in solid tumors, including colorectal cancer (CRC). However, understanding how the interplay between different immune cells impacts on clinical outcome is still in its infancy. Here, we describe that the interaction of tumor infiltrating neutrophils expressing high levels of CD15 with CD8+ T effector memory cells (TEM) correlates with tumor progression. Mechanistically, stromal cell-derived factor-1 (CXCL12/SDF-1) promotes the retention of neutrophils within tumors, increasing the crosstalk with CD8+ T cells. As a consequence of the contact-mediated interaction with neutrophils, CD8+ T cells are skewed to produce high levels of GZMK, which in turn decreases E-cadherin on the intestinal epithelium and favors tumor progression. Overall, our results highlight the emergence of GZMKhigh CD8+ TEM in non-metastatic CRC tumors as a hallmark driven by the interaction with neutrophils, which could implement current patient stratification and be targeted by novel therapeutics.


Conflict of interest statement

E.L. receives research grants from Brystol Myers Squibb on a topic unrelated to this work and serves as a consultant for BD Biosciences. The remaining authors declare no competing interests.

Figures

Fig. 1
Fig. 1. CD15high neutrophils accumulate in a subset of non-metastatic resectable colorectal cancer (CRC) patients.
A Study design created with BioRender.com. Analysis of Tumor tissue (T), Normal Adjacent Tissue (NAT), and Peripheral Blood (PB) of non-metastatic CRC patients (n = 46). B Flow cytometric gating strategy for the identification of CD15high tumor infiltrating neutrophils. C Frequency of tumor infiltrating neutrophils defined as CD45+/CD11b+/HLADR-/CD56/CD66b+ within CD45+ cells in T vs NAT (n = 27, p = 0.0004). D Representatives contour plots of CD15 expression in low (LN) and high neutrophils (HN) patients. E Frequency of CD15high cells in LN and HN patients (n = 8 LN and n = 19 HN, p < 0.0001). F Frequency of CXCR4+/CXCR2+ within CD15low and CD15high neutrophils (n = 19, p < 0.0001). G Frequency of CXCR4+/CXCR2+ within LN and HN patients (n = 7 LN and n = 11 HN, p = 0.0007). H Representative brightfield images of neutrophils motility assay on the microfluidic device. Interstitial Fluid (IF) of T from HN and LN patients was tested. Bar plot of number of migrating neutrophils on chip upon stimulation with IF from HN (N = 6) and LN (N = 5, p = 0.03) patients. Scale bar 100 μm. I Spearman correlation between soluble molecules in T IF and CD15high neutrophils (n = 5). J Frequency of CXCR4+ CXCR2+ in HD SDF-1 treated-neutrophils (n = 9, p = 0.048). K Geometric mean of total ROS (tRos) MFI within HD fresh-isolated neutrophils treated with SDF-1 (n = 9, p = 0.0001). L Gelatinase activity assay on HD freshly isolated neutrophils treated with SDF-1 for 2 h, 6 h, and 24 h (n = 3). Bar plot showing fold change over untreated control (p = 0.2246 for 3 h vs 6 h, p = 0.0001 for 3 h vs 24 h, p = 0.0004 for 6 h vs 24 h). M Quantification of adherent neutrophils on endothelial cells after 2 h treatment with SDF-1 (n = 6, p = 0.0060). Bars represent mean ± SEM or box and whisker plots indicate Min to Max value, two tailed paired t test (C, E, J, K, M), two-tailed paired Wilcoxon test (F), two-tailed Mann–Whitney test (GH), two-tailed one-way Anova (L). Source data are provided as a Source Data file.
Fig. 2
Fig. 2. High-dimensional single cell analysis of CD8+ T cells identifies a tumor-specific CD39neg GZMKhigh population enriched in CRC.
A CD3 Lymphocytes frequency within CD45+ in tumor (T) compared with normal adjacent tissue (NAT) (n = 29, p < 0.0001). BD UMAP representation of concatenated CD3+ T cells from T samples with bar plot quantification. B Cytotoxic CD8+ T cells (blue), Th CD4+ (purple), Treg CD4+, CD25+, CD127 (pink), and γδT cells (orange) distribution (n = 29, p < 0.0001). C Naive T cells (TNAIVE, light green), central memory T cells (TCM, dark green), effector memory T cells (TEM, dark blue), effector memory cells re-expressing CD45RA (TEMRA, light blue) distribution (n = 31) (p < 0.0001 for TNAIVE vs TCM, TNAIVE vs TEM, TCM vs TEM, TEM vs TEMRA; p = 0.0031 for TNAIVE vs TEMRA; p = 0.9651 for TCM vs TEMRA). D Effector memory T cells subtypes (EM1–4) (n = 31) (p < 0.0001 for EM1 vs EM3, EM1 vs EM4, EM2 vs EM3, EM2 vs EM4; p = 0.0071 for EM1 vs EM2; p = 0.6521 for EM3 vs EM4). E tSNE representation of Phenograph algorithm identified 18 clusters of concatenated CD8+ T cells from T (n = 34), NAT (n = 17), and PB (n = 22) from CRC patients. F Cluster representation in different tissues: PB, NAT, T. G Hierarchical metaclustering of CRC patient’s samples based on Phenograph identified clusters using Ward’s minimum variance method. For each sample, sample type, grade, sex, and age are indicated (n = 71). H Balloon plot of the average expression levels and expression frequencies of marker of differentiation, residency, memory, cytotoxicity, tumor reactivity, activation, and exhaustion in clusters identified in (E, F) and enriched in T (n = 34). I Frequency of CD39pos/GZMKlow and CD39pos/GZMKhigh within Cluster 4 and Cluster 12 (n = 34) (p value <0.001). Bars represent mean ± SEM or box and whisker plots indicate Min to Max value, two-tailed paired Wilcoxon test (A), two-tailed one-way Anova (BF), two-tailed paired t test (I). Source data are provided as a Source Data file.
Fig. 3
Fig. 3. A CD39neg and GZMKhigh population characterizes CD8+ T cells infiltrating CRC.
A Representative contour plot and quantification of CD39neg and CD39pos frequency within CD8+ TEM (n = 34, p < 0.0001). B Representative contour plot and quantification of CD39neg and CD39pos frequency within GZMKhigh CD8+ TEM. (p < 0.0001). C Expression level of indicated markers within GZMKhigh and GZMKlow CD8+ TEM (p = 0.0032 for CD25, p < 0.0001 for CD39, CD69, CD103, CD161, CX3CR1, PD-1, CD28, p = 0.3752 for CD127, p = 0.0012 for GZMβ, p = 0.1035 for HLA-DR, p = 0.4775 for TIGIT, p = 0.0362 for CD27. Bars represent mean ± SEM or box and whisker plots indicate Min to Max value, two-tailed paired Wilcoxon test (A, B), two-tailed unpaired multiple t test (C). Source data are provided as a Source Data file.
Fig. 4
Fig. 4. Single-cell RNAseq analysis on CRC patients defines an effective prognostic signature based on CD8_Tem infiltration.
AF scRNAseq analysis on 8 CRC patients. A UMAP projection of CD8+ T cells. Colors represent different T cell subtypes. Key genes used for manual annotation are indicated. B Violin plots showing normalized expression of GZMB and GZMK in the different T CD8+ cell subtypes. C UMAP showing the expression of CD8_Tem and CD8_Tex signatures for each cell. Cells are color coded based on SNN-clustering, dot’s size reflects the expression of the signature for each cell. D Violin plots showing the expression of genes associated with T-cell exhaustion within the indicated cell subtype. Color code as in (B). E Monocle pseudotime analysis of the CD8+ T cell subtypes. The pseudotime line connects the indicated T cell subtypes identified in (A). F UMAP as in (C) showing the expression of Cytolysis and Allograft-rejection signatures. G Kaplan–Meyer analysis of the association of CD8_Tem cell subtype’ abundance with disease-free survival (DFS) on the TCGA-COAD cohort (n = 284; see “Methods” and Supplementary Table 1 for details). High infiltration in red, low infiltration in turquoise.
Fig. 5
Fig. 5. Contact-mediated interaction of neutrophils with CD8+ T cells induces GZMK expression.
A Pearson correlation between CD15high neutrophils and GZMKhigh CD8+ TEM (n = 22; p = 0.0387) B Representative contour plots of GZMK expression in CD8+ TEM in LN and HN patients. C Frequency of GZMKhigh CD8+ TEM cells in LN (n = 7) and HN (n = 14, p = 0.009) patients. D GZMK Mean Fluorescence Intensity (MFI) in HN (n = 9) and LN (n = 8) tumors. Scale bar 10 μm. Pearson correlation between: CXCR2+ neutrophils and GZMKhigh CD8+ T cells (E, n = 22, p < 0.0001); CXCR2+ neutrophils and tumor size (F, n = 22, p = 0.0002), GZMKhigh CD8+ T cells and tumor size (G, n = 21, p = 0.0004) within tumor (T) of MC38 tumor-bearing mice. GZMKhigh CD8+ T frequency within T (H, p = 0.050) and tumor weight (I, p = 0.030) in mice upon αLy6G antibody-mediated neutrophil’s depletion (n = 6) or treatment with isotype control (n = 5). J Representative confocal images and quantification of GZMK MFI in CD8+ and CD8 (not-CD8) cells within a 10 μm distance from neutrophils (CD66b+). Scale bar 5 μm. K Representative confocal images and normalized quantification (see “Methods”) of GZMK MFI in CD8+ within 10 μm (Touching, n = 161) or between 10 and 20 μm (Near, n = 203) from neutrophils (CD66b+). Yellow dotted lines represent 20 μm (left) and 10 μm (right). Scale bar 10 μm. L. GZMK+ MFI within activated CD8+ T cells (CTR) co-cultured at 1:1 ratio with neutrophils isolated from Bone Marrow (BM, n = 9) or MC38 tumors (T, n = 3) (p = 0.015 for CTR vs 1:1 NEU T, p < 0.0001 for CTR vs 1:1 NEU BM. M. Frequency of GZMKhigh CD8+ T cells (CTR) after co-culture with HD neutrophils (n = 16), either in plate or in Transwell (TRANS). The CD8+ T cells-neutrophils ratios are indicated (p = 0.011 for CTR vs 1:1, p = 0.098 for CTR vs 1:10, p = 0.976 for CTR vs 1:1 TRANS). N. Co-culture of CD8+ isolated from patients’ PB with neutrophils isolated from tumor (NEU T) (n = 2), CD15high and CD15lowneutrophils. Bars represent mean ± SEM or box and whisker plots indicate Min to Max value, two-tailed paired t test (C, L, M, N), two-tailed Mann–Whitney test (H), two-tailed unpaired t test (I). Source data are provided as a Source Data file.
Fig. 6
Fig. 6. GZMK produced by infiltrating CD8+TEM is associated with early relapse in CRC.
A, B Histogram and quantification of GZMK (A; p = 0.005 for LN vs HN, p = 0.0004 for LN vs Rel, p = 0.076 for HN vs Rel)) or CD15 (B; p = 0.0003 for HN vs LN, p = 0.027 for LN vs Rel, p = 0.329 for HN vs Rel) in LN (n = 6), HN (n = 10) and early-relapsed (Rel, n = 4) patients. C Bar plot of Cluster 12 (CL12, green - p = 0.0022 for HN vs LN, p = 0.0151 for HN vs Rel, p < 0.0001 for LN vs Rel) and Cluster 4 (CL4, purple - p = 0.0854 for HN vs LN, p = 0.7093 for HN vs Rel, p = 0,0832 for LN vs Rel) in LN (n = 10), HN (n = 5) and Rel (n = 4). D Representative contour plot of GZMK and CD39 expression within CD8+ TEM in HN, LN, and Rel patients. Frequency of CD39neg GZMKhigh (E; p = 0.011 for HN vs LN, p = 0.0005 for LN vs Rel, p = 0.157 for HN vs Rel) or CD39pos (F; p = 0.858 for HN vs LN, p = 0.160 for HN vs Rel, p = 0.238 for LN vs Rel) in LN (n = 6), HN (n = 11) and Rel (n = 4). G, H Representative images and quantification of E-Cadherin expression on: G CACO-HT29 co-culture on transwells in presence of neutrophils (NEU), CD8 or neutrophils/CD8 (1:1) isolated from HD (n = 2, p = 0.3371 for NEU vs CD8, p = 0.0191 NEU vs 1:1, p = 0.0104 for CD8 vs 1:1); H CACO-HT29 treated with PBS (CTR) or recombinant active human GZMK, with (GZMK + INHIBIT) or without (GZMK) GZMK’s inhibitor (n = 10, p = 0.0001 for GZMK vs CTR, p < 0.0001 for GZMK vs GZMK + INHIBIT, p = 0.18 for CTR vs GZMK + INHIBIT). DAPI blue, E-Cadherin in green. Scale bar 100 μm. H Representative images and quantification of Scale bar 100 μm. I Representative images and quantification of E-Cadherin expression by multicolor confocal imaging FFPE sections from LN (n = 5) and HN (n = 12, p value = 0.0140) CRC tumors. DAPI blue, E-Cadherin green. Scale bar 100 μm. Bars represent mean ± SEM or box and whisker plots indicate Min to Max value, two-tailed unpaired t test (A, B, E, F, I), two-tailed two-way Anova (C), two-tailed one-way Anova (G, corrected with Fisher’s LSD test, H). Source data are provided as a Source Data file.
Fig. 7
Fig. 7. Graphical model.
Abundance of CD15high neutrophils in the tumor identifies High (HN) and Low (LN) neutrophil subgroups of non-metastatic resectable CRC patients (1). Elevated SDF-1 levels in HN tumors reshape the functional state of infiltrating neutrophils (2), promoting their retention (3) and activation (4) at the tumor site. The contact-mediated interaction with neutrophils (5) pushes effector memory CD8+ T cells (TEM) to produce high levels of Granzyme K (GZMK) (6), which in turn remodels the tumor microenvironment (TME) fostering EMT (7). A GZMKhigh TEM transcriptional signature effectively stratify non-metastatic resectable CRC patients and predict poor clinical outcome. Graphical model created with BioRender.com.

Similar articles

Cited by

References

    1. Galon J, et al. Towards the introduction of the ‘Immunoscore’ in the classification of malignant tumours. J. Pathol. 2014;232:199–209. doi: 10.1002/path.4287. - DOI - PMC - PubMed
    1. Pagès F, et al. In situ cytotoxic and memory T cells predict outcome in patients with early-stage colorectal cancer. J. Clin. Oncol. 2009;27:5944–5951. doi: 10.1200/JCO.2008.19.6147. - DOI - PubMed
    1. Ogino S, et al. Lymphocytic reaction to colorectal cancer is associated with longer survival, independent of lymph node count, microsatellite instability, and CpG island methylator phenotype. Clin. Cancer Res. 2009;15:6412–6420. doi: 10.1158/1078-0432.CCR-09-1438. - DOI - PMC - PubMed
    1. American Cancer Society. Colorectal Cancer Fact and Figures. www.cancer.org (2020–2022)
    1. Koch M, et al. Tumor infiltrating T lymphocytes in colorectal cancer: Tumor-selective activation and cytotoxic activity in situ. Ann. Surg. 2006;244:986–992. doi: 10.1097/01.sla.0000247058.43243.7b. - DOI - PMC - PubMed

Publication types