. 2022 Nov 8;13(1):6732.
doi: 10.1038/s41467-022-34612-y.

Regulation of BRCA1 stability through the tandem UBX domains of isoleucyl-tRNA synthetase 1

Affiliations

Regulation of BRCA1 stability through the tandem UBX domains of isoleucyl-tRNA synthetase 1

Scisung Chung et al. Nat Commun. .

Abstract

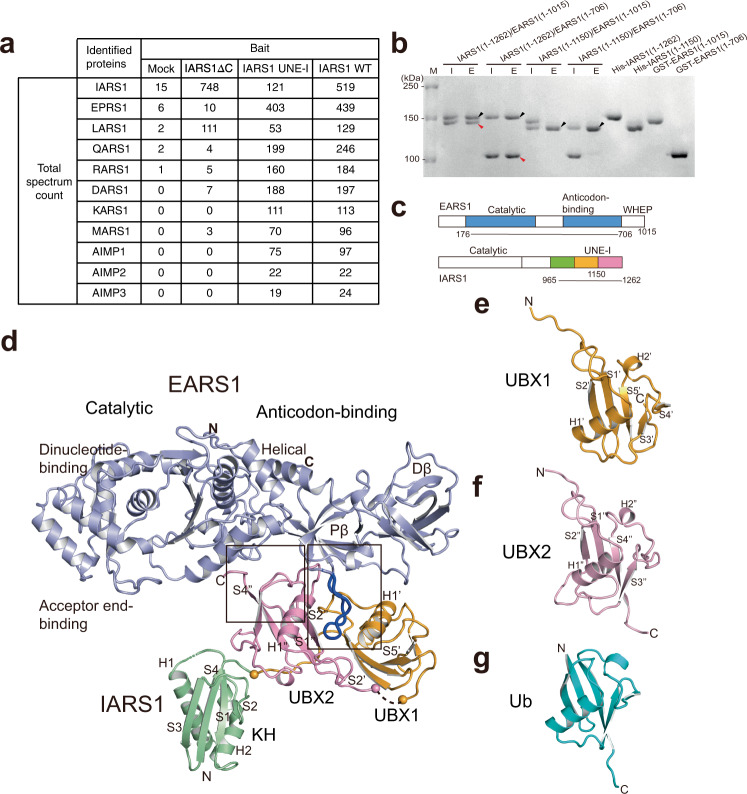
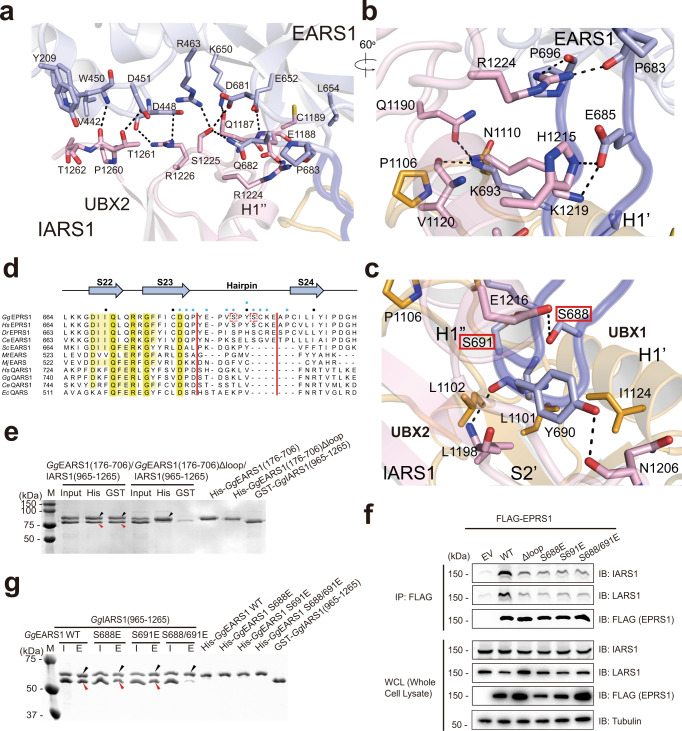
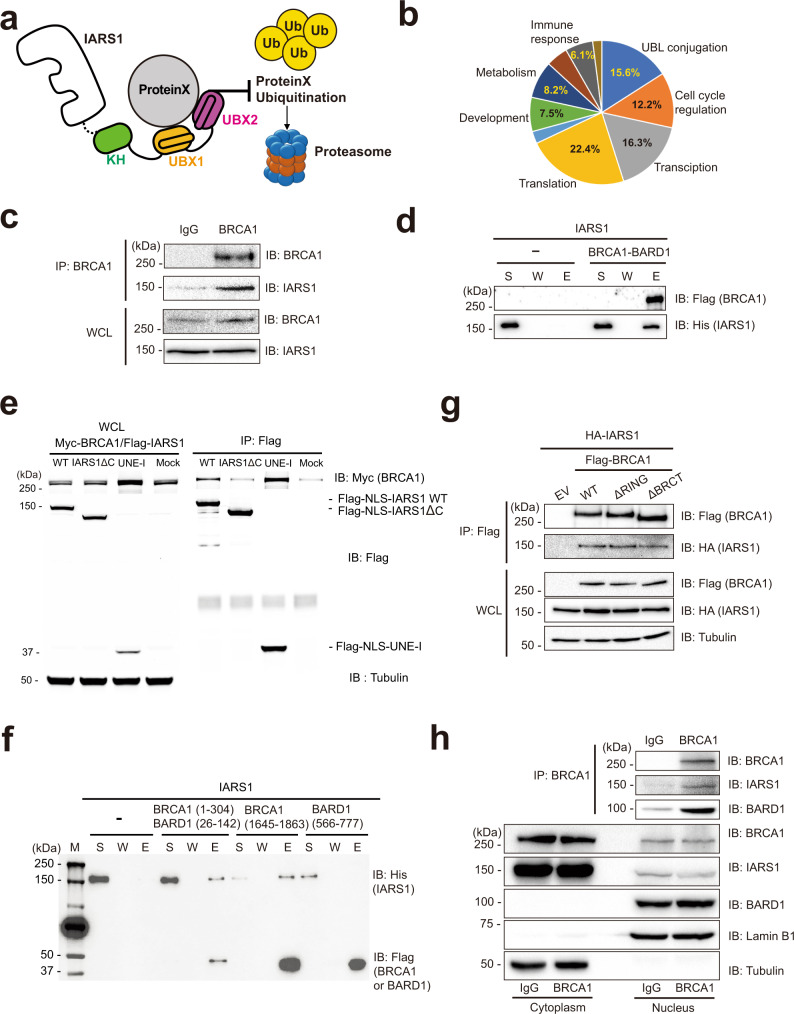
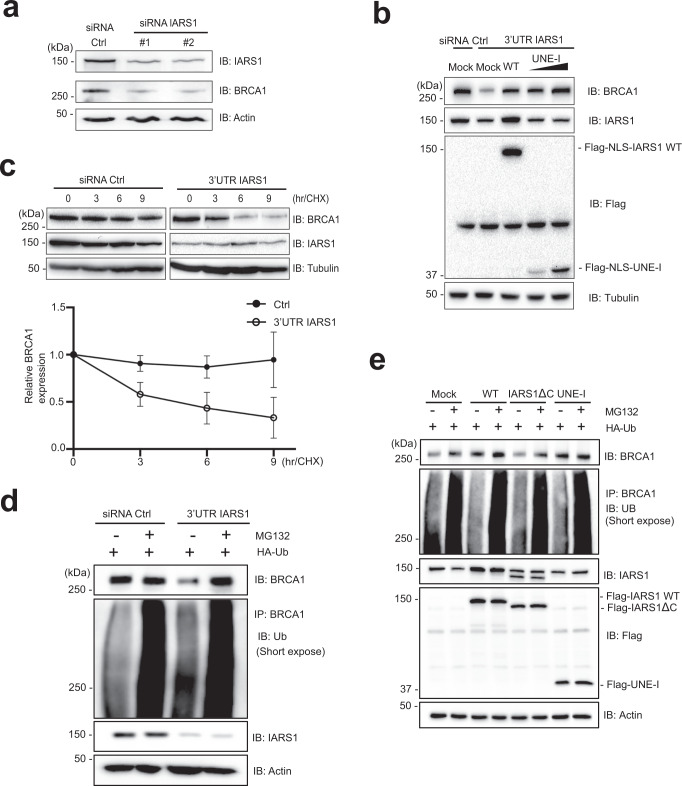
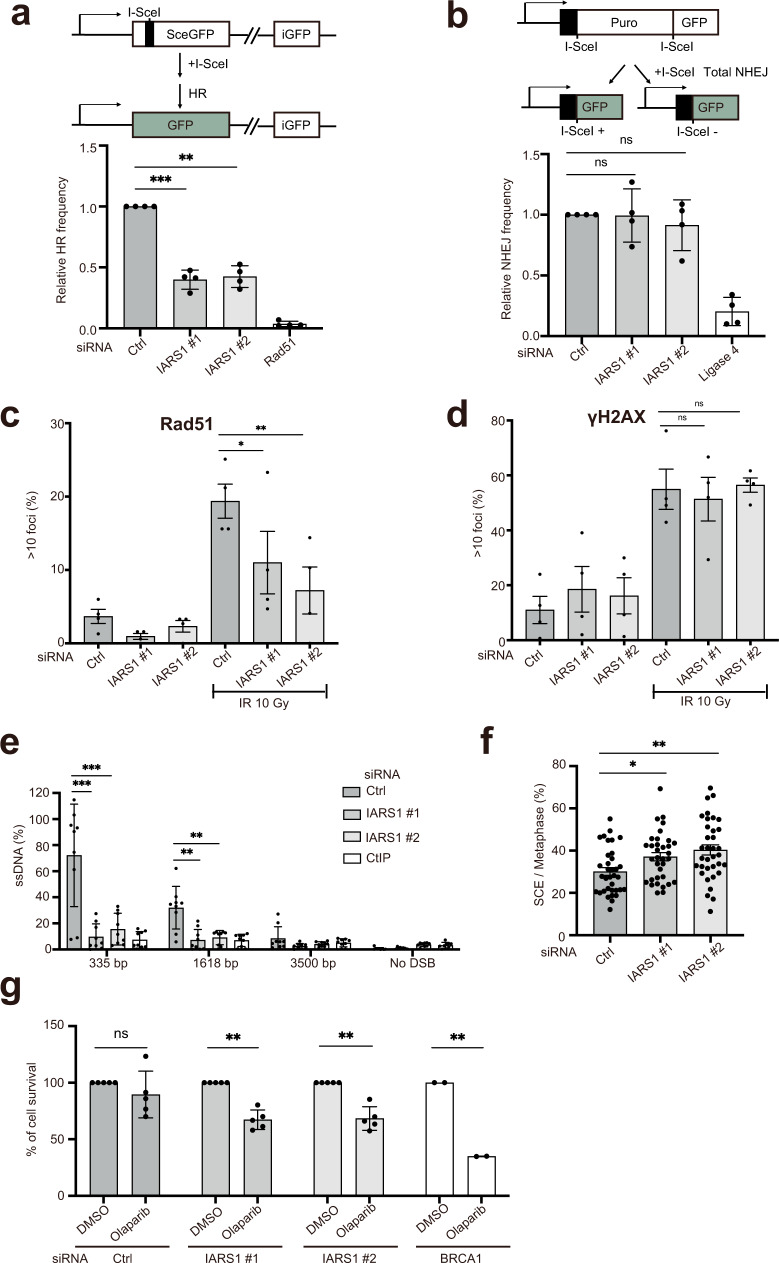
Aminoacyl-tRNA synthetases (ARSs) have evolved to acquire various additional domains. These domains allow ARSs to communicate with other cellular proteins in order to promote non-translational functions. Vertebrate cytoplasmic isoleucyl-tRNA synthetases (IARS1s) have an uncharacterized unique domain, UNE-I. Here, we present the crystal structure of the chicken IARS1 UNE-I complexed with glutamyl-tRNA synthetase 1 (EARS1). UNE-I consists of tandem ubiquitin regulatory X (UBX) domains that interact with a distinct hairpin loop on EARS1 and protect its neighboring proteins in the multi-synthetase complex from degradation. Phosphomimetic mutation of the two serine residues in the hairpin loop releases IARS1 from the complex. IARS1 interacts with BRCA1 in the nucleus, regulates its stability by inhibiting ubiquitylation via the UBX domains, and controls DNA repair function.


Conflict of interest statement

The authors declare no competing interests.

Figures

Fig. 1
Fig. 1. Overall structure of the EARS1–IARS1 complex.
a A list of MSC components identified by mass spectrometry. Total spectrum count of identified proteins interacting with IARS1ΔC, IARS1 UNE-I, or IARS1 WT is shown. b Affinity pull-down analysis of the interaction between EARS1 and IARS1. The input (I) and eluate (E) fractions were analyzed by SDS-PAGE and Coomassie Blue staining. Black and red arrowheads indicate eluted His-IARS1 and GST-EARS1, respectively. The data are representative of three independent experiments. Source data are provided as a Source Data file. c A schematic illustration of the architectures of EARS1 and IARS1. d Structure of the EARS1–IARS1 complex. The core regions of EARS1 (light blue) and IARS1 UNE-I (KH, green; UBX1, orange; and UBX2, pink) are shown at the top and bottom of the image, respectively. Close-up views of the boxed regions are shown in Fig. 2a–c. e–g Structures of UBX1 e, UBX2 f, and Ub g.
Fig. 2
Fig. 2. Interaction between the EARS1 hairpin loop and IARS1 UBX domains.
a Close-up view of the interface between EARS1 and IARS1 UBX2. b, c Close-up view of the interaction between the EARS1 hairpin loop and IARS1 UBX domains. Mutated residues in the pull-down analysis are indicated by red boxes. a–c Color schemes are same as those in Fig. 1d. H-bonds and ion-pairs are shown in black dots. d Structure-based sequence alignments of EARS1 and QARS1 orthologs. The secondary structure of GgEARS1 is displayed on top of the sequences. IARS1-contacting residues are indicated by blue circles. Every tenth residue is marked with a black dot. e In vitro pull-down assay of GgEARS1 and the IARS1 UNE-I domain. His-GgEARS1 or His-GgEARS1Δhairpin was pulled down with Ni-NTA resin, and co-precipitated GST-GgIARS1 was detected by Coomassie staining. Black and red arrowheads indicate eluted His-GgEARS1 and GST-GgIARS1, respectively. f Incorporation of EPRS1 phosphomimetic mutants into the MSC. Flag-tagged, full-length EPRS1 wild-type protein and the phosphomimetic (Ser-to-Glu, S-E) mutant were expressed in HEK293T cells by transient transfection. Lysates were immunoprecipitated with an anti-Flag antibody, and co-precipitated IARS1 or LARS1 was detected by immunoblotting with an anti-IARS1 or anti-LARS1 antibody. g Wild-type or phosphomimetic mutant His-GgEARS1 was pulled down with Ni-NTA resin, and co-precipitated GST-GgIARS1 was detected by Coomassie staining. Black and red arrowheads indicate eluted His-GgEARS1 and GST-GgIARS1, respectively. eg The data are representative of three independent experiments. Source data are provided as a Source Data file.
Fig. 3
Fig. 3. The UBX domains of IARS1 interact with the RING and BRCT domains of BRCA1 for protein stability.
a Schematic illustration of the hypothetical model by which IARS1 UBX domains protect partner proteins from proteasomal degradation. b The candidate proteins that interact with IARS1 were classified into several biological processes using the BioGrid database. c Immunoprecipitation of endogenous BRCA1 was performed with an anti-BRCA1 antibody in HCT116 cells. Co-precipitated endogenous IARS1 was detected by immunoblotting with an anti-IARS1 antibody. d In vitro affinity pull-down analysis of IARS1 with the BRCA1-BARD1 complex via the Flag tag of BRCA1. The supernatant (S), wash (W), and eluate (E) fractions were analyzed by immunoblotting with anti-Flag and anti-His antibodies. e Immunoassay of co-expressed Myc-BRCA1 and Flag-tagged full-length IARS1 or its various domains in HEK293T cells. Flag-IARS1 was immunoprecipitated with an anti-Flag antibody, and co-precipitated Myc-BRCA1 was detected by immunoblotting with an anti-Myc antibody. f In vitro pull-down assay of IARS1 and the following fragments of the BRCA1-BARD1 complex: RING-RING domains, BRCT domain of BRCA1, and BRCT domain of BARD1. g HEK293T cells were co-transfected with wild-type Flag-tagged BRCA1 or deletion mutants (ΔRING or ΔBRCT domain) and HA-tagged IARS1, and then immunoprecipitation was performed with an anti-Flag antibody. Co-precipitated IARS1 was detected by immunoblotting with an anti-HA antibody. h Co-IP analysis for the interaction between endogenous IARS1 and BRCA1 using a BRCA1-specific antibody in nuclear extract. c–h The data are representative of three independent experiments. Source data are provided as a Source Data file.
Fig. 4
Fig. 4. The UBX domains of IARS1 are responsible for BRCA1 stability.
a Protein extracts from HeLa cells transfected with control siRNA or two siRNAIARS1 were immunoblotted with anti-IARS1, anti-BRCA1, and anti-Actin (loading control) antibodies. b SV40 NLS fused wild-type IARS1 or -IARS1 UNE-I (residues 942-1262) was ectopically expressed following depletion of IARS1 using 3’UTR-specific siRNAIARS1. a, b The data were representative of three independent experiments. Source data are provided as a Source Data file. c The stability of BRCA1 in cells with or without IARS1 depletion was assessed by cycloheximide-chase analysis. HEK293T cells were transfected with control siRNA or 3’UTR-specific siRNAIARS1 and treated with 100 µg/mL cycloheximide. Lysates prepared at the indicated time points were immunoblotted with an anti-BRCA1 antibody. The graph shows relative levels of BRCA1 expression. Error bars indicate standard deviation (SD) of the mean (n = 3, independent cell cultures). d In vivo ubiquitylation assay of BRCA1 in transfected HEK293T cells with or without IARS1 depletion. The blot with short exposure is shown. HEK293T cells co-transfected with control siRNA or 3’UTR-specific siRNAIARS1 and Ub were treated with 10 µM MG132 for 4 hr and analyzed by immunoblotting with the indicated antibodies. BRCA1 immunoprecipitated with an anti-BRCA1 antibody was analyzed by immunoblotting with an anti-Ub antibody. Quantification of ubiquitylated BRCA1 and the blot with long exposure are shown in Supplementary Fig. 10a and c. e In vivo ubiquitylation assay of BRCA1 in HEK293T cells transfected with full-length IARS1, IARS1ΔC, and IARS1 UNE-I alone. The blot with short exposure is shown. HEK293T cells co-transfected with indicated cDNAs and Ub were treated with 10 µM MG132 for 4 h and analyzed by immunoblotting with the indicated antibodies. BRCA1 immunoprecipitated with an anti-BRCA1 antibody was analyzed by immunoblotting with an anti-Ub antibody. Quantification of ubiquitylated BRCA1 and the blot with long exposure are shown in Supplementary Fig. 10b and d. d, e The data are representative of three independent experiments. Source data are provided as a Source Data file.
Fig. 5
Fig. 5. Downregulation of BRCA1 upon IARS1 depletion leads to impaired DNA repair.
a Schematic of the DR-GFP reporter assay (top). I-SceI-DSB-induced HR efficiencies were determined in DR-U2OS cells upon treatment with control siRNA, two siRNAIARS1, or siRNARad51 (bottom). b Schematic of the EJ5-GFP reporter assay (top). The efficiency of NHEJ in EJ5-U2OS cells was measured after transfection of control, two siRNAIARS1, or siRNALigase4 (bottom). Data are represented as mean values ± SD (n = 4, independent experiments) in a and b. **P  <  0.01, ***P  <  0.001, ns, not significant by the analysis of two-tailed paired Student’s t-test. c Quantification of Rad51 foci in U2OS cells treated with control siRNA or two siRNAIARS1 after exposure to 10 Gy ionizing radiation (IR) or sham irradiation. d Quantification of γH2AX in nuclei of U2OS cells treated with control siRNA or two siRNAIARS1 after exposure to 10 Gy IR or sham irradiation. The mean values ± standard error of the mean of four (siRNA Ctrl and siRNAIARS1#1 and #2) independent experiments are shown in c and d. *P  <  0.05, **P  <  0.01, ns, not significant by the analysis of two-tailed paired Student’s t-test. e Quantification of resected ssDNA at DSB sites using the ER-AsiSI system upon treatment with control siRNA, two siRNAIARS1 or siRNACtIP. After 4-OHT treatment for 4 hr to induce DSBs, resected DNA was quantified by qPCR at the indicated nucleotides from AsiSI-induced DSBs. The mean values ± SD of three (siRNA Ctrl, siRNAIARS1#1 and #2, and CtIP) independent experiments are shown. **P  <  0.01, ***P  <  0.001 by the analysis of two-tailed paired Student’s t-test. f SCE analysis in HeLa cells treated with control siRNA or two siRNAIARS1. The mean values ± SD of SCE/Total metaphase chromosome (n = 35 cells) are shown. *P  <  0.05, **P  <  0.01 by the analysis of two-tailed paired Student’s t-test. g Clonogenic survival of HeLa cells upon treatment with control siRNA, two siRNAIARS1, or siRNABRCA1 was measured after continuous exposure to olaparib for about 2 weeks. The mean values ± SD of five (siRNA Ctrl and siRNAIARS1#1 and #2) or two (siRNABRCA1) independent experiments are shown. **P  <  0.01, ns, not significant by the analysis of two-tailed paired Student’s t-test. a–g Source data are provided as a Source Data file.

Similar articles

Cited by

References

    1. Ibba M, Söll D. Aminoacyl-tRNA synthesis. Annu. Rev. Biochem. 2000;69:617–650. - PubMed
    1. Guo M, Yang XL, Schimmel P. New functions of aminoacyl-tRNA synthetases beyond translation. Nat. Rev. Mol. Cell Biol. 2010;11:668–674. - PMC - PubMed
    1. Kim S, You S, Hwang D. Aminoacyl-tRNA synthetases and tumorigenesis: more than housekeeping. Nat. Rev. Cancer. 2011;11:708–718. - PubMed
    1. Guo M, Schimmel P. Essential nontranslational functions of tRNA synthetases. Nat. Chem. Biol. 2013;9:145–153. - PMC - PubMed
    1. Lo WS, et al. Human tRNA synthetase catalytic nulls with diverse functions. Science. 2014;345:328–332. - PMC - PubMed

Publication types

MeSH terms