. 2022 Nov 8;13(1):6755.
doi: 10.1038/s41467-022-34294-6.

The first mitotic division of human embryos is highly error prone

Affiliations

The first mitotic division of human embryos is highly error prone

Cerys E Currie et al. Nat Commun. .

Abstract

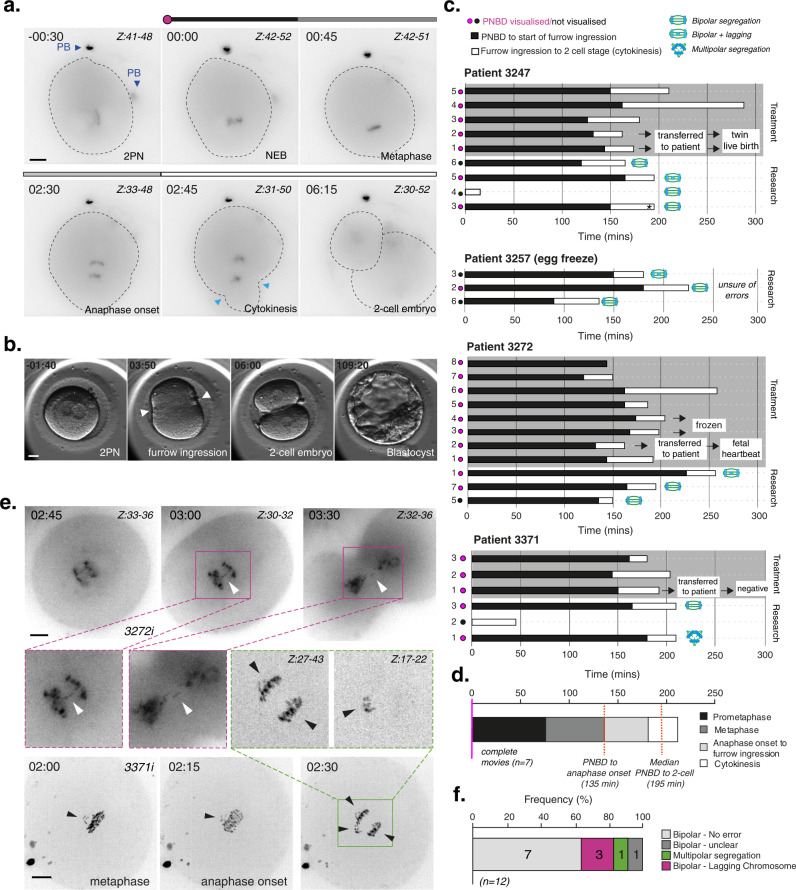
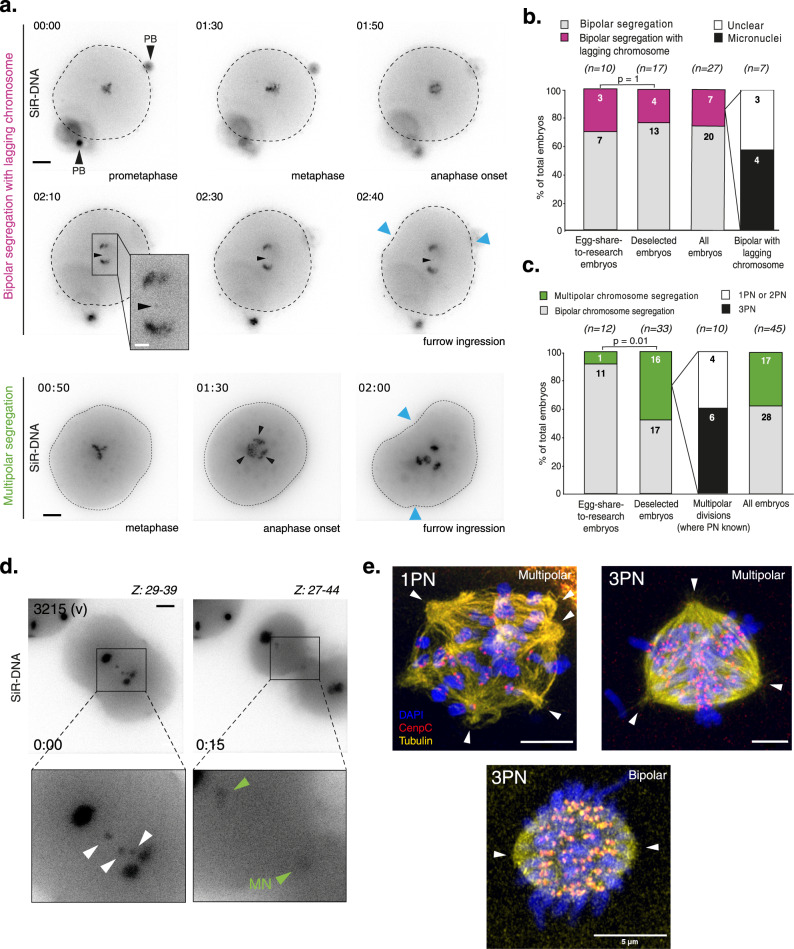
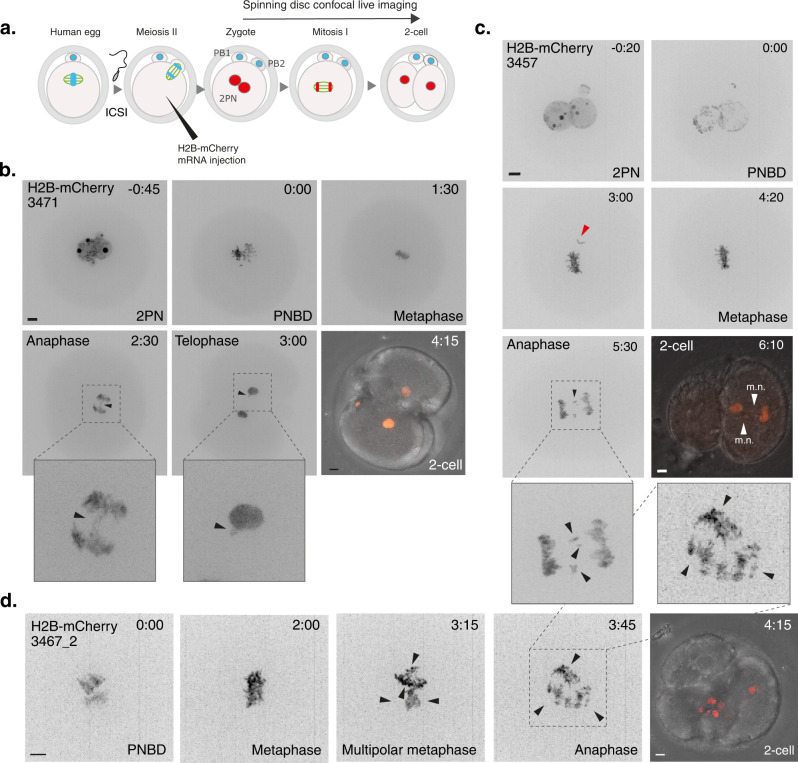
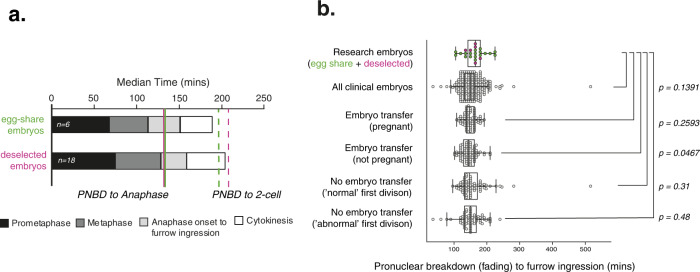
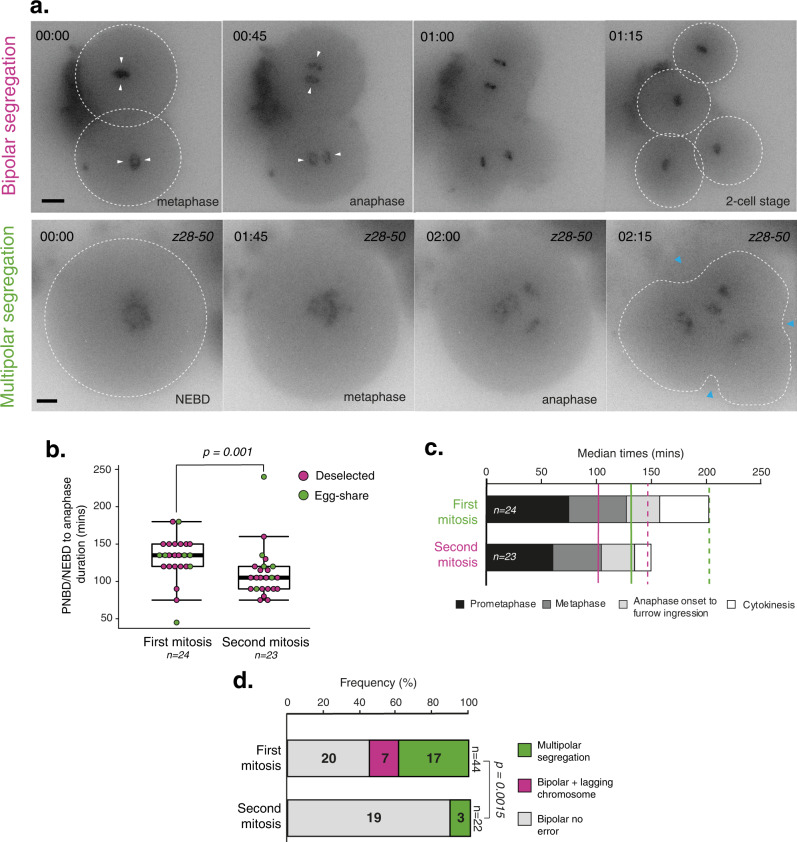
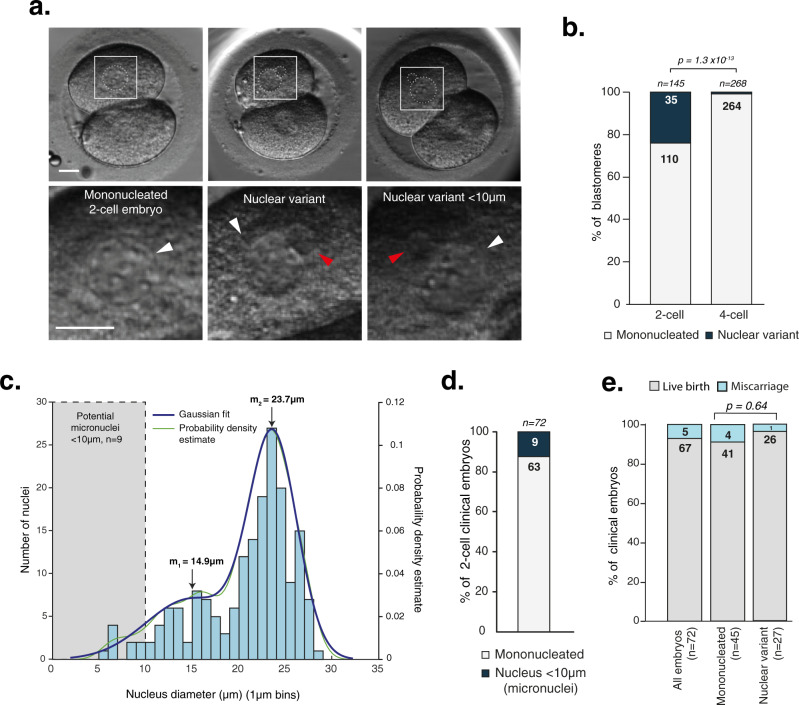
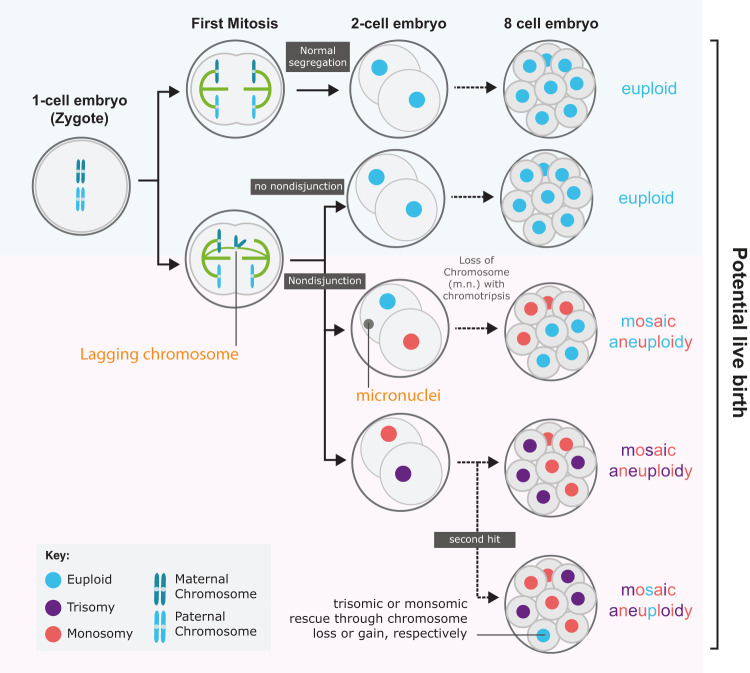
Human beings are made of ~50 trillion cells which arise from serial mitotic divisions of a single cell - the fertilised egg. Remarkably, the early human embryo is often chromosomally abnormal, and many are mosaic, with the karyotype differing from one cell to another. Mosaicism presumably arises from chromosome segregation errors during the early mitotic divisions, although these events have never been visualised in living human embryos. Here, we establish live cell imaging of chromosome segregation using normally fertilised embryos from an egg-share-to-research programme, as well as embryos deselected during fertility treatment. We reveal that the first mitotic division has an extended prometaphase/metaphase and exhibits phenotypes that can cause nondisjunction. These included multipolar chromosome segregations and lagging chromosomes that lead to formation of micronuclei. Analysis of nuclear number and size provides evidence of equivalent phenotypes in 2-cell human embryos that gave rise to live births. Together this shows that errors in the first mitotic division can be tolerated in human embryos and uncovers cell biological events that contribute to preimplantation mosaicism.


Conflict of interest statement

The authors declare no competing interests.

Figures

Fig. 1
Fig. 1. Clinical-grade human embryos display high levels of chromosome segregation errors during the first mitotic division.
a Time lapse imaging of a representative egg-share-to-research human embryo (3247iii) progressing through the first embryonic mitosis. Chromosomes are visualised using SiR-DNA dye. Z indicates slices shown as a maximum intensity projection. Time in hours:mins, scale bar 20 µm. Light blue arrows indicate onset of cleavage furrow ingression, PB = polar body. b Representative movie stills showing clinical EmbryoScope monitoring of an egg-share-to-research embryo used for patient treatment. White arrows denote onset of cleavage furrow ingression. Scale bar: 20 µm, time in hours:mins. c History plots of egg-share embryos; half used for patient treatment (grey background) and half donated to research (white background). Black and white bars denote timings of critical stages during the first embryonic mitosis. Pink/black dots indicate whether pronuclear break down (PNBD) was visualised during filming. Asterisk denotes images of embryo shown in (a). The research embryos of patients 3247, 3273 and 3257 were imaged using a widefield microscope, the research embryos of patient 3371 were imaged using a spinning disk microscope. Embryos with a black dot started dividing before imaging was started. d Median durations of each mitotic phase plotted consecutively from 7 complete egg-share embryos movies during the first mitosis. Red lines indicate median times for the population. e Time lapse imaging of an egg-share-to-research embryo undergoing the first embryonic mitosis in the presence of anaphase lagging chromosomes (purple boxes, white arrows) (3272i), and a multipolar division (3371i) (green boxes, black arrows). Chromosomes are visualised using SiR-DNA dye. Z indicates slices shown as a maximum intensity projection. Time in hours:mins, scale bar 20 µm. f Quantification of anaphase errors in egg-share-to-research embryos visualised by chromosome imaging. Source data are provided as a Source data file.
Fig. 2
Fig. 2. The first mitosis in deselected human embryos is highly error prone, consistent with clinical-grade embryos.
a Top panel: Time lapse imaging of a deselected human embryo progressing through the first embryonic mitosis with a lagging chromosome (Embryo 3004iii). Bottom panel: Time lapse imaging of a deselected human embryo of unknown pronuclei status progressing through the first embryonic mitosis with multipolar chromosome segregation (Embryo 3034vii). Chromosomes are visualised using SiR-DNA dye. Z indicates slices shown as a maximum intensity projection. Time in hours:mins, scale bar 20 µm. Blue arrows indicate onset of cleavage furrow ingression. Black arrows indicate polar bodies. All deselected embryos were imaged using a widefield microscope. b Quantification of embryos undergoing the first embryonic mitosis with bipolar chromosome segregation. N numbers are shown within bars. The number of embryos in which micronuclei clearly formed around lagging chromosomes are shown in the fourth bar. P value from a two-sided Fisher’s exact test. c Quantification of embryos undergoing bipolar or multipolar divisions in the first embryonic mitosis. N numbers are shown within bars. As deselected embryos can have varying numbers of pronuclei, this was detailed for embryos dividing with multipolar chromosome segregation (third bar). All egg-share-to-research embryos contain 2 pronuclei. P value from a two-sided Fishers exact test. d Time lapse imaging of a deselected human embryo progressing through the first embryonic mitosis in the presence of lagging chromosomes (white arrows), around which micronuclei form (green arrows). Chromosomes are visualised using SiR-DNA dye. Z indicates slices shown as a maximum intensity projection, time in hours:mins, scale bar 20 µm. (Embryo 3215 v). e Airyscan super-resolution confocal microscopy images of 1PN and 3PN human embryos fixed during the first mitotic division and stained with DAPI, CenpC and tubulin antibodies. White arrows indicate perceived MTOCS/spindle poles. Scale bar 5 µm. Source data are provided as a Source data file.
Fig. 3
Fig. 3. mRNA injected human embryos show errors consistent with SiR-DNA treatment.
a Schematic illustrating key steps for mRNA injection into human 0PN embryos. b Time lapse imaging of embryo 3471 progressing through the first mitotic division following mRNA injection. Chromosomes are visualised by H2B-mCherry expression. Scale bar 10 µm, time in hours:mins. H2B-mCherry intensity for merged image is visualised in a non-linear fashion for illustration purposes only. Zoom panels and arrows show lagging chromosomes at anaphase which persist at telophase. c Same as b, embryo 3457 that progressed through the first mitotic division after aligning the last chromosome (denoted with red arrow), but with multiple anaphase lagging chromosomes that go on form clear micronuclei (m.n.). Merged image shows DNA masses going to one blastomere suggestive of problems in cleavage furrow positioning. d Same as b, embryo 3467_2 that first aligned chromosomes in a single metaphase plate but then progressed through the first mitotic division by multipolar chromosome segregation with clear lagging chromosomes, forming aberrant nuclei in the merged image. Arrows denote multiple perceived spindle poles.
Fig. 4
Fig. 4. Deselected embryos have similar mitotic timing to clinical embryos.
a Median durations of each mitotic phase plotted consecutively from 6 complete egg-share embryos movies and 18 deselected embryo movies during the first mitosis. b Quantification of timing from PNBD or pronuclear fading to furrow ingression (start of cytokinesis) for complete movies of research embryos (deselected (pink) and egg-share (green), n = 24) and clinical embryos (imaged using EmbryoScope during patient treatment, grey background, n = 304). Box and whisker plots represent minimum, lower quartile, median, upper quartile and maximum. Outliers fall beyond these lines. Individual data points are overlaid. Clinical embryos fall into four categories: singly transferred embryos which gave rise to clinical pregnancy, singly transferred embryos which did not give rise to clinical pregnancy, non-transferred embryos which divided normally into 2 cells, and non-transferred embryos which divided into 3 or more cells in the first division. 95% confidence intervals (bottom–top, min): Research 149.61–176.63, All embryos 146.57–154.38, transferred pregnant 144.14–152.4, Transferred not pregnant 139.86–150.19, Non-transferred normal first division 146.06–169.24, Non-transferred abnormal 142.55–158.86. Whole data P value from the Kruskal–Wallis test is 0.1151. Pairwise P values from Kruskal–Wallis test with post hoc Dunn’s test. Source data are provided as a Source data file.
Fig. 5
Fig. 5. Comparing the first and second mitotic divisions of human embryos.
a Time lapse imaging of representative deselected human embryos progressing through the second embryonic mitosis with bipolar division (top) and multipolar division (below). White arrows indicate bipolar segregation and white circles indicate cell outline. Chromosomes are visualised using SiR-DNA dye, time in hours:mins. Blue arrows indicate onset of cleavage furrow ingression, scale bar 20 µm. b Quantification of the timing from PNBD/NEBD to anaphase onset of deselected and egg-sharer embryos undergoing the first or second mitosis. P value from a two-sided Mann–Whitney U-test. N refers to the number of filmed embryos included in dataset. Box and whisker plots represent minimum, lower quartile, median, upper quartile and maximum. Outliers fall beyond these lines. Individual data points are overlaid. c Median durations of each mitotic phase plotted consecutively to compare complete mitosis 1 and mitosis 2 movies, including both egg-share and deselected embryos. Solid lines indicate median NEBD to anaphase onset duration, dashed lines indicate median NEBD to 2/4-cell duration. d Quantification of anaphase errors (multipolar chromosome segregation and lagging chromosomes), occurring during the first mitosis (n = 44) or second mitosis (n = 23) in deselected and egg-share embryos. Chromosome segregation errors could not be accurately quantified in one mitosis 1 and 2 division respectively, so these were excluded from this analysis. P value from a two-sided Fishers exact test. Source data are provided as a Source data file.
Fig. 6
Fig. 6. Nuclear defects arising in the first embryonic mitosis are compatible with live birth.
a Clinical EmbryoScope movie stills of 2-cell clinical embryos which gave rise to pregnancies (foetal heartbeat detected), with different nucleation status. Nuclei are outlined in white. Scale bars 20 µm. White arrows label ‘normal’ sized nuclei, red arrow labels a nuclear variant. Further example movies are provided on OMERO, see methods for details. b Quantification of blastomeres in 2-cell clinical embryos which are either mononucleated or displayed nuclear defects (first bar). The nucleation status of these same embryos was quantified at the 4-cell stage (second bar). P value from a two-sided Fishers exact test. c Histogram showing size distribution of all nuclei measured in 2-cell embryo blastomeres, grouped into 1 µm bins. Gaussian distribution plotted using MATLAB Ezyfit Toolkit: Output parameters: a_1 = 0.028372, a_2 = 0.10168, m_1 = 14.964 µm, m_2 = 23.71 µm, s_1 = 4.8823 µm, s_2 = 2.5808 µm d Quantification of the number of 2-cell embryos containing nuclei <10 µm (micronuclei). Only embryos where nuclei in both blastomeres could be quantified are included. e Quantification of pregnancy outcomes from the same group of clinical embryos related to phenotype at the 2-cell stage (only embryos where both blastomeres could be measured). Miscarriage occurred after foetal heartbeat detection at 7 weeks. P value from a two-sided Fishers exact test. Source data are provided as a Source data file.
Fig. 7
Fig. 7. Model of how first division errors can lead to different euploid/aneuploid embryos.
Top row, a pair of homologous chromosomes (blue) are correctly segregated into the 2-cell embryo. Subsequent divisions (dotted black arrow), if occurring without error, would lead to an 8-cell embryo in which all blastomeres are euploid (blue). Second row; Non-disjunction during the first mitosis would result in trisomic and monosomic blastomeres (purple and red) with two potential outcomes: upper—lagging chromosome becomes a micronucleus (m.m.) that undergoes chromothripsis and potential chromosome loss. Outcome is euploid (blue) and monosomic (red) lineages in 8-cell (and beyond) embryo. Lower—without chromosome loss the outcome is a mosaic embryo with monosomic and trisomic lineages (purple and red). Such aneuploid lineages may be rescued in later divisions through further ‘second hit’ non-disjunction, possibly resulting in euploid blastomeres with a uniparental disomy signature.

Similar articles

Cited by

References

    1. Boklage CE. Survival probability of human conceptions from fertilization to term. Int. J. Fertil. 1990;35:75–94. - PubMed
    1. Hyde KJ, Schust DJ. Genetic considerations in recurrent pregnancy loss. Cold Spring Harb. Perspect. Med. 2015;5:1–18. - PMC - PubMed
    1. Soler A, et al. Overview of chromosome abnormalities in first trimester miscarriages: a series of 1,011 consecutive chorionic villi sample karyotypes. Cytogenet. Genome Res. 2017;152:81–89. - PubMed
    1. Hassold T, Hunt P. To err (meiotically) is human: the genesis of human aneuploidy. Nat. Rev. Genet. 2001;2:280–291. - PubMed
    1. Holubcová Z, Blayney M, Elder K, Schuh M. Error-prone chromosome-mediated spindle assembly favors chromosome segregation defects in human oocytes. Science. 2015;348:1143–1147. - PMC - PubMed

Publication types