. 2022 Nov 8;12(1):18991.
doi: 10.1038/s41598-022-18097-9.

New definitions of human lymphoid and follicular cell entities in lymphatic tissue by machine learning

Affiliations

New definitions of human lymphoid and follicular cell entities in lymphatic tissue by machine learning

Patrick Wagner et al. Sci Rep. .

Abstract

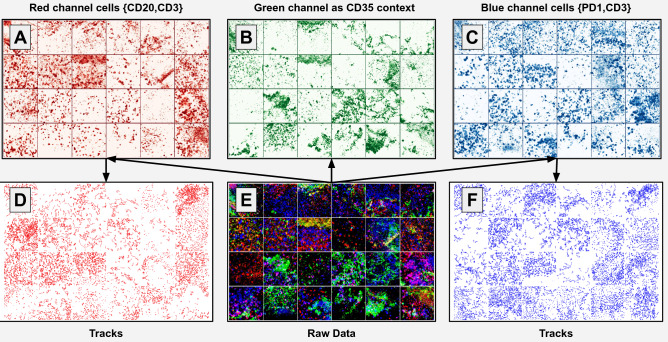
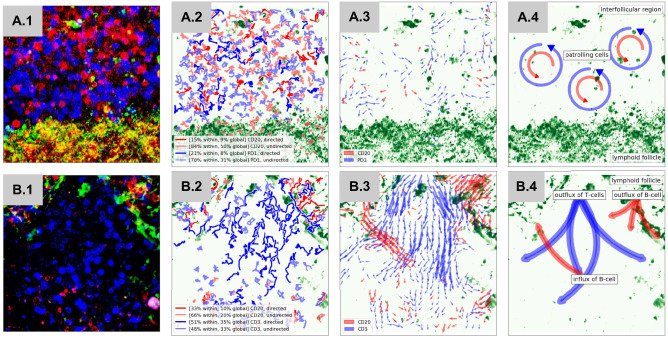
Histological sections of the lymphatic system are usually the basis of static (2D) morphological investigations. Here, we performed a dynamic (4D) analysis of human reactive lymphoid tissue using confocal fluorescent laser microscopy in combination with machine learning. Based on tracks for T-cells (CD3), B-cells (CD20), follicular T-helper cells (PD1) and optical flow of follicular dendritic cells (CD35), we put forward the first quantitative analysis of movement-related and morphological parameters within human lymphoid tissue. We identified correlations of follicular dendritic cell movement and the behavior of lymphocytes in the microenvironment. In addition, we investigated the value of movement and/or morphological parameters for a precise definition of cell types (CD clusters). CD-clusters could be determined based on movement and/or morphology. Differentiating between CD3- and CD20 positive cells is most challenging and long term-movement characteristics are indispensable. We propose morphological and movement-related prototypes of cell entities applying machine learning models. Finally, we define beyond CD clusters new subgroups within lymphocyte entities based on long term movement characteristics. In conclusion, we showed that the combination of 4D imaging and machine learning is able to define characteristics of lymphocytes not visible in 2D histology.


Conflict of interest statement

The authors declare no competing interests.

Figures

Figure 1
Figure 1
Unique 4D Dataset of lymphocytes inside fresh human lymphoid tissue sections. (E) represents the raw data (totaling 24 video sequences where only the first frame is shown). Each sample (i.e.  a single video sequence) consists of three channels (AC). Channel B shows CD35 positive follicular dendritic cells, which were used for context analysis. Channel A and C describe a single stain among T-cells (CD3), B-cells (CD20), and follicular T-helper cells (PD1). Moreover, from these channels, cell tracking data is extracted. Specifically, the cell tracks shown in (D) and (F) are computed from T- and B-cells, respectively. More details are described in “Material and methods”.
Figure 2
Figure 2
Movement and morphology of lymphocytes in human lymphoid tissue. Column A describes the analysis of the lymphocyte motility based on cell tracks. (A.1) visualizes the definition of the inspected features, turning angle and step size per time frame, later called velocity. (A.2) shows the results of the analysis. Column B describes the morphological analysis of lymphocytes based on cell tracks. (B.1) displays the features used for morphological descriptions, ellipse, to represent the eccentricity and major axis, later defined as cell size. On the upper left of (B.2), the size of each cell type is visualized. Conclusively, column C displays the analysis of CD35 positive follicular dendritic cells (FDC). (C.1) visualizes the major concept of optical flow to determine on spot FDC velocity. (C.2) shows the positive correlation of FDC velocity related to lymphocyte velocity in the microenvironment.
Figure 3
Figure 3
In silico prototypes of cell entities and its environment based on supervised machine learning models. Here, prototypes are defined as most predictive samples from inter-patient experiments. The top row visualizes the morphological and environmental prototypes of cell entity derived from convolutional neural networks. Red pixel highlight most predictive pixels computed by LRP analysis of the respective discriminative machine learning model. The bottom row displays the most typical tracks per cell type based on Logistic Regression Analysis.
Figure 4
Figure 4
The definition of motion-specific subsets of cell types. The so called data-driven clusters (DD-cluster), directed and undirected, are based on eight most discriminative features derived from binary logistic regression experiment CD20 vs CD3, shown in (A). (B) displays the composition of DD-clusters per cell type, defined by unsupervised machine learning. Conclusively, (CE) visualize the data enrichment based on movement and machine learning. (C) shows information given by conventional immunohistochemistry. (D) visualizes the information given by immunohistochemistry enriched with movement and computer vision. (E) visualizes information facilitating immunohistochemistry, movement, computer vision and machine learning.
Figure 5
Figure 5
Functional information hidden in the context of cell movement. The rows A and B show the full evaluation of two videos, including traditional 2D morphology and the new movement characteristics. (A.1) shows a dense region near follicular dendritic cells filled with B cells and PD1 positive cells. (B.1) represents a sparse region mainly filled with T cells. The morphologies of the present cells are round and compact. Inspecting tracks and DD clusters of B and T cells inside both regions (A.2 and B.2), we can see an over representation of long and directed tracks inside (B.2). compared to (A.2). The over representation of directed DD clusters indicate a more active region. These hints can be confirmed by the collective behaviour of B cells, T cells and PD1 positive cells. We visualized the optical flow of the last 30 frames of Video A (A.3) and B (B.3). A.3 reveals a localized circular movement pattern indicating patrolling cells inside an interfollicular region, schematically show in figure (A.4). (B.3) reveals an in and outflux of T cells and B cells from a lymphoid follicle, schematically shown in figure (B.4). Here, we can show, that DD clusters and collective movement patterns has the possibility to reveal cellular states and functions, which can not be detected by the evaluation of cell morphologies inside static images.

Similar articles

Cited by

References

    1. Germain RN, Robey EA, Cahalan MD. A decade of imaging cellular motility and interaction dynamics in the immune system. Science. 2012;336:1676–1681. doi: 10.1126/science.1221063. - DOI - PMC - PubMed
    1. Reif K, et al. Balanced responsiveness to chemoattractants from adjacent zones determines b-cell position. Nature. 2002;416:94–99. doi: 10.1038/416094a. - DOI - PubMed
    1. Allen CD, Okada T, Cyster JG. Germinal-center organization and cellular dynamics. Immunity. 2007;27:190–202. doi: 10.1016/j.immuni.2007.07.009. - DOI - PMC - PubMed
    1. Bajénoff M, Germain RN. Seeing is believing: A focus on the contribution of microscopic imaging to our understanding of immune system function. Eur. J. Immunol. 2007;37:S18–S33. doi: 10.1002/eji.200737663. - DOI - PubMed
    1. Bajénoff M, et al. Highways, byways and breadcrumbs: Directing lymphocyte traffic in the lymph node. Trends Immunol. 2007;28:346–352. doi: 10.1016/j.it.2007.06.005. - DOI - PubMed

Publication types