

Mendelian randomization study reveals a causal relationship between adiponectin and LDL cholesterol in Africans
- PMID: 36347891
- PMCID: PMC9643497
- DOI: 10.1038/s41598-022-21922-w
Mendelian randomization study reveals a causal relationship between adiponectin and LDL cholesterol in Africans
Abstract
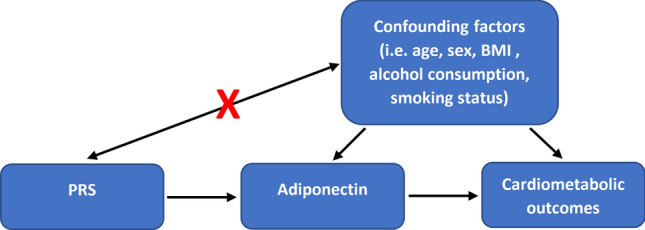
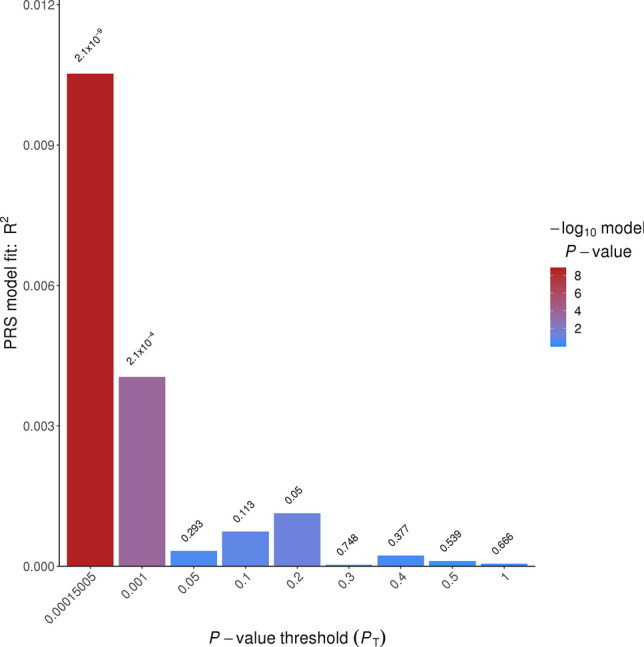
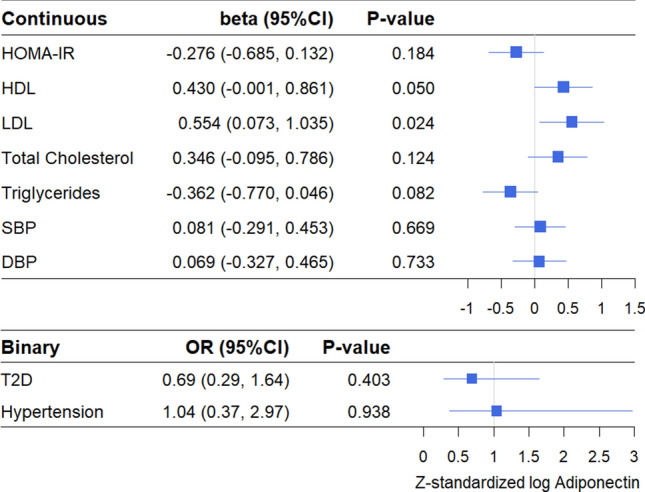
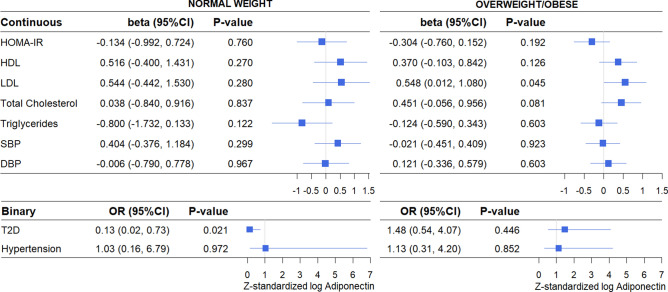
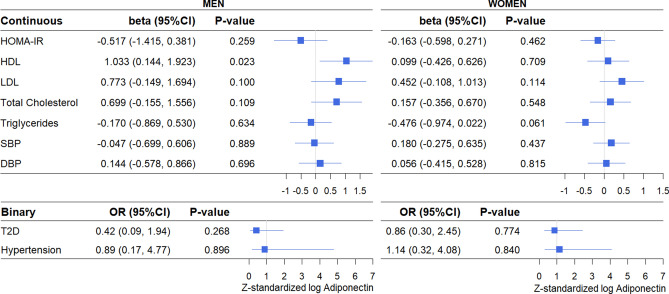
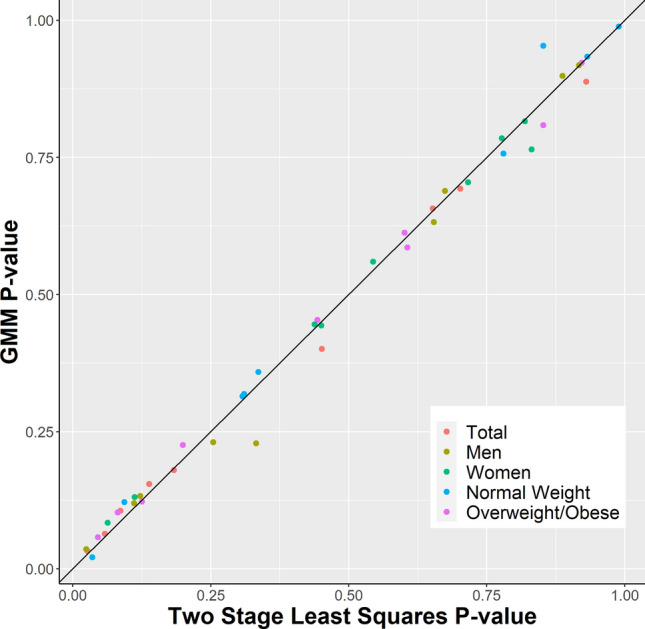
Adiponectin has been associated with cardiometabolic traits in observational studies across populations, yet it is unclear if these associations are causal. We performed Mendelian randomization (MR) analysis to assess the relationship between adiponectin and cardiometabolic traits in sub-Saharan Africans. We constructed a polygenic risk score (PRS) for adiponectin levels across 3354 unrelated sub-Saharan Africans. The PRS was used as the instrumental variable in two-stage least-squares MR analysis to assess its association with insulin resistance, HDL, LDL, total cholesterol, triglycerides, blood pressure, Type 2 Diabetes (T2D), and hypertension. The adiponectin PRS was causally related with LDL (β = 0.55, 95%CI 0.07-1.04, P-value = 0.024) but not the other traits. This association was observed in both overweight/obese and normal weight individuals, but only reached statistical significance among overweight/obese individuals (β = 0.55, 95%CI 0.01-1.08, P-value = 0.045). In normal weight individuals, the adiponectin PRS was associated with T2D (OR = 0.13, 95%CI 0.02-0.73, P-value = 0.021), and in men with HDL (β = 1.03, 95%CI 0.14-1.92, P-value = 0.023). The findings of this first MR study in sub-Saharan Africans support a causal relationship of adiponectin with LDL, with T2D in normal weight individuals only, and with HDL in men only. These observations add to the small but growing literature on adiponectin MR studies.
© 2022. This is a U.S. Government work and not under copyright protection in the US; foreign copyright protection may apply.
Conflict of interest statement
The authors declare no competing interests.
Figures
Similar articles
-
Mendelian randomization analyses suggest a causal role for circulating GIP and IL-1RA levels in homeostatic model assessment-derived measures of β-cell function and insulin sensitivity in Africans without type 2 diabetes.Genome Med. 2023 Dec 4;15(1):108. doi: 10.1186/s13073-023-01263-7. Genome Med. 2023. PMID: 38049854 Free PMC article.
-
Effects of metabolic factors in mediating the relationship between Type 2 diabetes and depression in East Asian populations: A two-step, two-sample Mendelian randomization study.J Affect Disord. 2023 Aug 15;335:120-128. doi: 10.1016/j.jad.2023.04.114. Epub 2023 May 6. J Affect Disord. 2023. PMID: 37150218
-
Causal Association of Obesity and Dyslipidemia with Type 2 Diabetes: A Two-Sample Mendelian Randomization Study.Genes (Basel). 2022 Dec 19;13(12):2407. doi: 10.3390/genes13122407. Genes (Basel). 2022. PMID: 36553674 Free PMC article.
-
Investigating the causal relationships between excess adiposity and cardiometabolic health in men and women.Diabetologia. 2023 Feb;66(2):321-335. doi: 10.1007/s00125-022-05811-5. Epub 2022 Oct 12. Diabetologia. 2023. PMID: 36221008 Free PMC article.
-
Associations of sleep with cardiometabolic risk factors and cardiovascular diseases: An umbrella review of observational and mendelian randomization studies.Sleep Med Rev. 2024 Oct;77:101965. doi: 10.1016/j.smrv.2024.101965. Epub 2024 May 31. Sleep Med Rev. 2024. PMID: 39137553
Cited by
-
Serum Adiponectin and Leptin Among Ghanaian Migrants in Amsterdam and Their Compatriots in Rural and Urban Ghana: The RODAM Study.Clin Med Insights Endocrinol Diabetes. 2023 Dec 15;16:11795514231218592. doi: 10.1177/11795514231218592. eCollection 2023. Clin Med Insights Endocrinol Diabetes. 2023. PMID: 38107873 Free PMC article.
-
Polygenic Risk Score in African populations: progress and challenges.F1000Res. 2023 Apr 11;11:175. doi: 10.12688/f1000research.76218.2. eCollection 2022. F1000Res. 2023. PMID: 37273966 Free PMC article. Review.
References
-
- World Health Organization . Global status report on noncommunicable diseases 2010. WHO; 2011.
-
- International Diabetes Federation. IDF Diabetes Atlas, Eighth edition. (2017).
-
- FAO, IFAD, UNICEF, WFP and WHO. The State of Food Security and Nutrition in the World 2017. Building resilience for peace and food security (FAO, Rome, Italy, 2017).
Publication types
MeSH terms
Substances
Grants and funding
LinkOut - more resources
Full Text Sources
Medical
