. 2022 Nov 8;9(1):678.
doi: 10.1038/s41597-022-01558-1.

A curated collection of human vaccination response signatures

Affiliations

A curated collection of human vaccination response signatures

Kenneth C Smith et al. Sci Data. .

Abstract

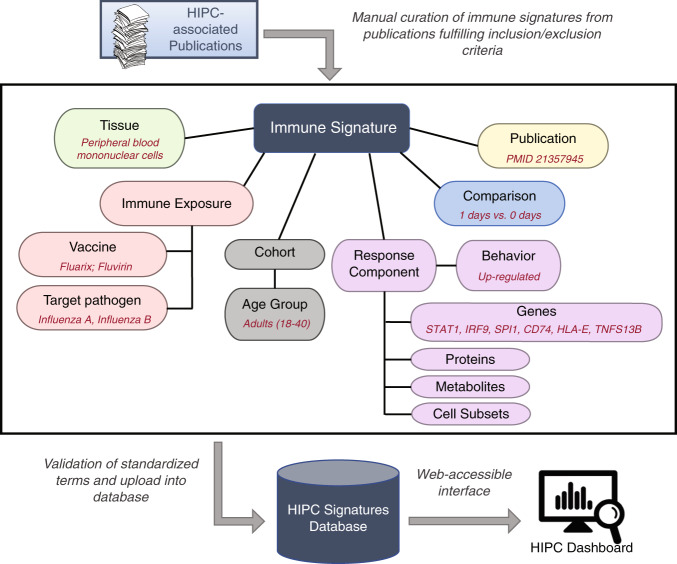
Recent advances in high-throughput experiments and systems biology approaches have resulted in hundreds of publications identifying "immune signatures". Unfortunately, these are often described within text, figures, or tables in a format not amenable to computational processing, thus severely hampering our ability to fully exploit this information. Here we present a data model to represent immune signatures, along with the Human Immunology Project Consortium (HIPC) Dashboard ( www.hipc-dashboard.org ), a web-enabled application to facilitate signature access and querying. The data model captures the biological response components (e.g., genes, proteins, cell types or metabolites) and metadata describing the context under which the signature was identified using standardized terms from established resources (e.g., HGNC, Protein Ontology, Cell Ontology). We have manually curated a collection of >600 immune signatures from >60 published studies profiling human vaccination responses for the current release. The system will aid in building a broader understanding of the human immune response to stimuli by enabling researchers to easily access and interrogate published immune signatures.


Conflict of interest statement

S.H.K. receives consulting fees from Northrop Grumman and Peraton. The remaining authors declare no competing interests.

Figures

Fig. 1
Fig. 1
Overview of the manual curation process for extracting immune signatures from relevant publications into the HIPC signatures database and a web-accessible HIPC Dashboard. The middle panel highlights the various fields that are captured for a given immune signature, with examples provided in red font. Key fields are standardized using existing ontologies or pre-defined criteria in order to capture a wide array of signatures.
Fig. 2
Fig. 2
HIPC Dashboard web interface. (a) Subject page for cell type “CD4-positive, alpha-beta T cell” showing a link-out to the Cell Ontology, the filtering box to further narrow the displayed observations, and the first two observation summaries (“Related observations”). (b) Partial view of a details page for a CD4-positive, alpha-beta T cell observation. For each controlled term, its name, plus its class, role, and description are shown. Linked pages list details from the relevant ontology and list all observations containing that term. The class equates to its controlled vocabulary type; values are cell subset, gene, pathogen, and vaccine. Roles are used to further differentiate how each term, whether controlled or standardized, is being used. Among the classes in the HIPC Dashboard, only the class “cell subset” has more than one role, these being “tissue” and “cell_biomarker”. Full metadata, not shown here, is contained in the table labeled “Evidence” at the bottom.
Fig. 3
Fig. 3
Summarization of HIPC Dashboard contents. Signature size distributions showing the number of response components across (a) gene and (b) cell type signatures. (c) Word cloud of the top 50 most frequent gene symbols and (d) top 10 most frequent cell types, where size corresponds to the total number of observations in the Dashboard. (e) Heatmap of recurring genes across vaccines targeting different pathogens. Temporally associated genes in adult whole blood or PBMCs were filtered to those with signatures for six or more pathogens. Color indicates up (red) or down (blue) regulation. Genes with opposing directions in multiple studies were marked ‘trends up’ or ‘trends down’ according to the most common direction (or marked ‘no consensus’ for perfect ties).

References

    1. Edgar R, Domrachev M, Lash AE. Gene Expression Omnibus: NCBI gene expression and hybridization array data repository. Nucleic Acids Res. 2002;30:207–210. doi: 10.1093/nar/30.1.207. - DOI - PMC - PubMed
    1. Bhattacharya S, et al. ImmPort, toward repurposing of open access immunological assay data for translational and clinical research. Sci Data. 2018;5:180015. doi: 10.1038/sdata.2018.15. - DOI - PMC - PubMed
    1. Bucasas KL, et al. Early patterns of gene expression correlate with the humoral immune response to influenza vaccination in humans. The Journal of infectious diseases. 2011;203:921–929. doi: 10.1093/infdis/jiq156. - DOI - PMC - PubMed
    1. Shah N, et al. A crowdsourcing approach for reusing and meta-analyzing gene expression data. Nat. Biotechnol. 2016;34:803–806. doi: 10.1038/nbt.3603. - DOI - PMC - PubMed
    1. Chen EY, et al. Enrichr: interactive and collaborative HTML5 gene list enrichment analysis tool. BMC Bioinformatics. 2013;14:128. doi: 10.1186/1471-2105-14-128. - DOI - PMC - PubMed

Publication types