. 2022 Nov 8;20(1):514.
doi: 10.1186/s12967-022-03729-5.

Genome-wide profiling of retroviral DNA integration and its effect on clinical pre-infusion CAR T-cell products

Affiliations

Genome-wide profiling of retroviral DNA integration and its effect on clinical pre-infusion CAR T-cell products

Lipei Shao et al. J Transl Med. .

Abstract

Background: Clinical CAR T-cell therapy using integrating vector systems represents a promising approach for the treatment of hematological malignancies. Lentiviral and γ-retroviral vectors are the most commonly used vectors in the manufacturing process. However, the integration pattern of these viral vectors and subsequent effect on CAR T-cell products is still unclear.

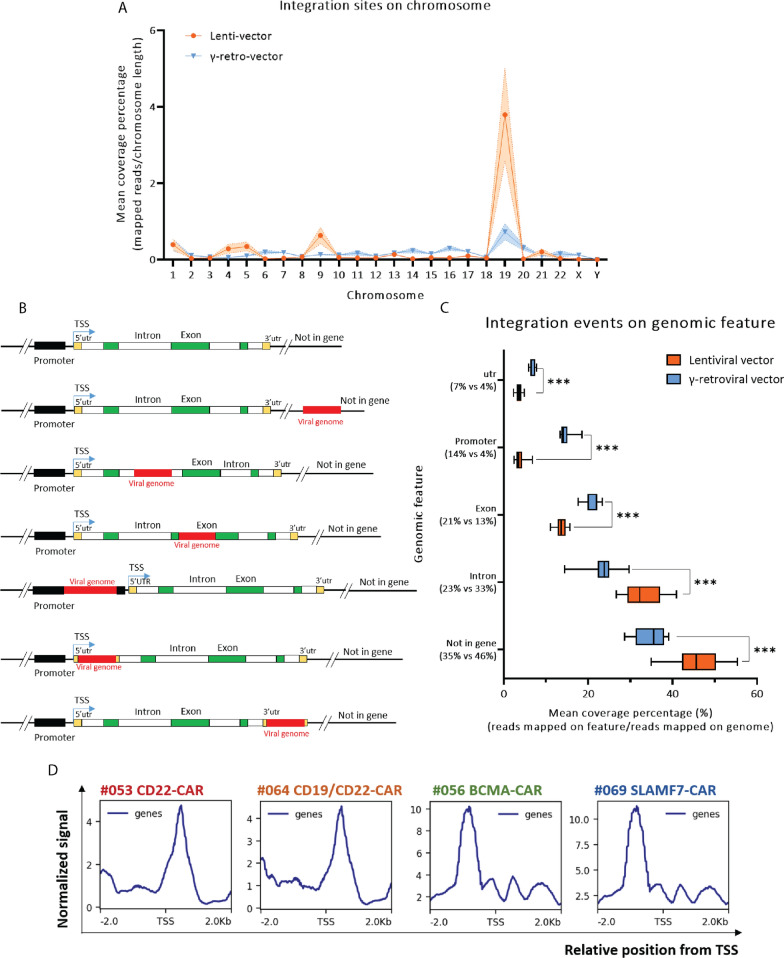
Methods: We used a modified viral integration sites analysis (VISA) pipeline to evaluate viral integration events around the whole genome in pre-infusion CAR T-cell products. We compared the differences of integration pattern between lentiviral and γ-retroviral products. We also explored whether the integration sites correlated with clinical outcomes.

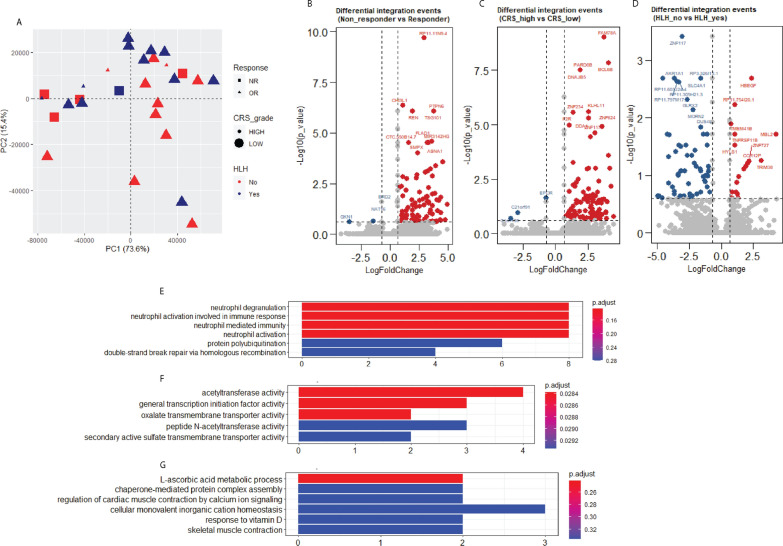
Results: We found that γ-retroviral vectors were more likely to insert than lentiviral vectors into promoter, untranslated, and exon regions, while lentiviral vector integration sites were more likely to occur in intron and intergenic regions. Some integration events affected gene expression at the transcriptional and post-transcriptional level. Moreover, γ-retroviral vectors showed a stronger impact on the host transcriptome. Analysis of individuals with different clinical outcomes revealed genes with differential enrichment of integration events. These genes may affect biological functions by interrupting amino acid sequences and generating abnormal proteins, instead of by affecting mRNA expression. These results suggest that vector integration is associated with CAR T-cell efficacy and clinical responses.

Conclusion: We found differences in integration patterns, insertion hotspots and effects on gene expression vary between lentiviral and γ-retroviral vectors used in CAR T-cell products and established a foundation upon which we can conduct further analyses.


Conflict of interest statement

The authors declare no competing interests.

Figures

Fig. 1
Fig. 1
Overview of viral integration site analysis (VISA) pipeline. A simplified diagram of the viral integration site analysis pipeline. The process starts with genomic DNA extracted from CAR T-cell products. All details are described in Materials and Methods
Fig. 2
Fig. 2
Genome-wide integration patterns of γ-retroviral and lentiviral vectors.A The percentage of viral integration sites on each human chromosome in CAR T-cells produced with lentiviral and γ-retroviral vectors is shown. B A scheme of expected integration sites in different genomic features. The viral genome is labeled as red rectangles. C The bar chart depicts the percentage of integration sites found in the intron, exon, promoter, untranslated region (utr, which includes 3’utr and 5’utr), and not in the gene region in all products. The x-axis represents mean coverage percentage (%). The y-axis represents each genomic feature. The number under each genomic feature in y-axis represents the mean coverage number of all samples in γ-retroviral vector group and lentiviral vector group. Data in boxplot were analyzed by using two-tailed unpaired Student’s t-Test. ***p < 0.001. D Representative patterns from 4 different CAR T-cell products showing the relative position of viral integration from the transcription start site (TSS). #053 CD22-CAR and #064 CD19/22-CAR were made with lentiviral vectors. #056 BCMA-CAR and #069 SLAMF7-CAR were made with γ-retroviral vectors. The x-axis indicates the relative position from transcription start site. The y-axis represents normalized signal
Fig. 3
Fig. 3
Hotspots of viral integration at gene loci and their mRNA expression. AC Unsupervised hierarchical clustering of normalized integration data by samples (columns) and genes (rows) are shown. Data normalization was scaled using the built-in R function (scale). Lentiviral and γ-retroviral vectors showed different integration hotspots. A Heatmap showing the top 50 genes with the most enrichment of integration events at the promoter (genes with integration events from higher enrichment to lower enrichment are marked from red to green). B This heatmap shows the top 50 genes with the most enrichment of integration sites at the untranslated region (genes with integration events from higher enrichment to lower enrichment are marked from dark red to purple). C The 50 genes with the most enrichment in the exon region are shown (genes with integration events from higher enrichment to lower enrichment are marked from bittersweet to sky-blue). The bars at the top of each heatmap indicate CAR (CD22: bittersweet; CD19/22: vivid violet; BCMA: yellow; SLAMF7: jungle green) and viral vector type (lenti-vector: orange; Retro-vector: light blue). D–G) Gene expression showed no differences among transduced (TR) vs. non-transduced (UTR) cells for hot spot genes that integrated into the promoter (D, E) or the untranslated region (utr, F and G). Differential expression analysis was performed using the built-in function from limma package in Rstudio with custom scripts. Wald’s test was used to calculate the adjusted p-value or significance that a gene is differentially expressed. Genes with | FoldChange | >=2 and adj.P.value < 0.05 were considered significantly expressed
Fig. 4
Fig. 4
Effect of viral vector integration into the gene promoter and untranslated region. A, B Volcano plots show the differentially expressed genes between control non-transduced cells vs. CAR T-cells transduced for lentiviral (A) and γ-retroviral vectors (B). The number of DEGs were indicated in the volcano plot. Significantly downregulated genes are highlighted in blue (A) or green (B) and upregulated genes are highlighted in red (A) or brown (B). Differential expression analysis was performed using the built-in function from limma package in Rstudio with custom scripts. Wald’s test was used to calculate the adjusted p-value or significance that a gene is differentially expressed. Genes with | FoldChange | >=2 and adj.P.value < 0.05 were considered significantly expressed. C The number of DEGs and integration events occurring at promoter and untranslated region of these DEGs is summarized. DEGs indicates differentially expressed genes; IS events indicates integration site events; and utr, untranslated region. NA means no value is available in the p-value column. Percentage = sequencing reads mapped on each feature/sequencing reads mapped on genome. The boxplots show the expression of 34 genes with integration events at untranslated region (D) and promoter (E) and whose expression differed in control non-transduced vs. transduced CAR T-cells
Fig. 5
Fig. 5
Integration events occurring in exon/intron regions affect alternative splicing transcripts. A The scatter plot shows the number of differential alternative splicing transcripts based on the analysis of control non-transduced vs all transduced CAR T-cell products. The median and 25th-75th percentiles are indicated in lentiviral and γ-retroviral products. Student’s t-Test was used to calculate p-value. p > = 0.05 represents no statistical significance. AS transcripts, alternative splicing transcripts. B All differential alternative splicing transcripts are summarized according to different alternative splicing type. SE, skipped exon; RI, retained intron; MXE, mutually exclusive exon; A5SS, alternative 5’ splice sites, A3SS, alternative 3’ splice sites. C–E The Sashimi plots show integration events occurring at alternative exon/intron region and impaired skipped exon (C), retained intron (D), and mutually exclusive exon (E) process based on RNA-seq analysis. The height of the peaks shows exon coverage, the number in the red (orange) lines show the number of splicing reads. The black scheme under the plot shows the position of the gene in genome. Integration events are showed with blue/red horizonal line under alternative exon or intron position
Fig. 6
Fig. 6
Factors associated with vector integration in CAR T-cell products. The percentage of integration events at genomic features based on CAR T-cell type in lentiviral (A) and γ-retroviral products (B), and based on CAR T-cells produced from patients with different diseases (C, D). The scatter plots show a correlation between percentage of integration at each genomic features and percentage of CD4+ T cells (E), percentage of CD8+ T cells (F), vector copy number (G) in CAR T-cells produced with the lentiviral and γ-retroviral vectors. The x-axis indicates coverage percentage (%). The y-axis represents CD4 + T cell percentage (E), CD8 + T cell percentage (F) and Average vector number (G). Pearson correlation coefficients (r) and two-tailed p-value were computed in the GraphPad software
Fig. 7
Fig. 7
Vector integration sites and clinical outcomes of CAR T-cell therapy. A PCA (principal component analysis) plot using normalized gene integration data does not show distinct clustering of non-responder vs. responder, high grade CRS vs. low grade CRS, or HLH + vs. HLH−. OR: Objective response; NR: Non-response; CRS: Cytokine release syndrome; HLH: Hemophagocytic lymphohistiocytosis. B, C and D) Volcano plot of differential gene integration events comparing in non-responder and responder (B), CRS_high and CRS_low (C), HLH_no and HLH_yes (D). The red dots represent genes with higher enrichment of viral integration in Non-responder group, CRS_high group, and HLH_no group. The blue dots represent genes with lower enrichment of viral integration in Non-responder group, CRS_high group, and HLH_no group. The grey dots are genes without statistical significance. EG Genes with more integration events in non-responders (E), more integration events in patients with low grade CRS (F), and more integration events in patients with HLH (G) were analyzed using gene ontology (GO) analysis. The y-axis indicates the different biological processes and the x-axis represents genes count involved in each biological process. Adjusted p-value was determined with the built-in function using clusterProfiler package in Rstudio

References

    1. Lee DW, Kochenderfer JN, Stetler-Stevenson M, Cui YK, Delbrook C, Feldman SA, Fry TJ, Orentas R, Sabatino M, Shah NN, et al. T cells expressing CD19 chimeric antigen receptors for acute lymphoblastic leukaemia in children and young adults: a phase 1 dose-escalation trial. Lancet. 2015;385:517–28. - PMC - PubMed
    1. Raje N, Berdeja J, Lin Y, Siegel D, Jagannath S, Madduri D, Liedtke M, Rosenblatt J, Maus MV, Turka A, et al. Anti-BCMA CAR T-Cell Therapy bb2121 in relapsed or refractory multiple myeloma. N Engl J Med. 2019;380:1726–37. - PMC - PubMed
    1. Shah NN, Highfill SL, Shalabi H, Yates B, Jin J, Wolters PL, Ombrello A, Steinberg SM, Martin S, Delbrook C, et al. CD4/CD8 T-cell selection affects chimeric antigen receptor (CAR) T-cell potency and toxicity: updated results from a phase i anti-CD22 CAR T-Cell Trial. J Clin Oncol. 2020;38:1938–50. - PMC - PubMed
    1. Serrao E, Engelman AN. Sites of retroviral DNA integration: from basic research to clinical applications. Crit Rev Biochem Mol Biol. 2016;51:26–42. - PMC - PubMed
    1. Escors D, Breckpot K. Lentiviral vectors in gene therapy: their current status and future potential. Arch Immunol Ther Exp (Warsz) 2010;58:107–19. - PMC - PubMed

Publication types

LinkOut - more resources