

Beneficial effect of time-restricted eating on blood pressure: a systematic meta-analysis and meta-regression analysis
- PMID: 36348493
- PMCID: PMC9644535
- DOI: 10.1186/s12986-022-00711-2
Beneficial effect of time-restricted eating on blood pressure: a systematic meta-analysis and meta-regression analysis
Abstract
Background: As a cardiometabolic disease, hypertension has shown an obvious upward trend, becoming a global epidemic chronic disease. Lifestyle intervention is a fundamental method for lowering blood pressure. This systematic review and meta-analysis aimed to evaluate the effects of time-restricted eating (TRE) on blood pressure.
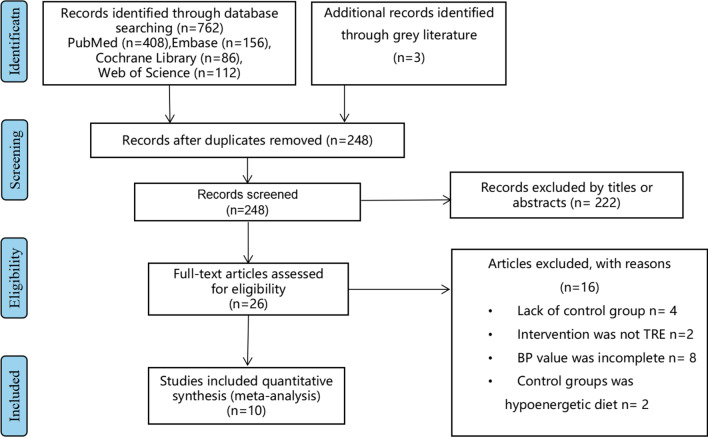
Methods: Studies were retrieved from the PubMed, Embase, Cochrane Library, and Web of Science databases to evaluate the effects of TRE on blood pressure. The time frame of search was from the start of database construction until July 14, 2022.There were no language restrictions. Meta-analysis and meta-regression were performed using Stata version 16. The weighted mean difference with 95% CI was used to assess the effect of TRE on blood pressure, heart rate, weight, blood glucose, total cholesterol, HDL-C, LDL-C, and triglycerides. The main ending of this article were blood pressure and heart rate, while the secondary ending were weight, blood glucose, total cholesterol, HDL-C, LDL-C, and triglycerides.
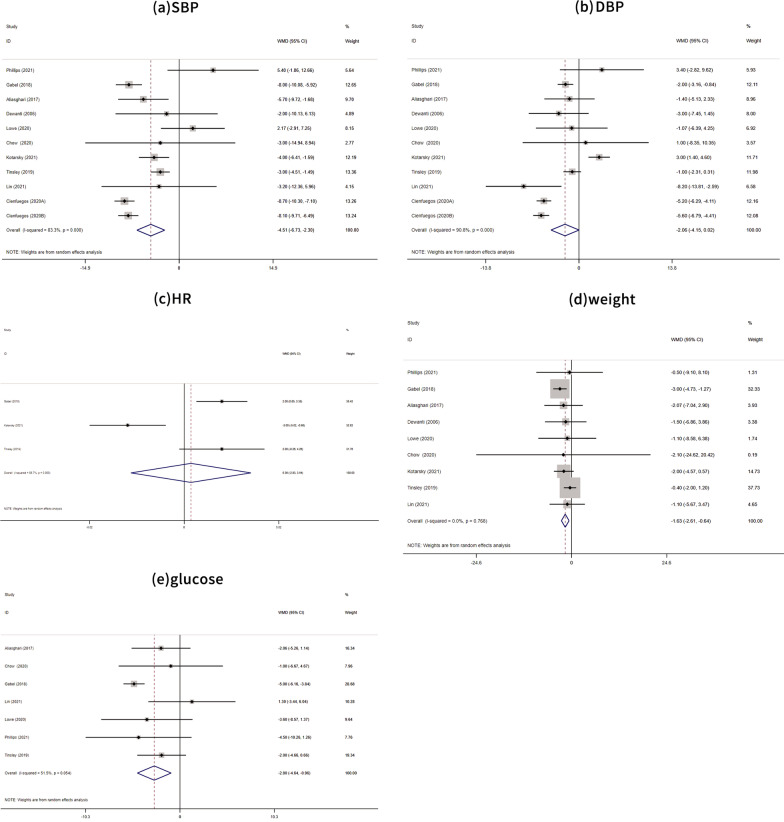
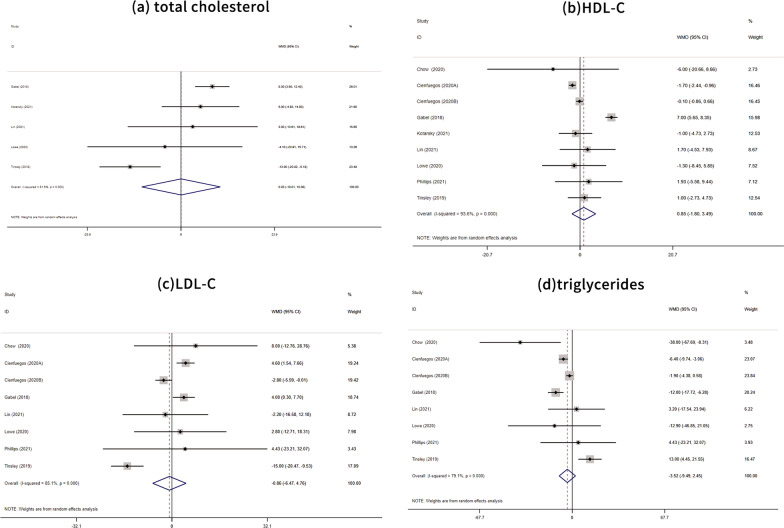
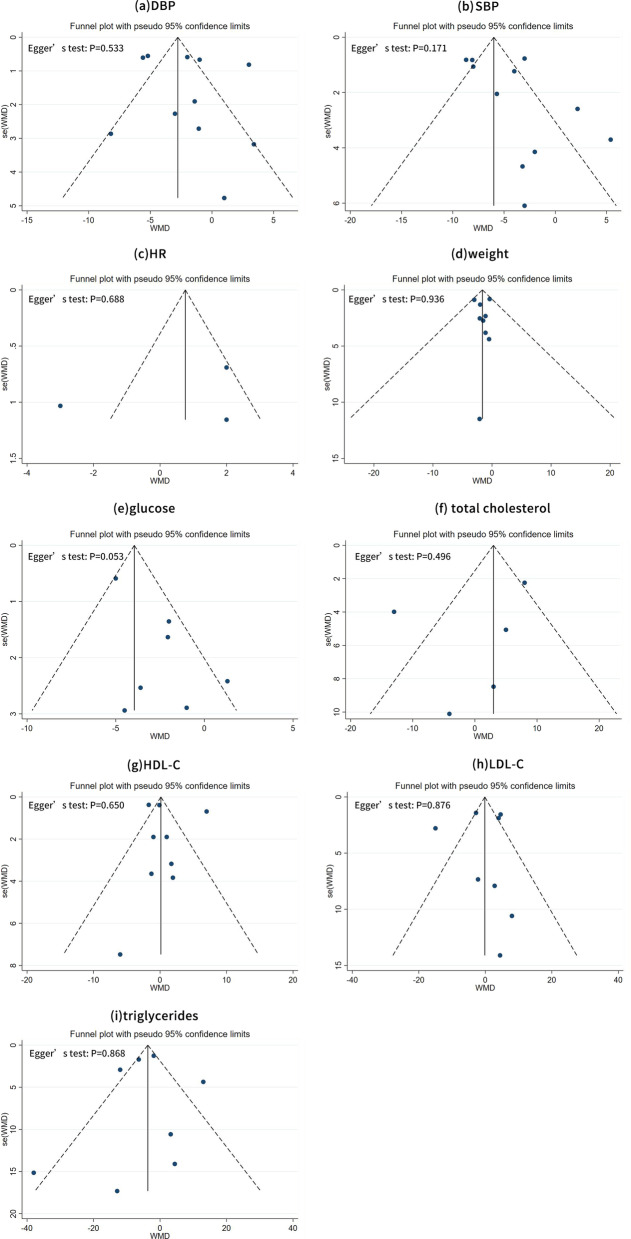
Results: Ten randomized controlled trials involving 694 patients were identified. TRE significantly reduced systolic blood pressure (SBP) (mean difference = -4.15; 95% CI: -6.73, -2.30; P < 0.0001), but had no significant effect on diastolic blood pressure (DBP) (mean difference = -2.06; 95% CI: -4.16, 0.02; P = 0.053) and no beneficial effect on heart rate (mean difference = 0.36; 95% CI: -2.83, 3.54; P = 0.0825). TRE promoted weight loss (mean difference = -1.63; 95% CI: -2.61, -0.64; P = 0.001) and decreased blood glucose levels (mean difference = -2.80; 95% CI: -4.64, -0.96; P = 0.003), but had no significant effect on total cholesterol (mean difference = 0.03, 95% CI: -10.01, 10.08; P = 0.995), HDL-C (mean difference = 0.85, 95% CI: -1.80, 3.49; P = 0.531), LDL-C (mean difference = -0.86, 95% CI: -6.47, 4.76; P = 0.764), or triglycerides (mean difference = -3.524, 95% CI: -9.49, 2.45; P = 0.248). In a separate meta-regression analysis, the degree of SBP change was related to weight loss (P = 0.044) but not to glucose improvement (P = 0.867).
Conclusions: The present meta-analysis suggests that TRE significantly reduced SBP, while no effect of reducing DBP was seen. The observed lower blood pressure may be attributed to significant weight loss. The effects of TRE on heart rate and blood lipid levels were not apparent.
Keywords: Blood pressure; Meta-analysis; Time-restricted eating.
© 2022. The Author(s).
Conflict of interest statement
The authors declare that the research was conducted without any commercial or financial relationships that could be construed as a potential conflict of interest.
Figures
References
-
- de Cabo R, Mattson MP. Effects of intermittent fasting on health, aging, and disease. New Engl J Med. 2019;381(26):2541–51. - PubMed
-
- Carter S, Clifton PM, Keogh JB. The effects of intermittent compared to continuous energy restriction on glycaemic control in type 2 diabetes; a pragmatic pilot trial. Diabetes Res Clin Pract. 2016;122:106–12. - PubMed
LinkOut - more resources
Full Text Sources
Research Materials
