. 2022 Jul-Sep;14(3):100-108.
doi: 10.32607/actanaturae.11710.

Morphological Characterization of Astrocytes in a Xenograft of Human iPSCDerived Neural Precursor Cells

Affiliations

Morphological Characterization of Astrocytes in a Xenograft of Human iPSCDerived Neural Precursor Cells

D N Voronkov et al. Acta Naturae. 2022 Jul-Sep.

Abstract

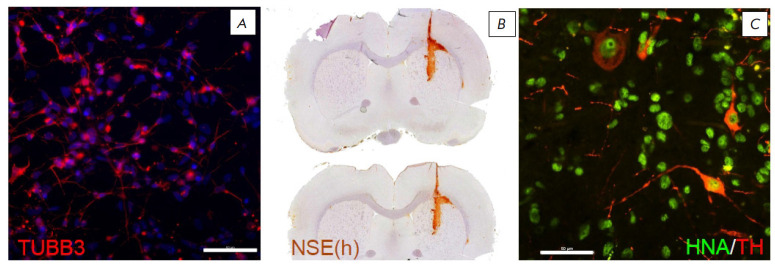
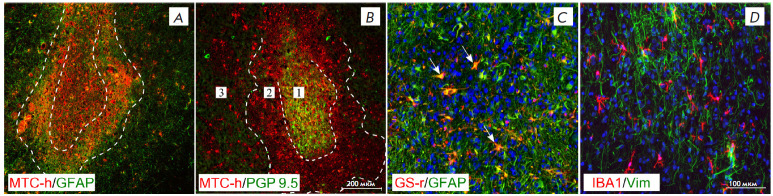
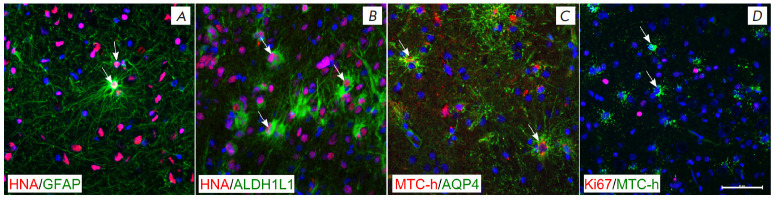
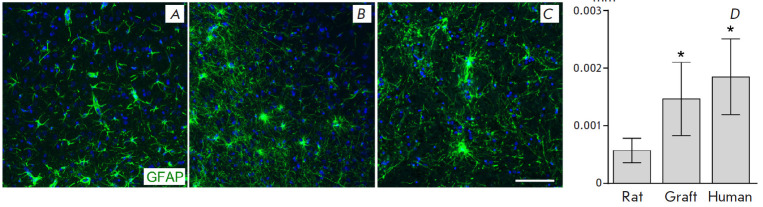
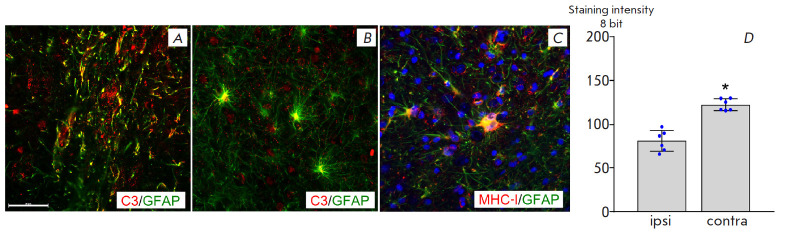
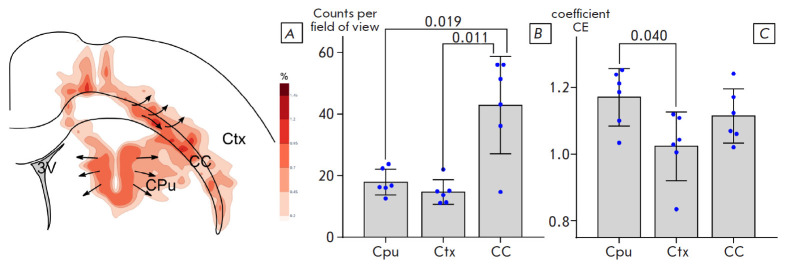
Transplantation of a mixed astrocyte and neuron culture is of interest in the development of cell therapies for neurodegenerative diseases. In this case, an assessment of engraftment requires a detailed morphological characterization, in particular an analysis of the neuronal and glial populations. In the experiment performed, human iPSC-derived neural progenitors transplanted into a rat striatum produced a mixed neuron and astrocyte population in vivo by the sixth month after transplantation. The morphological characteristics and neurochemical profile of the xenografted astrocytes were similar to those of mature human astroglia. Unlike neurons, astrocytes migrated to the surrounding structures and the density and pattern of their distribution in the striatum and cerebral cortex differed, which indicates that the microenvironment affects human glia integration. The graft was characterized by the zonal features of glial cell morphology, which was a reflection of cell maturation in the central area, glial shaft formation around the transplanted neurons, and migration to the surrounding structures.

Keywords: astrocytes; iPSC; neural precursors; striatum; transplantation.


Figures

Fig. 1
Fig. 1
Neural markers in the IPSC culture and in the graft. (A) Beta-3-tubilin in culture (TUBB3, red). (B) Human neuron-specific enolase (NSE) in the graft area (immunoperoxidase staining). (C) Human tyrosine hydroxylase-positive neurons in the graft (HNA, green; TH, red). Scale bar: (A), (C), 50 μm
Fig. 2
Fig. 2
Glial-neural organization of the graft 6 months after transplantation. (A) Human cell graft area in the striatum; GFAP staining (green) and MTC-h staining (red). (B) Human cell graft area in the striatum, PGP 9.5 staining (green) and MTC-h staining (red). (C) Human (green, GFAP) and rat (orange, GFAP/GS-positive cells, indicated by arrows) astrocytes in the graft area. (D) Vimentin-positive astrocytes (green) and microglia (red) in the graft area. The boundaries of the selected areas in (A) and (B) are denoted with a dashed line: 1 – central area; 2 – glial scar area; 3 – lateral area. Scale bar: (A), (B), 200 μm; (C), (D), 100 μm
Fig. 3
Fig. 3
Expression of glial markers in the transplanted cells. (A) GFAP-containing astrocyte in the central graft area. (B) ALDH1L1-containing astrocytes in the central graft area. (C) AQP4 localization on the human astrocytic processes in the lateral area. (D) Lack of Ki-67-positive human cells in the lateral graft area. Human astrocytes are indicated by arrows. Scale bar: (A), (B), (C), (D), 100 μm
Fig. 4
Fig. 4
Size and morphology of GFAP-containing rat astrocytes (A), transplanted human astrocytes (B), and human mibdbrain astrocytes (C). Evaluation of the area occupied by astrocyte processes (D). Scale bar: (A), (B), (C), (D), 100 μm. *ANOVA, a post-hoc Tukey’s test, p < 0.05 compared with rat astrocytes
Fig. 5
Fig. 5
Neuroinflammatory marker expression in the astrocytes. (A) Localization of complement component C3 in the processes of reactive rat astrocytes in the saline injection area (contralateral hemisphere), GFAP (green), C3 (red). (B) Localization of complement component C3 in the bodies of the transplanted human astrocytes. (C) Staining of the transplanted astrocytes for human MHC-I. (D) The staining intensity for complement component C3 is significantly lower in the area of a glial scar surrounding the graft (ipsi-) compared with that of the reactive rat astrocytes in the saline injection site on the controlateral side (contra-). * p < 0.05, Student’s t-test. Scale bar: (A), (B), (C), 100 μm
Fig. 6
Fig. 6
Distribution of xenografted human astroglia in the rat brain structures. (A) Astroglia density distribution map (the darker the shading, the higher the density). (B) Mean density (cell number per field of view) of a human astrocyte distribution in the striatum (Cpu), cerebral cortex (Ctx), and corpus callosum (CC). (C) The changes in the Clark–Evans aggregation index (CE). The p-Values of RM ANOVA are indicatted in plots; a post-hoc Tukey’s test

Similar articles

Cited by

References

    1. Doss M.X., Sachinidis A., Cells. 2019;8(5):403. - PMC - PubMed
    1. Bigarreau J., Rouach N., Perrier A.L., Mouthon F., Charvériat M.. Int. J. Mol. Sci. 2022;23(3):1684. - PMC - PubMed
    1. Kriks S., Shim J.W., Piao J., Ganat Y.M., Wakeman D.R., Xie Z., Carrillo-Reid L., Auyeung G., Antonacci C., Buch A.. Nature. 2011;480(7378):547–551. - PMC - PubMed
    1. Antonov S.A., Novosadova E.V.. Int. J. Mol. Sci. 2021;22(7):3381. - PMC - PubMed
    1. Bianchi F., Malboubi M., Li Y., George J.H., Jerusalem A., Szele F., Thompson M.S., Ye H.. Stem Cell Res. 2018;32:126–134. - PubMed

LinkOut - more resources