. 2022 Jul-Sep;14(3):4-18.
doi: 10.32607/actanaturae.11705.

Visualization of G-Quadruplexes, i-Motifs and Their Associates

Affiliations

Visualization of G-Quadruplexes, i-Motifs and Their Associates

E V Dubrovin et al. Acta Naturae. 2022 Jul-Sep.

Abstract

The non-canonical structures formed by G- or C-rich DNA regions, such as quadruplexes and i-motifs, as well as their associates, have recently been attracting increasing attention both because of the arguments in favor of their existence in vivo and their potential application in nanobiotechnology. When studying the structure and properties of non-canonical forms of DNA, as well as when controlling the artificially created architectures based on them, visualization plays an important role. This review analyzes the methods used to visualize quadruplexes, i-motifs, and their associates with high spatial resolution: fluorescence microscopy, transmission electron microscopy (TEM), and atomic force microscopy (AFM). The key approaches to preparing specimens for the visualization of this type of structures are presented. Examples of visualization of non-canonical DNA structures having various morphologies, such as G-wires, G-loops, as well as individual quadruplexes, i-motifs and their associates, are considered. The potential for using AFM for visualizing non-canonical DNA structures is demonstrated.

Keywords: (immuno)fluorescence microscopy; G-quadruplexes; atomic force microscopy; i-motifs; transmission electron microscopy.


Figures

Fig. 1
Fig. 1
A confocal laser scanning microscopy image of fixed MCF-7 cancer cells labeled (before fixation) for 6 h using cex-NDI, demonstrating nuclear localization of G-quadruplexes (left – fluorescence signal; center – bright field observation; right – superposition of two signals). Reproduced from [37] under the CC 4.0 license (http://creativecommons. org/licenses/by/4.0/)
Fig. 2
Fig. 2
A confocal microscopy image of living U2OS cells incubated with the DOTA-M2 dye, demonstrating nuclear localization of G-quadruplexes (top – fluorescence signal; center – bright field observation; bottom – superposition of two signals). Reproduced from [40] under the CC 4.0 license (http://creativecommons.org/ licenses/by/4.0/)
Fig. 3
Fig. 3
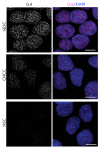
An immunofluorescence microscopy image of fixed pluripotent embryonic stem cells (hESCs), cranial neural crest cells (CNCCs), and neural stem cells (NSCs) labeled with G-quadruplex-specific antibodies BG4 after treatment with RNase (secondary antibodies labeled with fluorescent dye AlexaFluor 488). On the left-hand side, only the quadruplexes are visualized; while on the right-hand side, the nuclei are stained blue due to the contrast with the DNA dye DAPI. The scale bar is 10 μm. Reproduced from [54] under the CC 4.0 license (http://creativecommons.org/licenses/by/4.0/)
Fig. 4
Fig. 4
Visualization of C- and G-rich telomeric transcripts. C-rich (A) and G-rich (B) RNA molecules in 100 mM KCl were deposited for EM on thin carbon substrates, dehydrated, and shaded with tungsten on a rotating substrate. C-rich RNAs look like elongated strands with nodes. G-rich RNAs look like a mixture of balls and sticks (arrows). The rod thickness is significantly greater than that of C-rich or duplex RNAs. C-rich (C) and G-rich (D) RNA molecules are deposited from 10 mM KCl in the same way as in (A) and (B). C-rich RNA looks straightened with nodes, while G-rich RNA is mainly ball-shaped. The scale bar is 100 nm. Reproduced from [60] under the CC 4.0 license (http://creativecommons.org/licenses/ by/4.0/)
Fig. 5
Fig. 5
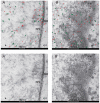
An immunoelectron microscopy image of cells infected with herpes simplex virus type 1 (HSV-1), fixed for 15 h post-infection, and incubated with the anti-G-quadruplex antibody (1H6) and anti-ICP8 serum. Primary antibodies to 1H6 and to ICP8 were detected using gold particles with a diameter of 5 and 10 nm, respectively. To improve image clarity, the golden particles are highlighted with red dots (showing G-quadruplexes) and green circles (showing ICP8) on Fig. A and Fig. B. The original images are shown in panels A’ and B’. (A-A’) G-quadruplexes and ICP8 concentrate in the vicinity of the nuclear membrane (NM), where the nuclear pore complex (NPC) is located. The exit from the nucleus through the nuclear pore complex is one of the pathways used by HSV-1 capsids to leave the nucleus (n) and get into the cytoplasm (cyt). (B-B’) G-quadruplexes and the ICP8 cluster near the nuclear membrane, where the newly formed virions bud off. Reproduced from [61] under the CC 4.0 license (http://creativecommons. org/licenses/by/4.0/)
Fig. 6
Fig. 6
Comparison of tetra- and monomolecular G-quadruplexes. AFM images of tetramolecular (insert: the zoomed-in tetramolecular complex) (A) and monomolecular (B) G-quadruplexes. Tetramolecular G-quadruplexes were prepared using a complex of four 1,400 bp long 5’-biotin-poly(dG)-poly(dC) molecules associated with avidin. Monomolecular G-quadruplexes were prepared using a 5,500-base-long G-chain. Molecules of both types were deposited on mica under the same conditions. Statistical analysis of the contour lengths of tetramolecular (C) and monomolecular (D) G-quadruplexes. Reproduced from [95] under the CC 4.0 license (http://creativecommons.org/licenses/by/4.0/)
Fig. 7
Fig. 7
Observation of the formation of a separate G-quadruplex and i-motif. (A) – AFM images of DNA frames containing the G-tracts required for the formation of an interstrand G-quadruplex in the presence of K+. (B) – AFM images of DNA frames containing the C-tracts required for the formation of an interstrand i-motif in an acidic medium. The blue and red arrows show disconnected and connected (X-shaped) threads, respectively. The scale bars are 100 nm. Adapted with permission from [105]. Copyright (2015) American Chemical Society
Fig. 8
Fig. 8
Schematic representation of the sample surface for AFM studies of the quadruplexes and quadruplex-containing structures on the surface of the GM modified HOPG
Fig. 9
Fig. 9
AFM images and corresponding histograms of the height distribution of two tetrad G-quadruplexes formed after rapid annealing in the presence of 10 mM KCl (left-hand side) and slow annealing in the presence of 200 mM KCl (right-hand side). The scale bar is 100 nm. Reproduced from [112] under the CC 4.0 license (http://creativecommons.org/ licenses/by/4.0/)
Fig. 10
Fig. 10
AFM images of the nanostructures based on i-motifs formed by the following oligonucleotide sequences at pH 5.5: C2T25 (A); C5T25 (B); C7T25 (C); C9T25 (D); C12T25 (E); and C25T25 (F). The scale bar is 100 nm. Reproduced from [114] under the CC BY-NC 3.0 license (https:// creativecommons.org/ licenses/by-nc/3.0/)

Similar articles

Cited by

References

    1. Gellert M., Lipsett M.N., Davies D.R.. Proc. Natl. Acad. Sci. USA. 1962;48(12):2013–2018. - PMC - PubMed
    1. Gehring K., Leroy J.L., Guéron M.. Nature. 1993;363(6429):561–565. - PubMed
    1. Hänsel-Hertsch R., Di Antonio M., Balasubramanian S.. Nat. Rev. Mol. Cell Biol. 2017;18(5):279–284. - PubMed
    1. Abou Assi H., Garavís M., González C., Damha M.J.. Nucleic Acids Research. 2018;46(16):8038–8056. - PMC - PubMed
    1. Brown S.L., Kendrick S.. Pharmaceuticals. 2021;14(2):96. - PMC - PubMed

LinkOut - more resources