

Automated stopped-flow library synthesis for rapid optimisation and machine learning directed experimentation
- PMID: 36349112
- PMCID: PMC9601405
- DOI: 10.1039/d2sc03016k
Automated stopped-flow library synthesis for rapid optimisation and machine learning directed experimentation
Abstract
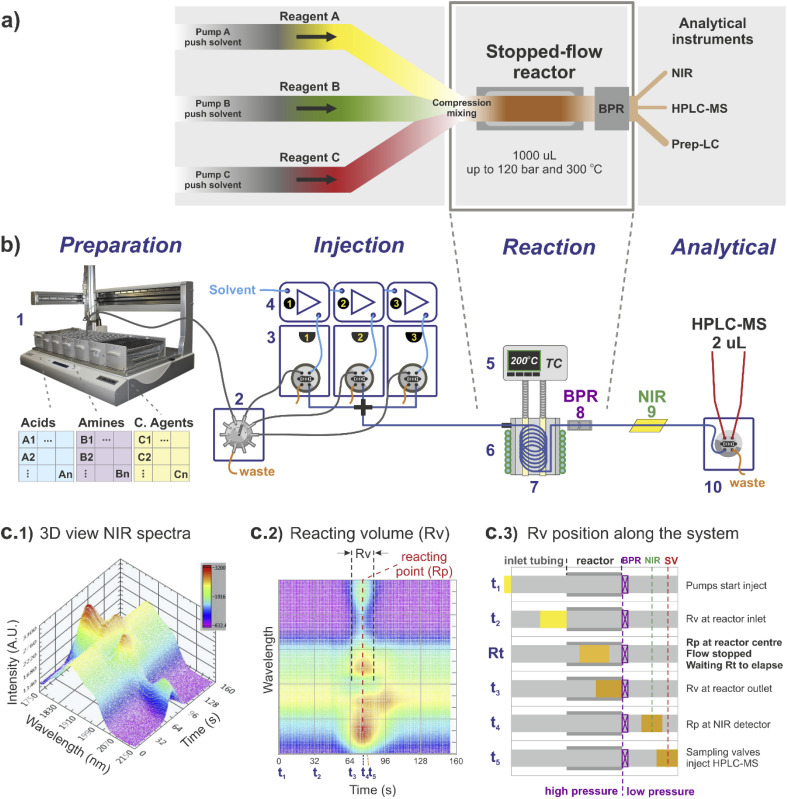
For the discovery of new candidate molecules in the pharmaceutical industry, library synthesis is a critical step, in which library size, diversity, and time to synthesise are fundamental. In this work we propose stopped-flow synthesis as an intermediate alternative to traditional batch and flow chemistry approaches, suited for small molecule pharmaceutical discovery. This method exploits the advantages of both techniques enabling automated experimentation with access to high pressures and temperatures; flexibility of reaction times, with minimal use of reagents (μmol scale per reaction). In this study, we integrate a stopped-flow reactor into a high-throughput continuous platform designed for the synthesis of combinatory libraries with at-line reaction analysis. This approach allowed ∼900 reactions to be conducted in an accelerated timeframe (192 hours). The stopped flow approach used ∼10% of the reactants and solvents compared to a fully continuous approach. This methodology demonstrates a significantly improved synthesis success rate of smaller libraries by simplifying the implementation of cross-reaction optimisation strategies. The experimental datasets were used to train a feed-forward neural network (FFNN) model providing a framework to guide further experiments, which showed good model predictability and success when tested against an external set with fewer experiments. As a result, this work demonstrates that combining experimental automation with machine learning strategies can deliver optimised analyses and enhanced predictions, enabling more efficient drug discovery investigations across the design, make, test and analysis (DMTA) cycle.
This journal is © The Royal Society of Chemistry.
Conflict of interest statement
There are no conflicts to declare.
Figures


Similar articles
-
Feedback in Flow for Accelerated Reaction Development.Acc Chem Res. 2016 Sep 20;49(9):1786-96. doi: 10.1021/acs.accounts.6b00261. Epub 2016 Aug 15. Acc Chem Res. 2016. PMID: 27525813
-
An Automated Electrochemical Flow Platform to Accelerate Library Synthesis and Reaction Optimization.Angew Chem Int Ed Engl. 2024 Dec 16;63(51):e202412045. doi: 10.1002/anie.202412045. Epub 2024 Nov 7. Angew Chem Int Ed Engl. 2024. PMID: 39317660 Free PMC article.
-
The Evolution of Chemical High-Throughput Experimentation To Address Challenging Problems in Pharmaceutical Synthesis.Acc Chem Res. 2017 Dec 19;50(12):2976-2985. doi: 10.1021/acs.accounts.7b00428. Epub 2017 Nov 27. Acc Chem Res. 2017. PMID: 29172435
-
Recent advances and applications in high-throughput continuous flow.Chem Commun (Camb). 2024 Mar 19;60(24):3217-3225. doi: 10.1039/d3cc06180a. Chem Commun (Camb). 2024. PMID: 38436212 Review.
-
Digitising chemical synthesis in automated and robotic flow.Chem Sci. 2020 Oct 7;11(44):11973-11988. doi: 10.1039/d0sc04250a. Chem Sci. 2020. PMID: 34094419 Free PMC article. Review.
Cited by
-
Continuous flow synthesis of pyridinium salts accelerated by multi-objective Bayesian optimization with active learning.Chem Sci. 2023 Jul 12;14(30):8061-8069. doi: 10.1039/d3sc01303k. eCollection 2023 Aug 2. Chem Sci. 2023. PMID: 37538827 Free PMC article.
-
A Brief Introduction to Chemical Reaction Optimization.Chem Rev. 2023 Mar 22;123(6):3089-3126. doi: 10.1021/acs.chemrev.2c00798. Epub 2023 Feb 23. Chem Rev. 2023. PMID: 36820880 Free PMC article. Review.
-
Deep Reinforcement Learning-Based Self-Optimization of Flow Chemistry.ACS Eng Au. 2025 May 13;5(3):247-266. doi: 10.1021/acsengineeringau.5c00004. eCollection 2025 Jun 18. ACS Eng Au. 2025. PMID: 40556644 Free PMC article.
-
Navigating the Expansive Landscapes of Soft Materials: A User Guide for High-Throughput Workflows.ACS Polym Au. 2023 Dec 5;3(6):406-427. doi: 10.1021/acspolymersau.3c00025. eCollection 2023 Dec 13. ACS Polym Au. 2023. PMID: 38107416 Free PMC article. Review.
-
Parallel multi-droplet platform for reaction kinetics and optimization.Chem Sci. 2023 Aug 4;14(33):8798-8809. doi: 10.1039/d3sc02082g. eCollection 2023 Aug 23. Chem Sci. 2023. PMID: 37621435 Free PMC article.
References
LinkOut - more resources
Full Text Sources
Research Materials