

Fluorescent metabolic labeling-based quick antibiotic susceptibility test for anaerobic bacteria
- PMID: 36349219
- PMCID: PMC9627725
- DOI: 10.1039/d2cb00163b
Fluorescent metabolic labeling-based quick antibiotic susceptibility test for anaerobic bacteria
Erratum in
-
Correction: Fluorescent metabolic labeling-based quick antibiotic susceptibility test for anaerobic bacteria.RSC Chem Biol. 2022 Oct 3;3(11):1359. doi: 10.1039/d2cb90037h. eCollection 2022 Nov 2. RSC Chem Biol. 2022. PMID: 36350788 Free PMC article.
Abstract
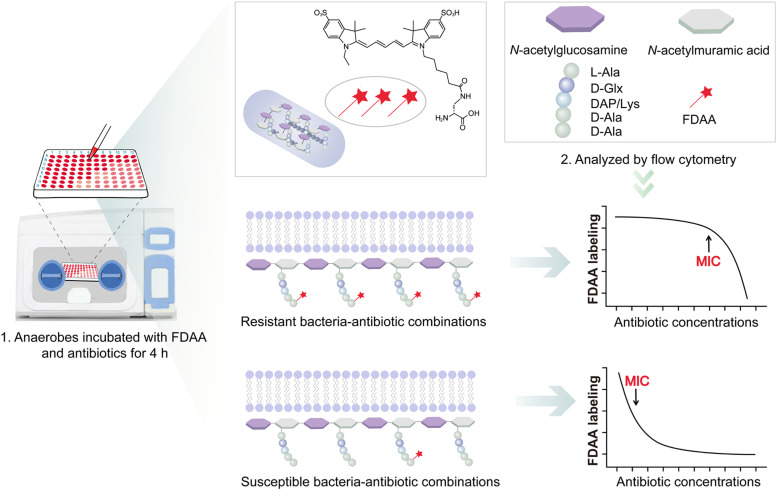
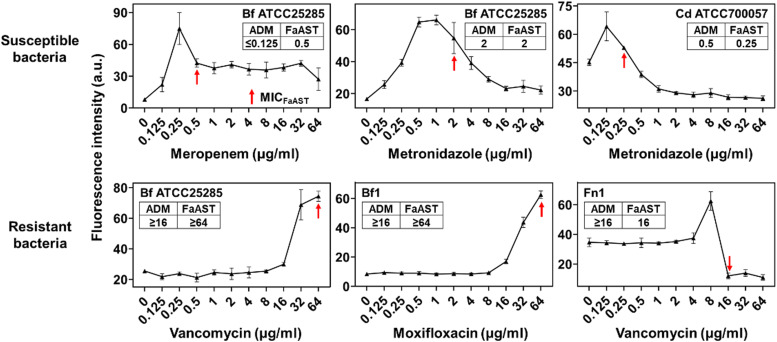
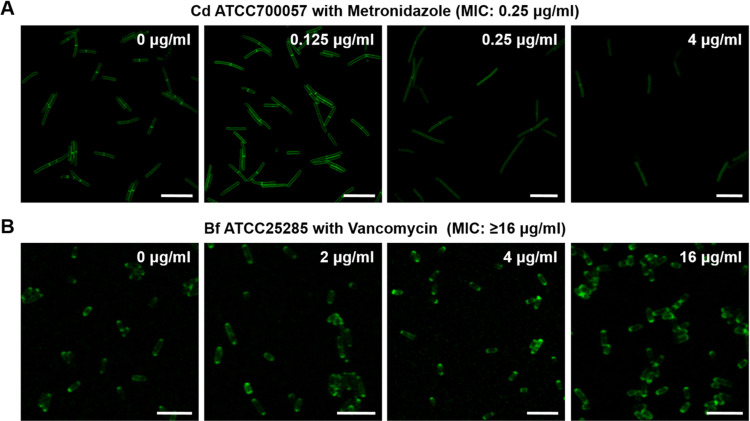
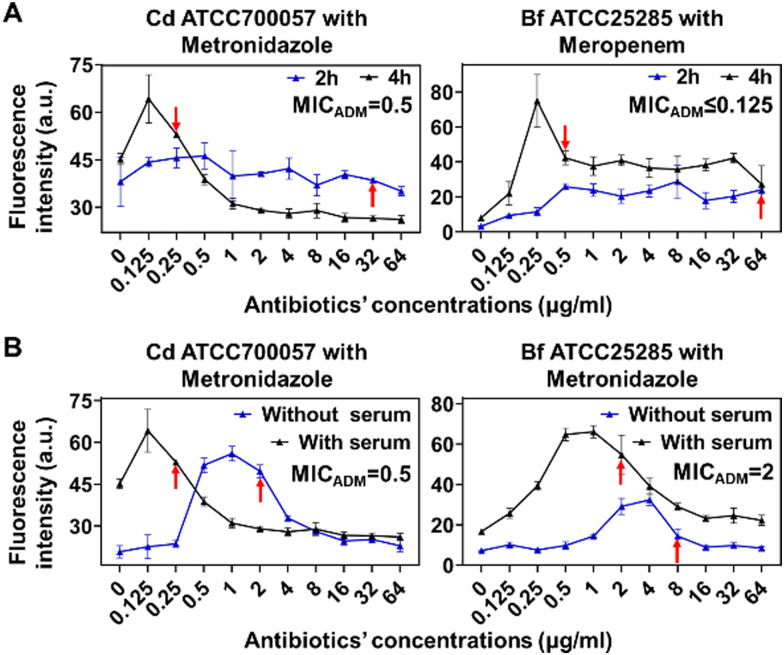
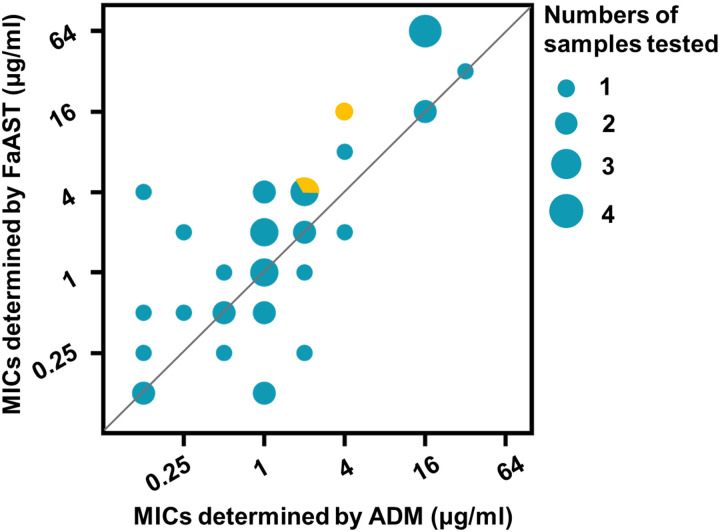
Because of the advancements in medicine and science, the numbers of patients surviving complicated diseases are continuously increasing, which in turn leads to elevated chances of anaerobic infections by endogenous bacteria. Traditional growth yield-based antibiotic susceptibility tests (ASTs) against anaerobic bacteria are very time-consuming (≥48 h) and labor intensive, which delays the timely guidance of antibiotic prescription and increases the mortality of patients. Inspired by a fluorescent d-amino acid (FDAA) labeling-based AST (FaAST) that we recently developed for quick determination of aerobic bacteria's susceptibilities, here we report an accurate and fast AST method for anaerobic pathogens. Based on flow cytometry analysis of anaerobes that have been treated with various doses of antibiotics and metabolically labeled with FDAA, the intensities of which can reflect their affected metabolic status by the drugs, the MICs of each drug can then be determined. The whole process can be completed in 5 h. After testing 40 combinations of the representative anaerobic bacteria and antibiotics, our method demonstrates a high susceptibility category accuracy of 95.0%. This FaAST-based protocol is helpful in accurately and quickly guiding antibiotic decisions when treating critical infections caused by anaerobic bacteria.
This journal is © The Royal Society of Chemistry.
Conflict of interest statement
The authors declare no conflicts of interest.
Figures

Similar articles
-
d-Amino Acid-Based Metabolic Labeling Enables a Fast Antibiotic Susceptibility Test of Both Isolated Bacteria and Bronchoalveolar Lavage Fluid.Adv Healthc Mater. 2022 Mar;11(6):e2101736. doi: 10.1002/adhm.202101736. Epub 2021 Dec 24. Adv Healthc Mater. 2022. PMID: 34898025
-
Antibiotic susceptibility of human gut-derived facultative anaerobic bacteria is different under aerobic versus anaerobic test conditions.Microbes Infect. 2021 Nov-Dec;23(9-10):104847. doi: 10.1016/j.micinf.2021.104847. Epub 2021 Jun 8. Microbes Infect. 2021. PMID: 34116163
-
Inoculum size-insensitive susceptibility determination of urine sample based on in-situ measurement of inducible enzyme activity after 20 min of antibiotic exposure.Anal Chim Acta. 2023 Nov 22;1282:341858. doi: 10.1016/j.aca.2023.341858. Epub 2023 Oct 16. Anal Chim Acta. 2023. PMID: 37923403
-
Microfluidic systems for rapid antibiotic susceptibility tests (ASTs) at the single-cell level.Chem Sci. 2020 Apr 1;11(25):6352-6361. doi: 10.1039/d0sc01353f. Chem Sci. 2020. PMID: 34094102 Free PMC article. Review.
-
Antimicrobial susceptibility testing of anaerobic bacteria: In routine and research.Anaerobe. 2022 Jun;75:102559. doi: 10.1016/j.anaerobe.2022.102559. Epub 2022 Apr 10. Anaerobe. 2022. PMID: 35417767 Review.
References
LinkOut - more resources
Full Text Sources