

Quantum nanodiamonds for sensing of biological quantities: Angle, temperature, and thermal conductivity
- PMID: 36349322
- PMCID: PMC9592573
- DOI: 10.2142/biophysico.bppb-v19.0034
Quantum nanodiamonds for sensing of biological quantities: Angle, temperature, and thermal conductivity
Abstract
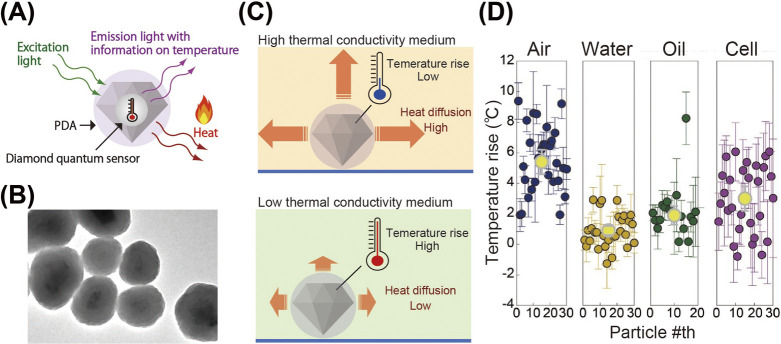
Measuring physical quantities in the nanometric region inside single cells is of great importance for understanding cellular activity. Thus, the development of biocompatible, sensitive, and reliable nanobiosensors is essential for progress in biological research. Diamond nanoparticles containing nitrogen-vacancy centers (NVCs), referred to as fluorescent nanodiamonds (FNDs), have recently emerged as the sensors that show great promise for ultrasensitive nanosensing of physical quantities. FNDs emit stable fluorescence without photobleaching. Additionally, their distinctive magneto-optical properties enable an optical readout of the quantum states of the electron spin in NVC under ambient conditions. These properties enable the quantitative sensing of physical parameters (temperature, magnetic field, electric field, pH, etc.) in the vicinity of an FND; hence, FNDs are often described as "quantum sensors". In this review, recent advancements in biosensing applications of FNDs are summarized. First, the principles of orientation and temperature sensing using FND quantum sensors are explained. Next, we introduce surface coating techniques indispensable for controlling the physicochemical properties of FNDs. The achievements of practical biological sensing using surface-coated FNDs, including orientation, temperature, and thermal conductivity, are then highlighted. Finally, the advantages, challenges, and perspectives of the quantum sensing of FND are discussed. This review article is an extended version of the Japanese article, In Situ Measurement of Intracellular Thermal Conductivity Using Diamond Nanoparticle, published in SEIBUTSU BUTSURI Vol. 62, p. 122-124 (2022).
Keywords: biosensing; cell; fluorescent nanodiamonds; nitrogen vacancy; quantum sensor.
2022 THE BIOPHYSICAL SOCIETY OF JAPAN.
Figures


Similar articles
-
Synthesis, Characterization, Properties, and Novel Applications of Fluorescent Nanodiamonds.J Fluoresc. 2022 May;32(3):863-885. doi: 10.1007/s10895-022-02898-2. Epub 2022 Mar 1. J Fluoresc. 2022. PMID: 35230567 Review.
-
Fluorescent Nanodiamond: A Versatile Tool for Long-Term Cell Tracking, Super-Resolution Imaging, and Nanoscale Temperature Sensing.Acc Chem Res. 2016 Mar 15;49(3):400-7. doi: 10.1021/acs.accounts.5b00484. Epub 2016 Feb 16. Acc Chem Res. 2016. PMID: 26882283
-
Fluorescent nanodiamonds as a robust temperature sensor inside a single cell.Biophys Physicobiol. 2018 Oct 26;15:229-234. doi: 10.2142/biophysico.15.0_229. eCollection 2018. Biophys Physicobiol. 2018. PMID: 30450272 Free PMC article.
-
Quantum Sensing in a Physiological-Like Cell Niche Using Fluorescent Nanodiamonds Embedded in Electrospun Polymer Nanofibers.Small. 2019 May;15(22):e1900455. doi: 10.1002/smll.201900455. Epub 2019 Apr 22. Small. 2019. PMID: 31012244
-
Recent Developments of Nanodiamond Quantum Sensors for Biological Applications.Adv Sci (Weinh). 2022 Jul;9(19):e2200059. doi: 10.1002/advs.202200059. Epub 2022 Mar 27. Adv Sci (Weinh). 2022. PMID: 35343101 Free PMC article. Review.
Cited by
-
Temperature Sensing in Agarose/Silk Fibroin Translucent Hydrogels: Preparation of an Environment for Long-Term Observation.Nanomaterials (Basel). 2025 Jan 16;15(2):123. doi: 10.3390/nano15020123. Nanomaterials (Basel). 2025. PMID: 39852738 Free PMC article.
References
-
- Degen, C. L., Reinhard, F., Cappellaro, P.. Quantum sensing. Rev. Mod. Phys. 89, 035002 (2017). https://doi.org/10.1103/RevModPhys.89.035002
-
- Schirhagl, R., Chang, K., Loretz, M., Degen, C. L.. Nitrogen-vacancy centers in diamond: Nanoscale sensors for physics and biology. Annu. Rev. Phys. Chem. 65, 83–105 (2014). https://doi.org/10.1146/annurev-physchem-040513-103659 - PubMed
-
- Ho, K. O., Wong, K. C., Leung, M. Y., Pang, Y. Y., Leung, W. K., Yip, K. Y., et al. . Recent developments of quantum sensing under pressurized environment using the nitrogen vacancy (NV) center in diamond. J. Appl. Phys. 129, 241101 (2021). https://doi.org/10.1063/5.0052233
-
- Yu, S. J., Kang, M. W., Chang, H. C., Chen, K. M., Yu, Y. C.. Bright fluorescent nanodiamonds: No photobleaching and low cytotoxicity. J. Am. Chem. Soc. 127, 17604–17605 (2005). https://doi.org/10.1021/ja0567081 - PubMed
-
- Hui, Y. Y., Hsiao, W. W.-W., Haziza, S., Simonneau, M., Treussart, F., Chang, H.-C.. Single particle tracking of fluorescent nanodiamonds in cells and organisms. Curr. Opin. Solid State Mater. Sci. 21, 35–42 (2017). https://doi.org/10.1016/j.cossms.2016.04.002