. 2023 Apr;168(4):684-696.
doi: 10.1111/imm.13603. Epub 2022 Nov 23.

Dysfunctional phenotype of systemic and pulmonary regulatory T cells associate with lethal COVID-19 cases

Affiliations

Dysfunctional phenotype of systemic and pulmonary regulatory T cells associate with lethal COVID-19 cases

Marcela Helena Gonçalves-Pereira et al. Immunology. 2023 Apr.

Abstract

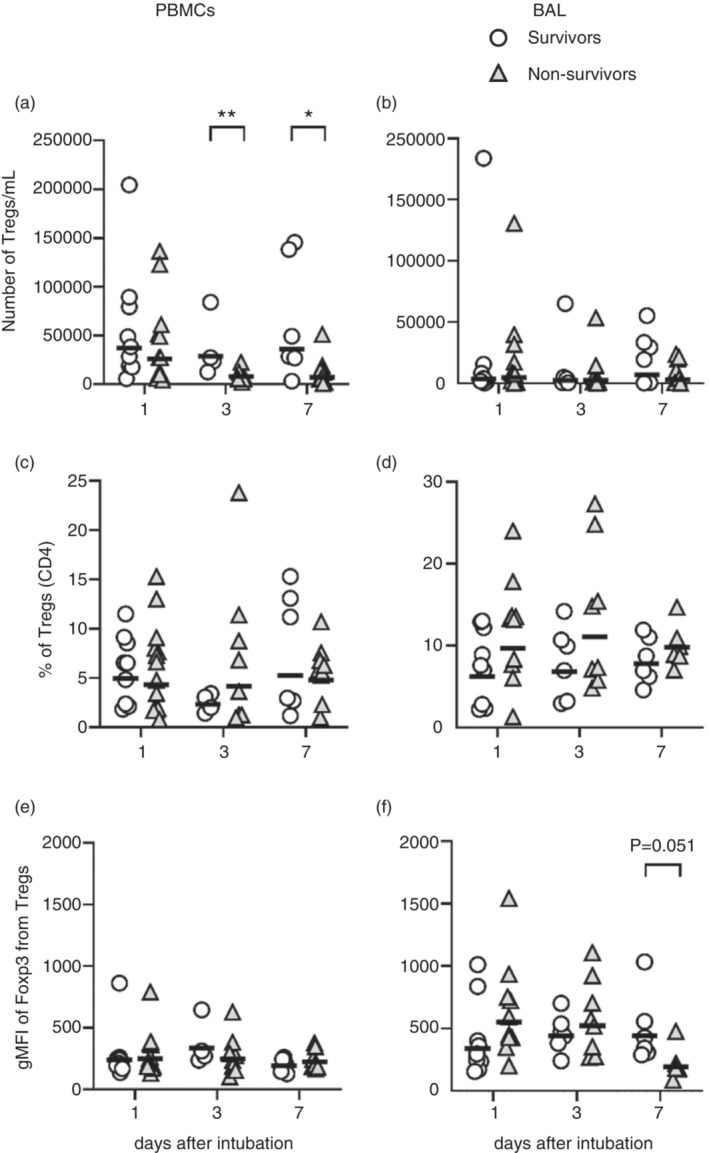
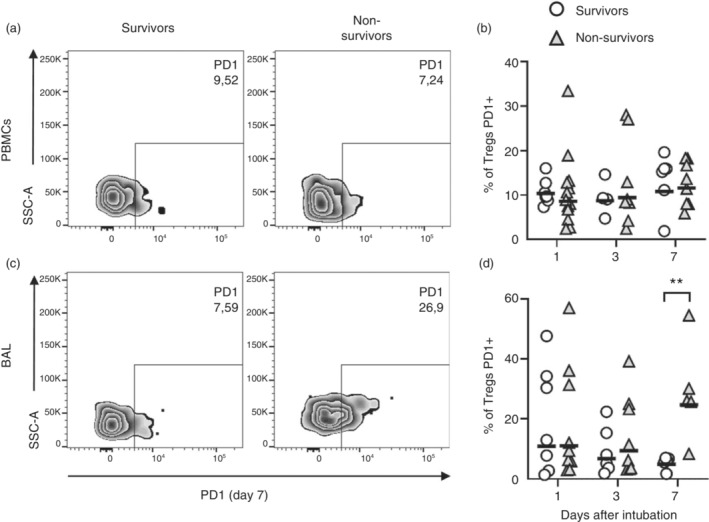
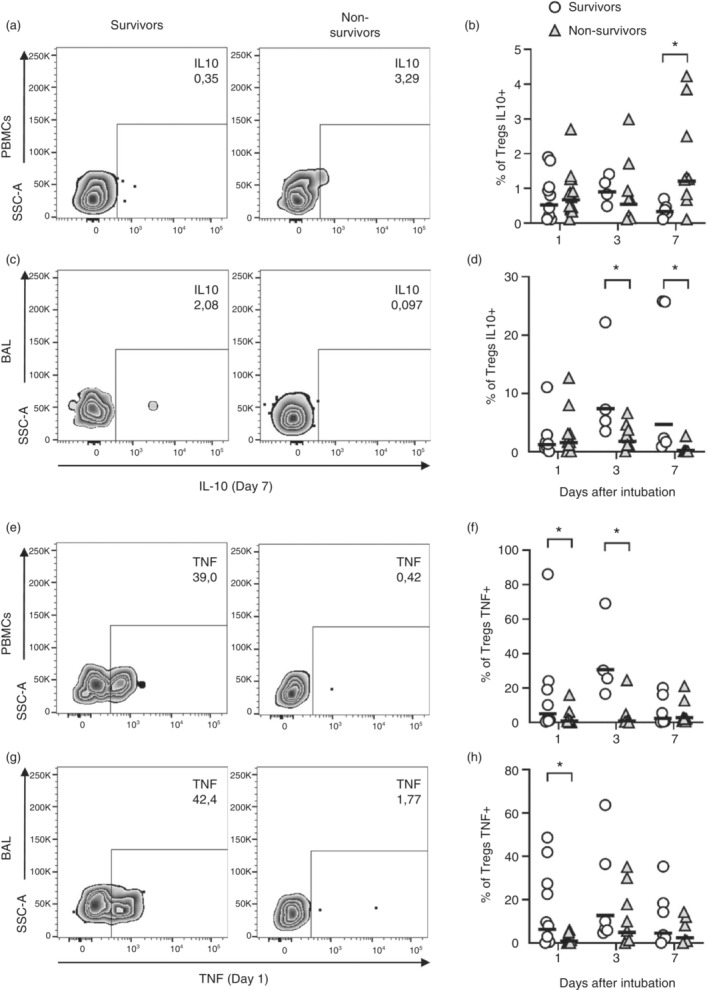
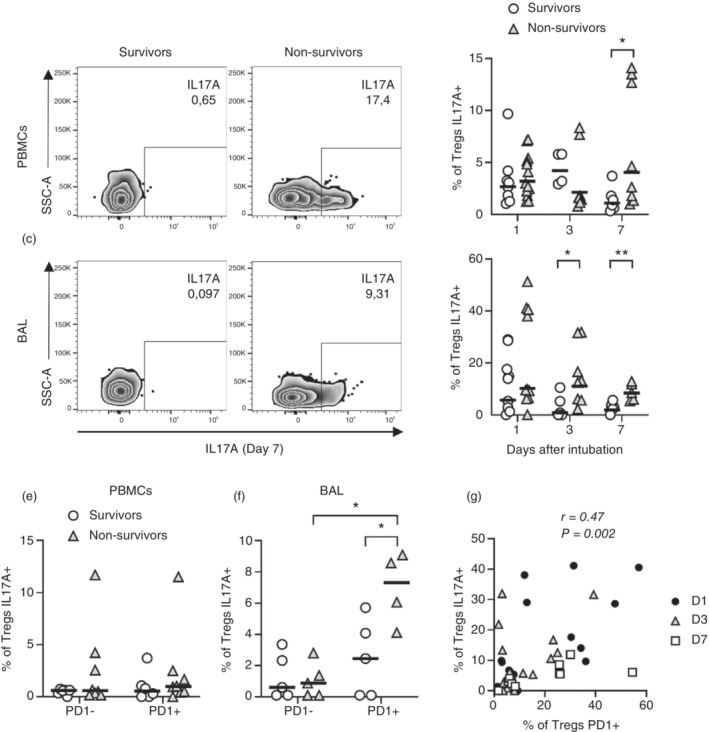
Severe cases of COVID-19 present hyperinflammatory condition that can be fatal. Little is known about the role of regulatory responses in SARS-CoV-2 infection. In this study, we evaluated the phenotype of regulatory T cells in the blood (peripheral blood mononuclear cell) and the lungs (broncho-alveolar) of adult patients with severe COVID-19 under invasive mechanical ventilation. Our results show important dynamic variation on Treg cells phenotype during COVID-19 with changes in number and functional parameters from the day of intubation (Day 1 of intensive care unit admission) to Day 7. We observed that compared with surviving patients, non-survivors presented lower numbers of Treg cells in the blood. In addition, lung Tregs of non-survivors also displayed higher PD1 and lower FOXP3 expressions suggesting dysfunctional phenotype. Further signs of Treg dysregulation were observed in non-survivors such as limited production of IL-10 in the lungs and higher production of IL-17A in the blood and in the lungs, which were associated with increased PD1 expression. These findings were also associated with lower pulmonary levels of Treg-stimulating factors like TNF and IL-2. Tregs in the blood and lungs are profoundly dysfunctional in non-surviving COVID-19 patients.

Keywords: COVID-19; invasive mechanical ventilation; regulatory T cells.


Conflict of interest statement

The authors declare no conflict of interest.

Figures

FIGURE 1
FIGURE 1
Number, frequency and FOXP3 MFI of blood and lung Tregs. PBMCs and BAL cells from patients with severe COVID‐19 were incubated for 12 h in the presence of BFA without stimulation. Number of Tregs per ml of blood (a) or BAL (b), frequencies of Tregs in CD4+ T cell population (c, d), and geometric means of FOXP3 expression by Tregs (e, f) were evaluated by flow cytometry. Survivors (open circles) n = 9 (D1), n = 4 or 6 (D3) and n = 6 (D7). Non‐survivors (grey triangles) n = 11 (D1), n = 8 (D3) and n = 8 (D7). The lines represent the geometric mean of each group. Differences between these two COVID‐19 groups were analysed by Mann–Whitney test and are indicated by asterisks (* for p < 0.05 and ** for p < 0.01) when statistically significant. BAL, broncho‐alveolar aspirate; PBMC, peripheral blood mononuclear cell.
FIGURE 2
FIGURE 2
Tregs of fatal COVID‐19 cases express higher frequencies of PD1 in the lungs, but not in the blood, than survivor patients. PBMCs and BAL cells from patients with severe COVID‐19 were incubated for 12 h in the presence of BFA without stimulation. Frequency of PD1 expression by Tregs was evaluated by flow cytometry (a–d). Representative dot plots of Tregs expressing PD1 on Day 7 (a, c). Survivors (open circles) n = 9 (D1), n = 4 or 6 (D3) and n = 6 (D7). Non‐survivors (grey triangles) n = 10 (D1), n = 8 (D3) and n = 8 (D7). The lines represent the geometric mean of each group (b, d). Differences between severe COVID‐19 groups were analysed by Mann–Whitney test and are indicated by asterisks (**) when statistically significant (p < 0.01). BAL, broncho‐alveolar aspirate; PBMC, peripheral blood mononuclear cell.
FIGURE 3
FIGURE 3
Tregs of non‐survivor COVID‐19 patients presented reduced frequencies of IL‐10 and TNF production. PBMCs and BAL cells from patients with severe COVID‐19 were incubated for 12 h in the presence of BFA without stimulation. Frequency of IL‐10 (a–d) and TNF (e–h) were evaluated by flow cytometry. Representative dot plots of Tregs producing IL‐10 on Day 7 (a, c) or TNF on Day 1 (e, f). Frequency of cytokine production by survivors (open circles) n = 9 (D1), n = 4 or 6 (D3) and n = 6 (D7) and non‐survivors (grey triangles) n = 10 (D1), n = 8 (D3) and n = 8 (D7) are represented by geometric means represented by horizontal lines (b, d, f and h). Differences between severe COVID‐19 groups were analysed by Mann–Whitney test and are indicated by asterisks (*) when statistically significant (p < 0.05). BAL, broncho‐alveolar aspirate; PBMC, peripheral blood mononuclear cell.
FIGURE 4
FIGURE 4
Tregs of non‐survivors display higher production of IL‐17A associated with PD1 expression. PBMCs and BAL cells from patients with severe COVID‐19 were incubated for 12 h in the presence of BFA without stimulation and subjected to flow cytometry. Frequency of IL‐17A+ Tregs (a–d), influence of PD1 expression on IL‐17A production at Day 7 (e, f) and correlation between the frequency of Tregs producing IL‐17A and expressing PD1 (g) were evaluated. Representative dot plots of Tregs producing IL‐17A on Day 7 (a, c) are shown. Frequencies of Tregs in survivors (open circles) n = 9 (D1), n = 4 or 6 (D3) and n = 6 (D7) and non‐survivors (grey triangles) n = 10 (D1), n = 8 (D3) and n = 8 (D7) (b, d, e and f) were evaluated by geometric means and represented by horizontal lines. Differences between severe COVID‐19 groups were analysed by Mann–Whitney test and are indicated by asterisks (* for p < 0.05 and ** for p < 0.01) when statistically significant. All patients were included on correlation analysis from Days 1 (black circles), 3 (white triangles) or 7 (white square) after intubation (g). BAL, broncho‐alveolar aspirate; PBMC, peripheral blood mononuclear cell.

References

    1. Wang C, Horby PW, Hayden FG, Gao GF. A novel coronavirus outbreak of global health concern. Lancet. 2020;395:470–3. - PMC - PubMed
    1. Coronavirus Resource Center, 2022. https://coronavirus.jhu.edu/data/mortality
    1. Dixon BE, Wools‐Kaloustian KK, Fadel WF, Duszynski TJ, Yiannoutsos C, Halverson PK, et al. Symptoms and symptom clusters associated with SARS‐CoV‐2 infection in community‐based populations: results from a statewide epidemiological study. PLoS One. 2021;16:e0241875. - PMC - PubMed
    1. Huang C, Wang Y, Li X, Ren L, Zhao J, Hu Y, et al. Clinical features of patients infected with 2019 novel coronavirus in Wuhan, China. Lancet. 2020;395:497–506. - PMC - PubMed
    1. Phua J, Weng L, Ling L, Egi M, Lim CM, Divatia JV, et al. Intensive care management of coronavirus disease 2019 (COVID‐19): challenges and recommendations. Lancet Respir Med. 2020;8:506–17. - PMC - PubMed

Publication types

Substances