Clinical Trial
. 2023 Feb 16;29(4):711-722.
doi: 10.1158/1078-0432.CCR-22-1284.

A Phase I/II Open-Label Study of Molibresib for the Treatment of Relapsed/Refractory Hematologic Malignancies

Affiliations
Clinical Trial

A Phase I/II Open-Label Study of Molibresib for the Treatment of Relapsed/Refractory Hematologic Malignancies

Mark A Dawson et al. Clin Cancer Res. .

Abstract

Purpose: Molibresib is a selective, small molecule inhibitor of the bromodomain and extra-terminal (BET) protein family. This was an open-label, two-part, Phase I/II study investigating molibresib monotherapy for the treatment of hematological malignancies (NCT01943851).

Patients and methods: Part 1 (dose escalation) determined the recommended Phase 2 dose (RP2D) of molibresib in patients with acute myeloid leukemia (AML), Non-Hodgkin lymphoma (NHL), or multiple myeloma. Part 2 (dose expansion) investigated the safety and efficacy of molibresib at the RP2D in patients with relapsed/refractory myelodysplastic syndrome (MDS; as well as AML evolved from antecedent MDS) or cutaneous T-cell lymphoma (CTCL). The primary endpoint in Part 1 was safety and the primary endpoint in Part 2 was objective response rate (ORR).

Results: There were 111 patients enrolled (87 in Part 1, 24 in Part 2). Molibresib RP2Ds of 75 mg daily (for MDS) and 60 mg daily (for CTCL) were selected. Most common Grade 3+ adverse events included thrombocytopenia (37%), anemia (15%), and febrile neutropenia (15%). Six patients achieved complete responses [3 in Part 1 (2 AML, 1 NHL), 3 in Part 2 (MDS)], and 7 patients achieved partial responses [6 in Part 1 (4 AML, 2 NHL), 1 in Part 2 (MDS)]. The ORRs for Part 1, Part 2, and the total study population were 10% [95% confidence interval (CI), 4.8-18.7], 25% (95% CI, 7.3-52.4), and 13% (95% CI, 6.9-20.6), respectively.

Conclusions: While antitumor activity was observed with molibresib, use was limited by gastrointestinal and thrombocytopenia toxicities. Investigations of molibresib as part of combination regimens may be warranted.


Figures

Figure 1. A, Serial bone marrow blasts and mutation burden during molibresib therapy (60-mg QD). There was an initial rise in bone marrow blasts and mutational burden in IDH1 Arg132Cys and TP53 Asp259Tyr during molibresib treatment, but these decreased by day 98. B, Serial bone marrow trephine assessments showing a reduction in blasts by hematoxylin and eosin stain (top) and by CD34 IHC (bottom), as well as evidence of regenerative erythropoiesis at day 98 of molibresib treatment. H&E, hematoxylin and eosin.
Figure 1.
A, Serial bone marrow blasts and mutation burden during molibresib therapy (60 mg QD). There was an initial rise in bone marrow blasts and mutational burden in IDH1 Arg132Cys and TP53 Asp259Tyr during molibresib treatment, but these decreased by day 98. B, Serial bone marrow trephine assessments showing a reduction in blasts by H&E stain (top) and by CD34 IHC (bottom), as well as evidence of regenerative erythropoiesis at day 98 of molibresib treatment. H&E, hematoxylin and eosin.
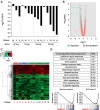
Figure 2. A, RT-qPCR to measure MYC expression was performed on bone marrow aspirate samples collected at screening and post-molibresib treatment. Bars represent the log2-fold change of MYC expression after treatment relative to screening. B, Volcano plot graphing the log10(FDR) versus the log2(fold change) for 7,978 genes that are expressed (>3 FPKM) in all analyzed samples. Blue dots indicate genes that pass the significance threshold of an FDR <0.05 and >1.5-fold change, whereas pink dots do not meet both criteria. C, A heatmap of all genes that are significantly differentially expressed when pooled across all 13 patients. Each column corresponds to the log2(fold change) for each patient. The bar at the top of the heatmap corresponds to clinical response, indicating CR (pink), PR (blue), or NR (green). D, GSEA results when examining the average fold-change across all 13 patients. Twelve gene sets were significantly downregulated (FDR <0.05). Two example enrichment plots show the enrichment score (black line) across all genes, with black bars, indicating genes within the IFN-alpha response and MYC target v2 gene sets, respectively. AML, acute myelogenous leukemia; CR, complete response; FC, fold change; FDR, false discovery rate; FPKM, fragments per kilobase per million reads; GSEA, gene set enrichment analysis; NR, no-response; PR, partial response; RT-qPCR, reverse transcription and quantitative polymerase chain reaction.
Figure 2.
A, RT-qPCR to measure MYC expression was performed on bone marrow aspirate samples collected at screening and post-molibresib treatment. Bars represent the log2-fold change of MYC expression after treatment relative to screening. B, Volcano plot graphing the log10(FDR) versus the log2(fold change) for 7,978 genes that are expressed (>3 FPKM) in all analyzed samples. Blue dots indicate genes that pass the significance threshold of an FDR <0.05 and >1.5-fold change, whereas pink dots do not meet both criteria. C, A heatmap of all genes that are significantly differentially expressed when pooled across all 13 patients. Each column corresponds to the log2(fold change) for each patient. The bar at the top of the heatmap corresponds to clinical response, indicating CR (pink), PR (blue), or NR (green). D, GSEA results when examining the average fold change across all 13 patients. Twelve gene sets were significantly downregulated (FDR <0.05). Two example enrichment plots show the enrichment score (black line) across all genes, with black bars, indicating genes within the interferon alpha response and MYC target v2 gene sets, respectively. AML, acute myeloid leukemia; CR, complete response; FC, fold change; FDR, false discovery rate; FPKM, fragments per kilobase per million reads; GSEA, gene set enrichment analysis; NR, non-responder; PR, partial response; RT-qPCR, reverse transcription and quantitative polymerase chain reaction.
Figures 3. A and B, Heatmaps of individual patients’ change in gene expression following molibresib treatment (log2; fold change) for genes that were identified as differentially expressed when pooled across all NRs (A), or a clinical response (CR and PR; B). Genes are defined as differentially expressed if they reach a 1.5-fold change with an FDR <0.05. The bar at the top of the heatmap corresponds to clinical response, indicating CR [pink; Patient 1 with CRp, Patient 2 with CRi), PR (blue), or NR (green)]. C, Venn diagram showing the number of differentially expressed genes in responders, non-responder, or both. D, Scatterplot showing the fold change in gene expression for the two patients that achieved CR. Genes are categorized as unchanged in both patients (gray), differentially expressed in one patient (blue), differentially expressed in the same direction in both patients (black), or differentially expressed in both patients, but in the opposite direction (red) if they exhibited >1.5-fold change (dotted lines). CR, complete response; CRi, CR but platelet count <100×109/L or neutrophil count <1×10⁹/L; CRp, CR but platelet count <100×109/L; FDR, false discovery rate; NRs, non-responders; PR, partial response.
Figure 3.
A and B, Heatmaps of individual patients’ change in gene expression following molibresib treatment (log2; fold change) for genes that were identified as differentially expressed when pooled across all NRs (A), or a clinical response (CR and PR; B). Genes are defined as differentially expressed if they reach a 1.5-fold change with an FDR <0.05. The bar at the top of the heatmap corresponds to clinical response, indicating CR [pink; Patient 1 with CRp, Patient 2 with CRi), PR (blue), or NR (green)]. C, Venn diagram showing the number of differentially expressed genes in responders, non-responders, or both. D, Scatterplot showing the fold change in gene expression for the 2 patients who achieved CR. Genes are categorized as unchanged in both patients (gray), differentially expressed in one patient (blue), differentially expressed in the same direction in both patients (black), or differentially expressed in both patients, but in the opposite direction (red) if they exhibited >1.5-fold change (dotted lines). CR, complete response; CRi, CR but platelet count <100×109/L or neutrophil count <1×10⁹/L; CRp, CR but platelet count <100×109/L; FDR, false discovery rate; NR, non-responder; PR, partial response.

Comment in

  • 1078-0432. doi: 10.1158/1078-0432.CCR-29-4-HI

References

    1. French CA. Small-molecule targeting of BET proteins in cancer. Adv Cancer Res 2016;131:21–58. - PubMed
    1. Mujtaba S, Zeng L, Zhou MM. Structure and acetyl-lysine recognition of the bromodomain. Oncogene 2007;26:5521–7. - PubMed
    1. Muller S, Filippakopoulos P, Knapp S. Bromodomains as therapeutic targets. Expert Rev Mol Med 2011;13:e29. - PMC - PubMed
    1. Filippakopoulos P, Picaud S, Mangos M, Keates T, Lambert JP, Barsyte-Lovejoy D, et al. . Histone recognition and large-scale structural analysis of the human bromodomain family. Cell 2012;149:214–31. - PMC - PubMed
    1. Dey A, Nishiyama A, Karpova T, McNally J, Ozato K. Brd4 marks select genes on mitotic chromatin and directs postmitotic transcription. Mol Biol Cell 2009;20:4899–909. - PMC - PubMed

Publication types

MeSH terms

Associated data

LinkOut - more resources