. 2023 Feb 6;220(2):e20211422.
doi: 10.1084/jem.20211422. Epub 2022 Nov 9.

Activating NO-sGC crosstalk in the mouse vascular niche promotes vascular integrity and mitigates acute lung injury

Affiliations

Activating NO-sGC crosstalk in the mouse vascular niche promotes vascular integrity and mitigates acute lung injury

Hao He et al. J Exp Med. .

Abstract

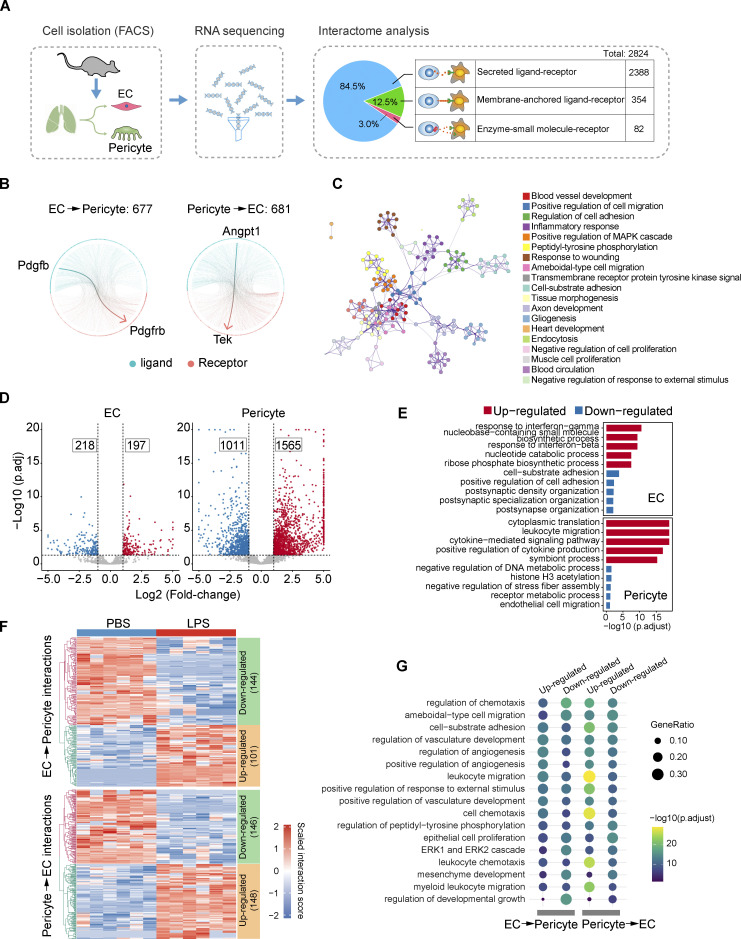
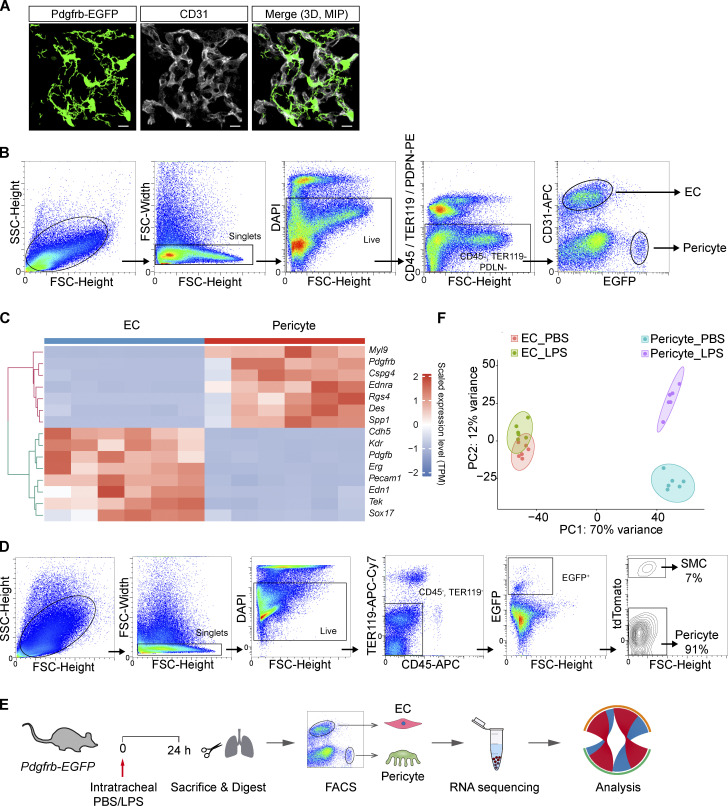
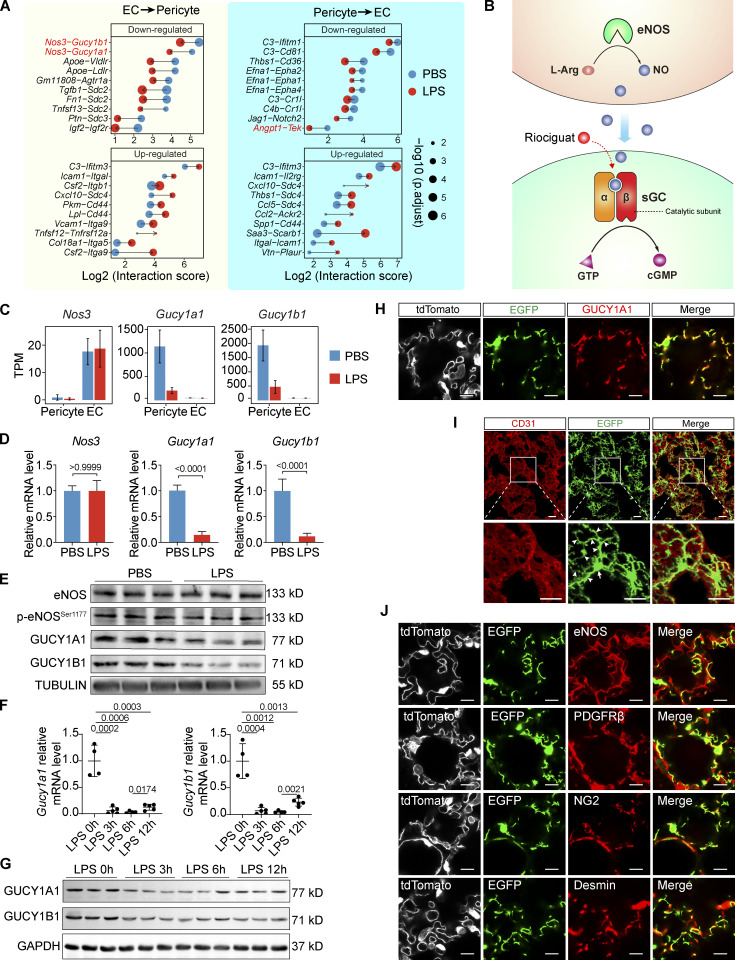
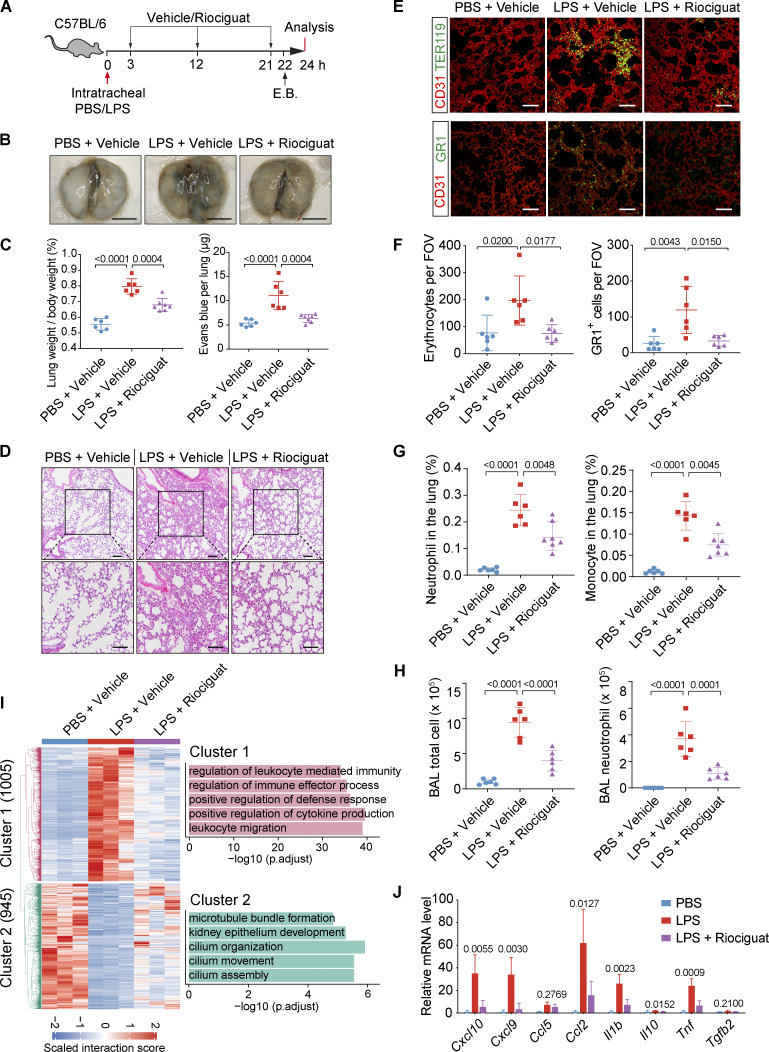
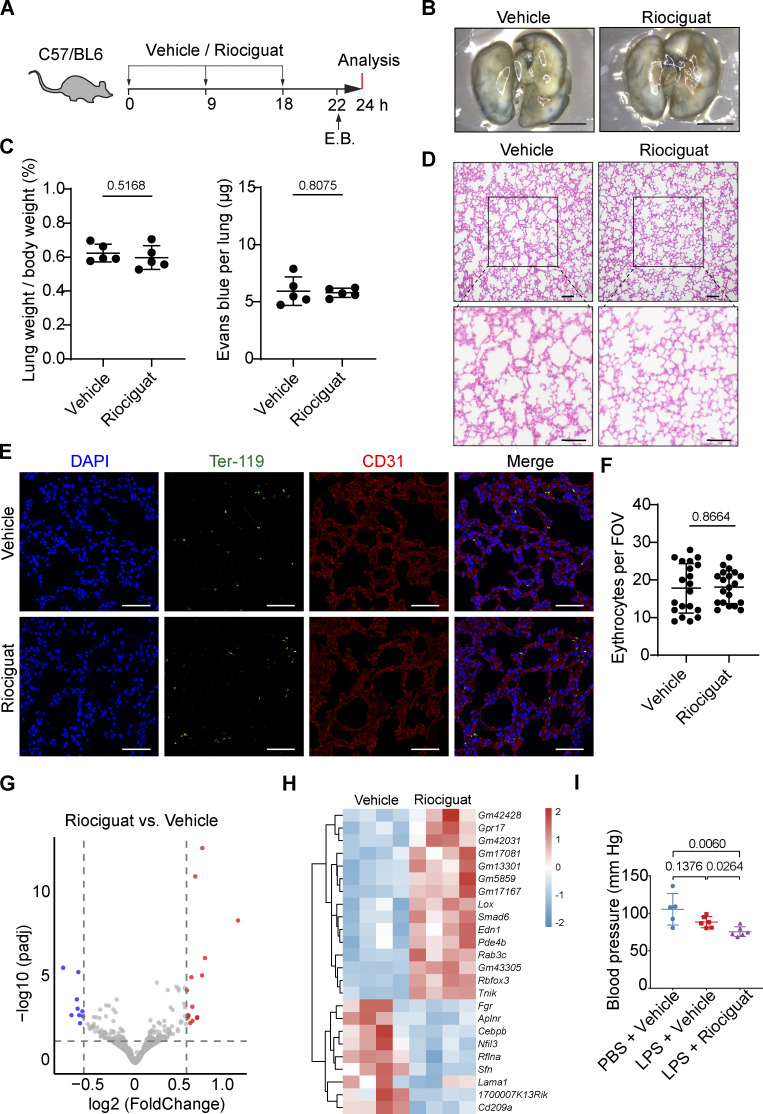
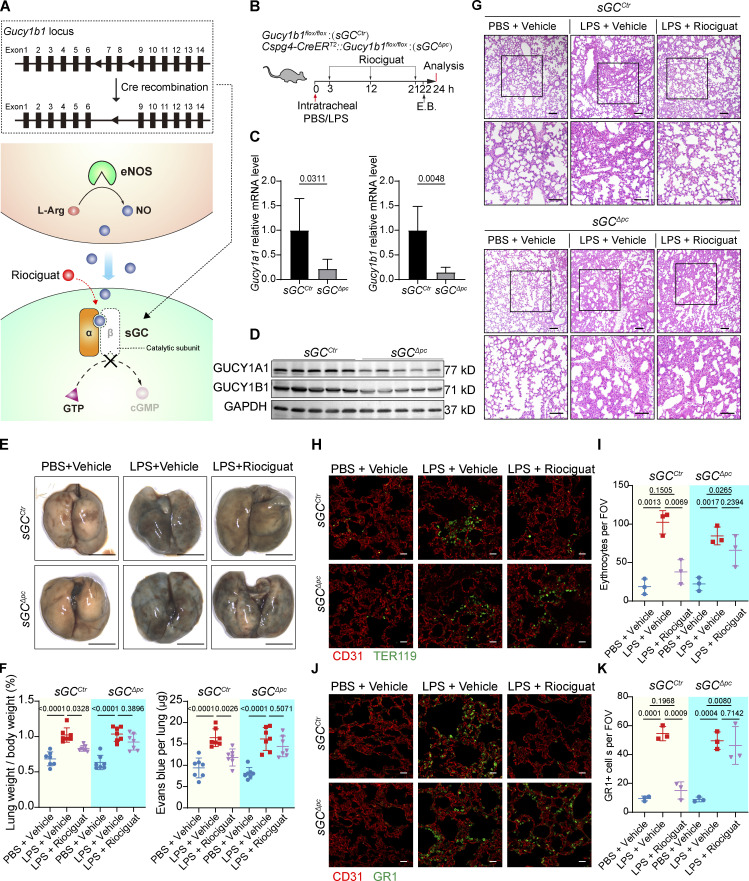
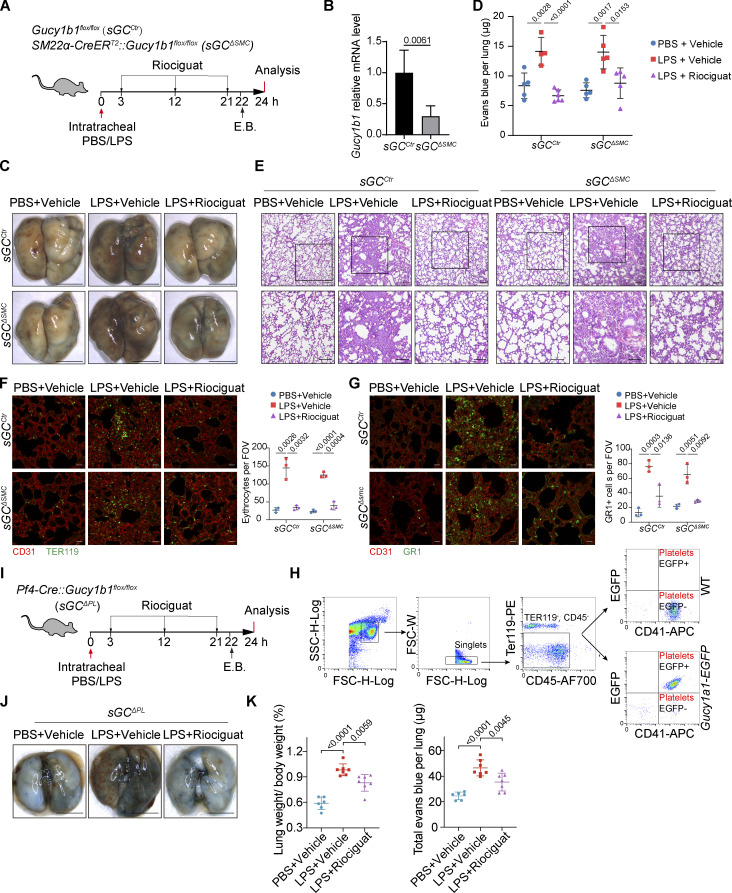
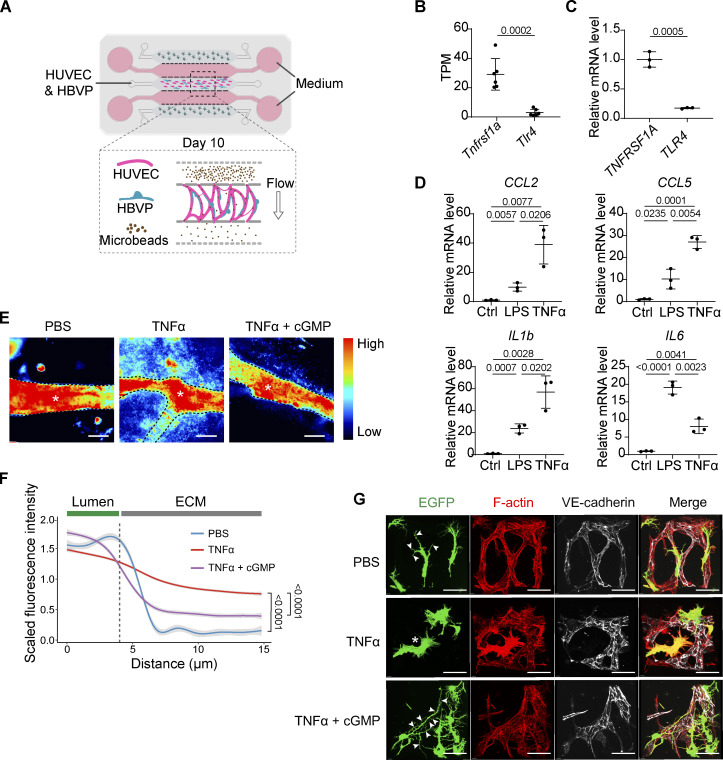
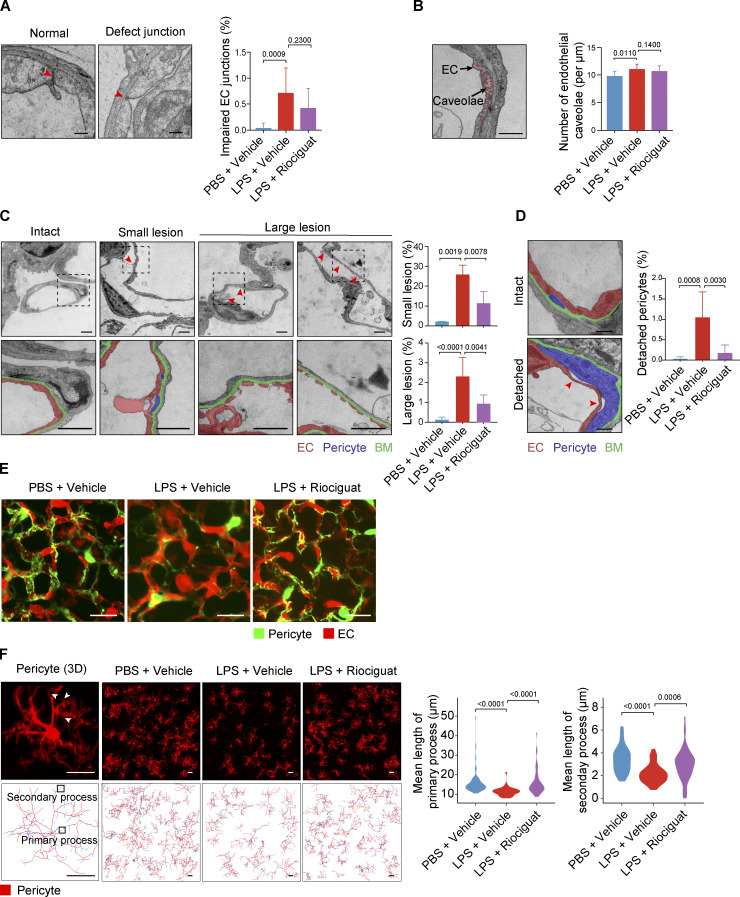
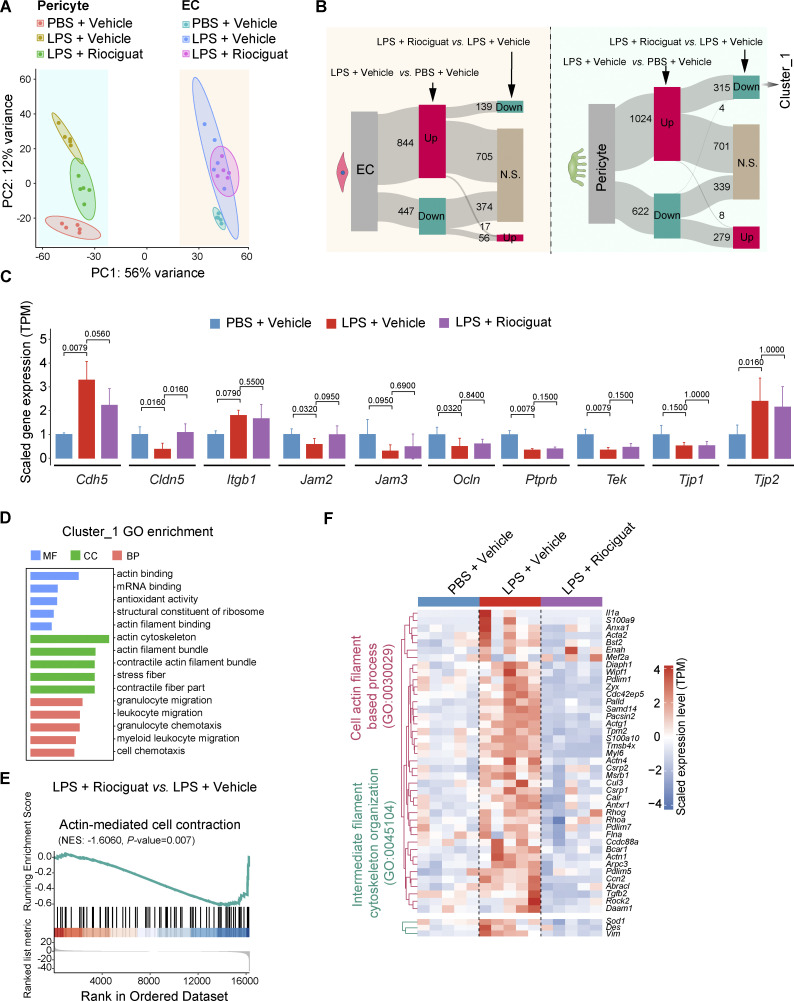
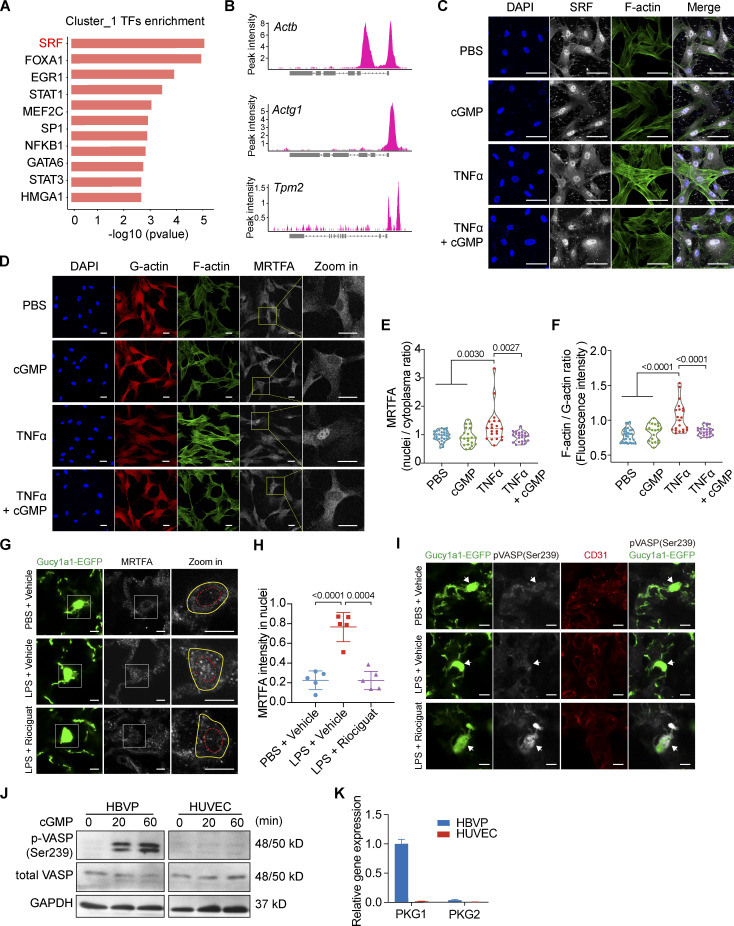
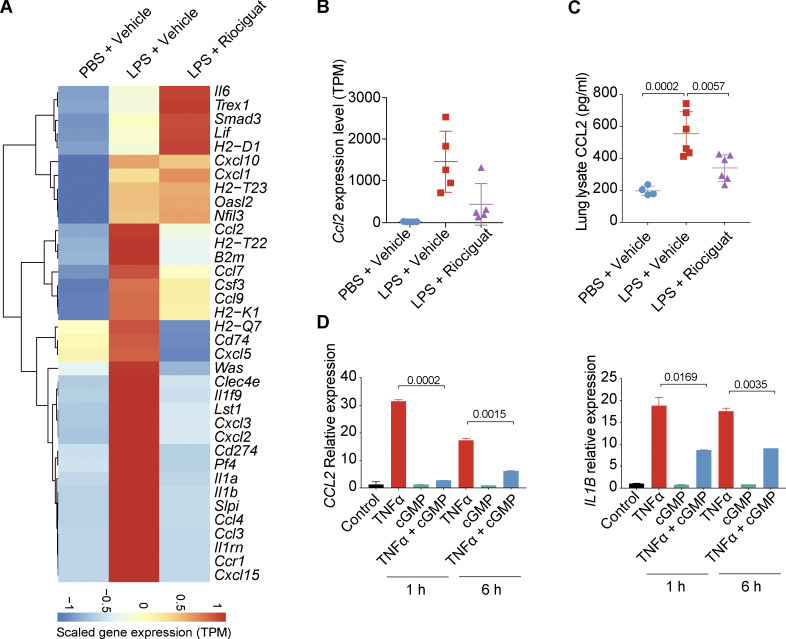
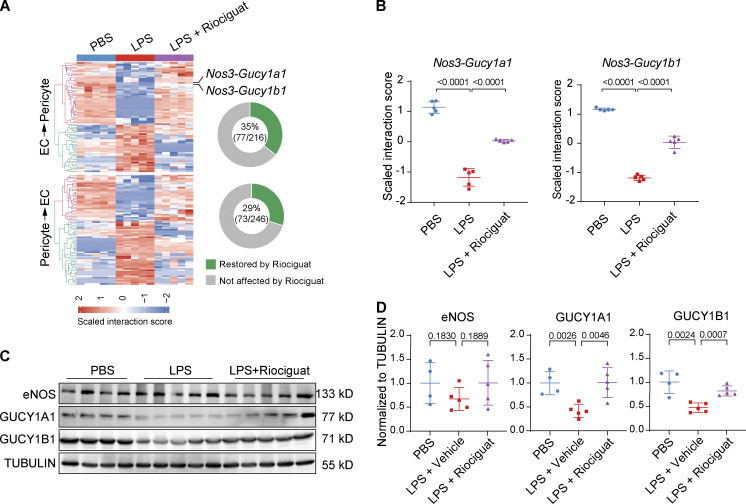
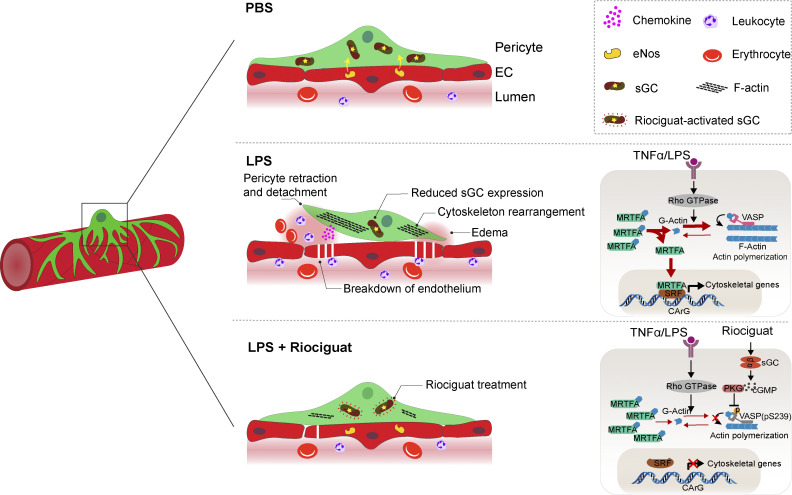
Disruption of endothelial cell (ECs) and pericytes interactions results in vascular leakage in acute lung injury (ALI). However, molecular signals mediating EC-pericyte crosstalk have not been systemically investigated, and whether targeting such crosstalk could be adopted to combat ALI remains elusive. Using comparative genome-wide EC-pericyte crosstalk analysis of healthy and LPS-challenged lungs, we discovered that crosstalk between endothelial nitric oxide and pericyte soluble guanylate cyclase (NO-sGC) is impaired in ALI. Indeed, stimulating the NO-sGC pathway promotes vascular integrity and reduces lung edema and inflammation-induced lung injury, while pericyte-specific sGC knockout abolishes this protective effect. Mechanistically, sGC activation suppresses cytoskeleton rearrangement in pericytes through inhibiting VASP-dependent F-actin formation and MRTFA/SRF-dependent de novo synthesis of genes associated with cytoskeleton rearrangement, thereby leading to the stabilization of EC-pericyte interactions. Collectively, our data demonstrate that impaired NO-sGC crosstalk in the vascular niche results in elevated vascular permeability, and pharmacological activation of this crosstalk represents a promising translational therapy for ALI.


Conflict of interest statement

Disclosures: The authors declare no competing interests exist.

Figures

Figure 1.
Figure 1.
Comparative EC–pericyte crosstalk analysis during LPS-induced lung injury. (A) Schematic illustration depicting the workflow for constructing a reference EC–pericyte crosstalk landscape of a healthy mouse lung. The right panel shows the composition of the cell–cell interaction database. (B) Circos plots showing 677 EC–pericyte and 681 pericyte–EC interactions that were identified in healthy lungs. (C) Enrichment network analysis of EC–pericyte interactions. (D) Volcano plots show the DEGs in ECs and pericytes of LPS-instilled lungs compared with healthy lungs. (E) GO biological process analysis of the DEGs shown in D. Shown are the top five most upregulated and most downregulated pathways in ECs and pericytes. (F) Heatmap showing the dysregulated EC–pericyte and pericyte–EC interaction pairs in the lungs of ALI mice compared to healthy controls. (G) GO biological process analysis of the LPS-dysregulated EC–pericyte interactions (n = 6 mice per group).
Figure S1.
Figure S1.
Isolation and RNA-seq analysis of ECs and pericytes from the lungs of healthy and LPS-instilled Pdgfrb-EGFP mice. (A) Fluorescent images showing the morphology of EGFP-positive pericytes in the lungs of a Pdgfrb-EGFP mouse. Lung sections were co-stained with EC-specific marker CD31. Scale bar: 10 μm. (B) FACS gating strategy for the isolation of ECs and pericytes from Pdgfrb-EGFP mice. (C) Heatmap illustrating the row-normalized expression of EC- and pericyte-specific markers (n = 6 mice per group). (D) FACS quantification of the percentage of pericytes (EGFP+) and vSMCs (EGFP+tdTomato+) in the lungs of Pdgfrb-EGFP::SM22a-CreERT2::Rosa26-tdTomato mice. (E) Schematic illustration depicting the workflow for EC and pericyte isolation, RNA-seq, and interactome analysis. (F) PCA of the DEGs in ECs and pericytes isolated from the lungs of control or LPS-instilled Pdgfrb-EGFP mice (n = 6 mice per group).
Figure 2.
Figure 2.
eNOS–sGC is the most significantly downregulated EC–pericyte interaction in the lungs of ALI mice. (A) Plot showing the top 10 most significantly upregulated and the top 10 most significantly downregulated EC–pericyte interactions after LPS treatment. The dot size reflects the adjusted P value. (B) Schematic diagram showing the intercellular eNOS-NO–sGC signaling. (C) Plot showing the TPM values of Nos3, Gucy1a1, and Gucy1b1 in ECs and pericytes isolated from control and LPS-treated lungs. Data are presented as mean ± SD, n = 6 mice per group. (D) qPCR validation of Nos3, Gucy1a1, and Gucy1b1 expression in the lung of control and ALI mice. Data are presented as mean ± SD, n = 4–5 mice per group. (E) Protein levels of eNOS, p-eNOSSer1177, GUCY1A1, and GUCY1B1 in PBS- or LPS-treated lungs were analyzed with immunoblotting. (F) The kinetics of Gucy1a1 and Gucy1b1 mRNA levels in LPS-instilled lungs was measured using qPCR. Data are presented as mean ± SD, n = 4–5 mice per group. (G) Protein levels of GUCY1A1 and GUCY1B1 in the lungs after LPS instillation at the indicated time were evaluated using immunoblotting. (H) Lung sections of Gucy1a1-EGFP::Tek-Cre::Rosa26-tdTomato mice were stained with GUCY1A1 antibody, showing that EGFP expression is colocalized with the endogenous GUCY1A1. Scale bar: 10 μm. (I) The morphology of EGFP + pericytes in the lung of a Gucy1a1-EGFP mouse. The lung is co-stained with CD31 to show the alveolar vasculature. Arrows indicate the cell body and arrowheads indicate pericyte cellular processes. Scale bar: 20 μm. (J) Lung sections of Gucy1a1-EGFP::Tek-Cre::Rosa26-tdTomato mice were stained with the vascular-specific marker eNOS and the pericyte-specific markers PDGFRβ, NG2, and Desmin. Scale bar: 10 μm. Statistical significance was determined by two-tailed Student’s t test (D) or one-way ANOVA with Tukey test (F). Source data are available for this figure: SourceData F2.
Figure S2.
Figure S2.
Gucy1a1-EGFP is highly expressed in the pericytes of multiple organs. (A) Representative immunofluorescent images of lung sections of Gucy1a1-EGFP mice co-stained with EC-specific marker CD31 and type-I (PODOPLANIN + or AQUAPORIN5+) or type-II alveolar epithelial cells (SFTPC+). Scale bar: 25 μm. (B) Representative fluorescent images showing the EGFP and tdTomato expression pattern in brain, liver, heart, muscle, skin, and white adipose tissue (WAT) of Gucy1a1-EGFP::Tek-Cre::Rosa26-tdTomato mice, with EGFP-labeled pericytes and tdTomato-labeled ECs. Scale bar: 50 μm. (C) Representative images of lung sections of Gucy1a1-EGFP mice stained with EC-specific CD31 and SMC-specific α-SMA antibodies. EGFP was expressed at very low levels in vSMCs in the lung. Scale bar: 50 μm. (D) Plots depicting TPM values of Gucy1a1, Gucy1b1, Myh11, and Acta2 in pericytes and vSMCs isolated from Gucy1a1-EGFP::SM22a- CreERT2::ROSA26-tdTomato mice. Data are presented as mean ± SD, n = 3 mice. (E) Lung single-cell RNA-seq data showing the Gucy1a1 and Gucy1b1 expression levels in various lung cell types (Vanlandewijck et al., 2018).
Figure 3.
Figure 3.
Activating NO–sGC signaling protects lungs from LPS-induced injury. (A) Schematic illustration depicting the Riociguat treatment regimen in an ALI model. E.B.: Evans blue. (B) Images of the Evans blue–perfused lungs of control, LPS-treated, and LPS + Riociguat–treated mice. Scale bar: 5 mm. (C) Quantification of leaked Evans blue in the lungs and the lung weight/body weight ratio. Data are presented as mean ± SD, n = 6–7 mice. (D) Representative images of H&E stained lung sections of control, LPS-treated, and LPS + Riociguat–treated mice. The thickening of the alveolar septa was observed in LPS-treated lungs, which was reversed by Riociguat treatment. Scale bar: 100 μm. (E) Representative images of Ter119 (erythrocyte), GR1 (neutrophil), and CD31 (EC) stained lung sections. Scale bar: 100 μm. (F) Quantification of the extravasated erythrocytes and neutrophils per field of view (FOV). Data are presented as mean ± SD, n = 6 mice. (G) Plots showing the percentage of infiltrated neutrophils (CD11b+Ly6G+) and monocytes (CD11b+Ly6C+) in the lungs of control, LPS-treated, and LPS + Riociguat–treated mice. Data are shown as mean ± SD, n = 6–7 mice per group. (H) FACS quantification of total infiltrated cells and neutrophils in the bronchoalveolar lavage (BAL) fluid from the lungs of control, LPS-treated, and LPS + Riociguat–treated mice. Data are shown as mean ± SD, n = 6–7 mice per group. (I) Heatmap showing the DEGs of whole lung lysates from mice treated with PBS, LPS + vehicle, and LPS + Riociguat. The right panel shows the top five enriched GO biological process items. (J) qPCR validation of the expression of selected inflammatory cytokines in the whole lung lysates of control, LPS-treated, or LPS + Riociguat–treated mice. Data are presented as mean ± SD, n = 3 mice. Statistical significance was determined by one-way ANOVA with Tukey test (C, F, G, H, and J).
Figure S3.
Figure S3.
Riociguat does not affect lung function in healthy mice. (A) Schematic illustration depicting the Riociguat treatment regimen in WT mice. E.B.: Evans blue. (B) Macro images of lungs isolated from PBS- or Riociguat-treated mice that received Evans blue dye infusion before sacrifice. Scale bar: 5 mm. (C) Quantification of lung weight/body weight ratio and the remaining amount of Evans blue in the lungs of PBS- or Riociguat-treated WT mice. Data are shown as the mean ± SD, n = 5 mice per group. (D) Representative images showing the H&E stained lung sections of PBS- or Riociguat-treated mice. Scale bar: 100 μm. (E) Representative immunofluorescence images showing the lung sections of PBS- or Riociguat-treated mice that were stained with DAPI (nuclei), Ter119 (erythrocyte), and CD31 (EC). Scale bar: 50 μm. (F) Quantification showing Ter119 stained erythrocyte number in the lung sections. (G) Volcano plot showing the DEGs in the Riociguat-treated lungs compared to controls. (H) Heatmap showing the individual DEGs in the Riociguat-treated lungs vs control lungs. (I) Dot plot showing the blood pressure of mice received PBS + vehicle, LPS + vehicle, or LPS + Riociguat treatment. Data are shown as the mean ± SD, n = 5–6 mice per group. Statistical significance was determined by two-tailed Student’s t test (C and F) or one-way ANOVA with Tukey test (I). P < 0.05 was considered statistically significant.
Figure 4.
Figure 4.
Pericyte-specific sGC deletion abrogates Riociguat's therapeutic effect. (A) Schematic diagram depicting the conditional inactivation of sGC signaling by Cre mediated deletion of exon7-8 of Gucy1b1. (B) Schematic illustration depicting the Riociguat treatment in the PBS/LPS instilled Gucy1b1flox/flox (sGCCtr) and Cspg4-CreERT2::Gucy1b1flox/flox (sGCΔPC, pericyte-specific sGC inactivation). E.B.: Evans blue. (C) qPCR validation of the Gucy1a1 and Gucy1b1 mRNA levels in the lungs of sGCCtr and sGCΔPC mice. Data are presented as mean ± SD, n = 5 mice per group. (D) Western blot of GUCY1A1 and GUCY1B1 protein levels in the lungs of sGCCtr and sGCΔPC mice. (E) Macro images of the lungs of Evans blue–perfused sGCCtr and sGCΔPC mice treated with PBS, LPS, or LPS + Riociguat. Scale bar: 5 mm. (F) Quantification of the amount of leaked Evans blue in the lungs and the lung weight/body weight ratio of sGCCtr and sGCΔPC mice treated with PBS, LPS, or LPS + Riociguat. Data are presented as mean ± SD, n = 7 mice. (G) Representative images of H&E stained lung sections of sGCCtr and sGCΔPC mice treated with PBS, LPS, or LPS + Riociguat. Scale bar: 100 μm. (H) Representative fluorescence images showing CD31 and TER119 stained lung sections of sGCCtr and sGCΔPC mice treated with PBS + vehicle, LPS + vehicle, or LPS + Riociguat. Scale bar: 20 μm. (I) Quantification of TER119-positive erythrocytes in the lung section per FOV. Data are presented as mean ± SD, n = 3 mice. (J) Representative fluorescence images showing CD31 and GR1 stained lung sections of sGCCtr and sGCΔPC mice treated with PBS + vehicle, LPS + vehicle, or LPS + Riociguat. Scale bar: 20 μm. (K) Quantification of GR1-positive neutrophils in the lung section per FOV. Data are presented as mean ± SD, n = 3 mice. Statistical significance was determined by two-tailed Student’s t test (C) or one-way ANOVA with Tukey test (F, I, and K). Source data are available for this figure: SourceData F4.
Figure S4.
Figure S4.
vSMC- or platelet-specific sGC inactivation does not abolish Riociguat’s lung protection effects. (A) Schematic illustration depicting the Riociguat treatment in the Gucy1b1flox/fox (sGCCtr) and SM22α-CreERT2::Gucy1b1flox/fox (sGCΔSMC) mice received intratracheal PBS/LPS instillation. E.B.: Evans blue. (B) qPCR analysis of Gucy1b1 relative expression levels in the arteries of sGCCtr and sGCΔSMC mice. Data are shown as the mean ± SD, n = 4–5 mice. (C) Macro images of the lungs of Evans blue–perfused sGCCtr and sGCΔSMC mice treated with PBS + vehicle, LPS + vehicle, or LPS + Riociguat. Scale bar: 5 mm. (D) Quantification of the remaining amount of Evans blue in the lungs of PBS + vehicle–, LPS + vehicle–, or LPS + Riociguat–treated sGCCtr and sGCΔSMC mice. Data are shown as the mean ± SD, n = 4–6 mice per group. (E) Representative images showing the H&E stained lung sections of PBS + vehicle–, LPS + vehicle–, or LPS + Riociguat–treated sGCCtr and sGCΔSMC mice. Scale bar: 100 μm. (F) Representative fluorescence images showing CD31 and TER119 stained lung sections of sGCCtr and sGCΔSMC mice treated with PBS + vehicle, LPS + vehicle, or LPS + Riociguat and quantification of TER119-positive erythrocytes in the lung section per FOV. Scale bar: 20 μm. Data are shown as the mean ± SD, n = 3 mice. (G) Representative fluorescence images showing CD31 and GR1 stained lung sections of sGCCtr and sGCΔSMC mice treated with PBS + vehicle, LPS + vehicle, or LPS + Riociguat and quantification of GR1-positive neutrophils in the lung section per FOV. Scale bar: 20 μm. Data are shown as the mean ± SD, n = 3 mice. (H) FACS analysis of the blood of Gucy1a1-EGFP mice reveals that EGFP was expressed in platelets. The blood of WT mice served as negative control. (I) Schematic illustration depicting the Riociguat treatment in the PBS/LPS instilled Pf4-Cre::Gucy1b1flox/flox (sGCΔPL, platelet-specific sGC inactivation) mice. (J) Macro images of the lungs of Evans blue–perfused sGCΔPL mice treated with PBS + vehicle, LPS + vehicle, or LPS + Riociguat. Scale bar: 5 mm. (K) Quantification of leaked Evans blue in the lungs and the lung weight/body weight ratio of sGCΔPL mice treated with PBS + vehicle, LPS + vehicle, or LPS + Riociguat. Data are shown as the mean ± SD, n = 6–7 mice. Statistical significance was determined by two-tailed Student’s t test (B) or one-way ANOVA with Tukey test (D, F, G, and K). P < 0.05 was considered statistically significant.
Figure 5.
Figure 5.
Activating pericyte sGC signaling improves vascular integrity in vitro. (A) Schematic illustration depicting the microfluidic chip–based vascular leakage assay. After the vascular network was formed, FITC-microbeads were perfused into the vascular network; the leakage of the FITC-microbeads was monitored and quantified. (B) Plot showing the TPM value of Tnfrsf1a and Tlr4 in mouse lung pericytes. Data are presented as mean ± SD, n = 6 mice per group. (C) qPCR analysis of TNFRSF1A and TLR4 relative expression levels in HBVP. Data are presented as mean ± SD, n = 3 biological replicates. (D) Dot plots depicting the relative expression levels of CCL2, CCL5, IL1b, and IL6 in pericytes upon LPS or TNFα treatment. Data are presented as mean ± SD, n = 3 biological replicates. (E) Representative fluorescent images showing the fluorescence intensity of the leaked FITC-microbeads outside of the capillaries at 30 min after FITC-microbeads perfusion. Scale bar: 20 μm. (F) The quantification of FITC fluorescence intensity indicating vascular leakage. The data are shown as a smooth-fitting line with SE (95% confidence interval); n = 30 points from 3 chips. Statistical significance was determined using two-way ANOVA. (G) Representative images of the lumenized vascular network formed by HUVEC and HBVP (lenti-EGFP–labeled) in microfluidic chips. The pericytes exhibited dramatic morphological changes and detached from the endothelium 48 h after TNFα treatment. 8-Br-cGMP suppressed pericyte TNFα-induced detachment and promoted the formation of pericyte cellular processes. Arrowheads indicate pericyte cellular processes and the asterisk indicates the detached pericyte. Scale bar: 50 μm. Statistical significance was determined by two-tailed Student’s t test (B and C) or one-way ANOVA with Tukey test (D).
Figure 6.
Figure 6.
Morphological analysis of alveolar capillaries. (A) Representative electron micrographs of intact and impaired endothelial junctions. The percentages of impaired endothelial junctions in the alveolar capillaries of control, LPS-treated, or LPS + Riociguat–treated mice were quantified. Scale bar: 0.5 μm. The data are presented as mean ± SD, n = 9 sections from three mice. Statistical significance was determined by the Kruskal–Wallis test. (B) Representative electron micrograph of caveolae in alveolar endothelium. The number of endothelial caveolae in the alveolar capillaries of control, LPS-treated, or LPS + Riociguat–treated mice were quantified. Scale bar: 0.5 μm. Data are presented as mean ± SD, n = 9 sections from three mice. Statistical significance was determined by the Kruskal–Wallis test. (C) Representative electron micrographs of intact and disrupted alveolar endothelium with small or large lesions. Pseudocolors highlight EC (red) and basement membrane (green). Arrowheads indicate the breakdown of the endothelium. Scale bar: 1 μm. Data are presented as mean ± SD, n = 9 sections from three mice. Statistics were performed using the Kruskal–Wallis test. (D) Representative electron micrographs showing the normal and detached pericyte cellular process over the endothelium. Pseudocolors highlight EC (red), basement membrane (green), and pericyte (blue). Arrowhead indicate a detached pericyte. Scale bar: 0.5 μm. Data are presented as mean ± SD, n = 9 sections from three mice. Statistics were performed using the Kruskal–Wallis test. (E) 3D reconstructed images of lung sections of Gucy1a1-EGFP::Tek-Cre::Rosa26-tdTomato mice treated with control, LPS, or LPS + Riociguat. Pericytes were labeled with EGFP, and ECs were labeled with tdTomato. Riociguat treatment rescues LPS-induced reduction of pericyte coverage. Scale bar: 5 μm. (F) Top panels are representative lung images of sparse-labeled Cspg4-CreERT2::Rosa26-tdTomato mice with PBS, LPS, or LPS + Riociguat treatment. Lower panels showing the 3D skeletonized pericytes with primary cytoplasmic processes and secondary cytoplasmic processes coded with red and blue, respectively. Scale bar: 20 μm. Violin plots showing the quantification of the mean length of primary and secondary cellular processes. Riociguat treatment suppressed LPS-induced cellular process retraction. Arrowheads indicate pericyte cytoplasmic processes. n = 20–30 sections from three mice. Statistical significance was determined by one-way ANOVA with Tukey test.
Figure 7.
Figure 7.
sGC activation suppresses the expression of cytoskeletal genes in pericytes. (A) PCA plot of gene expression in the ECs and pericytes of ALI mice showing that Riociguat treatment caused a dramatic gene expression shift in pericytes but not in ECs (n = 5 mice). (B) Sankey plot showing the number of DEGs in lung EC upon LPS and LPS + Riociguat treatment (n = 5 mice per group). Sankey plot showing the number of DEGs in lung pericytes upon LPS and LPS + Riociguat treatment (n = 5 mice per group). (C) Bar plot shows minor changes of genes involved in endothelial junction formation in the alveolar ECs of PBS + vehicle−, LPS + vehicle−, and LPS + Riociguat–treated mice. Data are presented as mean ± SD, n = 5 mice. Statistical significance was determined by one-way ANOVA with Tukey test. (D) GO analysis of the Riociguat-reversed DEGs in pericytes (Cluster_1). Subsets of GO, BP (biological processes), MF (molecular functions), and CC (cellular components) were used for analysis. The enrichment results were ranked by −log10 (p.adjust); only the top 10 items are displayed. (E) GSEA reveals that the gene signature of actin-mediated cell contraction in pericytes was upregulated by LPS; this could be suppressed by Riociguat treatment. NES, normalized enrichment score. Genes were pre-ranked by −log10 (p.adjust). (F) Heatmap showing that Riociguat reversed the expression of LPS-upregulated cytoskeleton rearrangement-associated genes.
Figure 8.
Figure 8.
NO–sGC signaling stabilizes pericyte activation by inhibiting VASP- and MRTFA/SRF-dependent cytoskeleton rearrangement. (A) Over-representative TF enrichment analysis of genes in Cluster_1 using the TRRUST (v2) database. Only the top 10 TFs are displayed. (B) ChIP-seq (SRX3591809) analysis showing the SRF binding site at the promoters of Actb, Actg1, and Tpm2. (C) SRF localization in HBVPs upon TNFα or cGMP treatment was evaluated by immunofluorescence staining. Cells were co-stained with DAPI and phalloidin to visualize the nuclei and F-actin. Scale bar: 50 μm. (D) HBVPs were treated with vehicle, 8-Br-cGMP, TNFα, or TNFα + 8-Br-cGMP for 30 min. HBVPs were then stained with phalloidin for F-actin and antibodies against G-actin and MRTFA. 8-Br-cGMP treatment suppressed F-actin assembly and MRTFA nuclear translocation. Scale bar: 25 μm. (E) Quantification of the nuclei/plasma MRTFA ratio based on fluorescence intensity. Statistical significance was determined by one-way ANOVA with Tukey test. (F) Plot showing the quantification of F-actin/G-actin ratio in HBVPs upon TNFα and 8-Br-cGMP treatment. Statistical significance was determined by one-way ANOVA with Tukey test. (G) MRTFA subcellular localization in PBS + vehicle−, LPS + vehicle−, or LPS + Riociguat–treated lungs of Gucy1a1-EGFP mice were evaluated using immunofluorescence staining. Scale bar: 5 μm. (H) Plot showing the quantification of MRTFA intensity in EGFP + pericyte nuclei of PBS + vehicle−, LPS + vehicle−, or LPS + Riociguat–treated mice. Data are presented as mean ± SD, n = 5 mice. Statistical significance was determined by one-way ANOVA with Tukey test. (I) VASP phosphorylation status in the lung pericytes of Gucy1a1-EGFP mice was evaluated using immunofluorescence staining with a p-VASP(Ser239) antibody. Lung pericytes were labeled with EGFP, and alveolar vessels were stained with CD31. Arrows indicate the cell bodies of GFP-positive pericytes. Scale bar: 5 μm. (J) Western blot of total VASP and phospho-VASP (Ser239) in HUVEC and HBVP by 8-Br-cGMP treatment at the indicated time. (K) qPCR analysis shows PKG1 was the downstream effector of activated sGC in HBVPs, whereas HUVECs lack both PKG1 and PKG2 expression. Source data are available for this figure: SourceData F8.
Figure S5.
Figure S5.
Riociguat suppresses LPS-induced inflammatory cytokine expression in pericytes. (A) Heatmap depicting the differentially expressed inflammatory cytokines in lung pericytes isolated from PBS + vehicle–, LPS + vehicle–, and LPS + Riociguat–treated mice. Data are presented as the mean of each gene expression values of five mice. (B) Plot showing the Ccl2 expression levels (TPM) in lung pericytes isolated from PBS + vehicle–, LPS + vehicle–, and LPS + Riociguat–treated mice. (C) The protein levels of CCL2 in lung lysates of mice received PBS + vehicle, LPS + vehicle, and LPS + Riociguat treatments were measured using ELISA. Data are shown as the mean ± SD, n = 4–6 mice per group. (D) HBVPs were stimulated with TNFα, cGMP, or TNFα + cGMP. The expression levels of CCL2 and IL1B 1 or 6 h after stimulation were determined using qPCR. Data are shown as the mean ± SD. Statistical significance was determined by one-way ANOVA with Tukey test (B–D). P < 0.05 was considered statistically significant.
Figure 9.
Figure 9.
Activating NO–sGC signaling restores EC–pericyte crosstalk. (A) Heatmap showing the LPS-dysregulated EC–pericyte interaction pairs that were reversed by Riociguat treatment. Doughnut charts on the right showing the percentage of Riociguat-reversed interactions among the total LPS-dysregulated interaction pairs. (B) Plot showing the LPS-dysregulated interactions Nos3-Gucy1a1 and Nos3-Gucy1b1 were rescued by Riociguat treatment. Data are presented as mean ± SD, n = 5 mice. (C) The protein levels of eNOS and GUCY1A1 were validated by Western blot analysis. (D) Plots shows the quantification of eNOS, GUCY1A1, and GUCY1B1 normalized to TUBULIN. Data are presented as mean ± SD, n = 4–5 mice. Statistical significance was determined by one-way ANOVA with Tukey test. Source data are available for this figure: SourceData F9.
Figure 10.
Figure 10.
Working model. eNOS–sGC signaling, as a key mediator of EC–pericyte crosstalk, controls vascular integrity. In LPS-induced ALI, the eNOS–sGC crosstalk is significantly reduced, resulting in cytoskeleton rearrangement, pericyte detachment, and elevated chemokine expression. This leads to immune cell infiltration, breakdown of the endothelium, and lung edema. Administration of the sGC stimulator Riociguat is sufficient to stabilize EC–pericyte interaction, promoting vascular integrity and reducing inflammation-induced lung injury.

Similar articles

Cited by

References

    1. Ahluwalia, A., Foster P., Scotland R.S., McLean P.G., Mathur A., Perretti M., Moncada S., and Hobbs A.J.. 2004. Antiinflammatory activity of soluble guanylate cyclase: cGMP-dependent down-regulation of P-selectin expression and leukocyte recruitment. Proc. Natl. Acad. Sci. USA. 101:1386–1391. 10.1073/pnas.0304264101 - DOI - PMC - PubMed
    1. Armulik, A., Genové G., Mäe M., Nisancioglu M.H., Wallgard E., Niaudet C., He L., Norlin J., Lindblom P., Strittmatter K., et al. . 2010. Pericytes regulate the blood-brain barrier. Nature. 468:557–561. 10.1038/nature09522 - DOI - PubMed
    1. Augustin, H.G., Koh G.Y., Thurston G., and Alitalo K.. 2009. Control of vascular morphogenesis and homeostasis through the angiopoietin-Tie system. Nat. Rev. Mol. Cell Biol. 10:165–177. 10.1038/nrm2639 - DOI - PubMed
    1. Becker, E.M., Schmidt P., Schramm M., Schroder H., Walter U., Hoenicka M., Gerzer R., and Stasch J.P.. 2000. The vasodilator-stimulated phosphoprotein (VASP): Target of YC-1 and nitric oxide effects in human and rat platelets. J. Cardiovasc. Pharmacol. 35:390–397. 10.1097/00005344-200003000-00007 - DOI - PubMed
    1. Benz, P.M., Blume C., Seifert S., Wilhelm S., Waschke J., Schuh K., Gertler F., Munzel T., and Renne T.. 2009. Differential VASP phosphorylation controls remodeling of the actin cytoskeleton. J. Cell Sci. 122:3954–3965. 10.1242/jcs.044537 - DOI - PMC - PubMed

Publication types