. 2022 Nov 15;119(46):e2203491119.
doi: 10.1073/pnas.2203491119. Epub 2022 Nov 9.

Integrated gene analyses of de novo variants from 46,612 trios with autism and developmental disorders

Affiliations

Integrated gene analyses of de novo variants from 46,612 trios with autism and developmental disorders

Tianyun Wang et al. Proc Natl Acad Sci U S A. .

Abstract

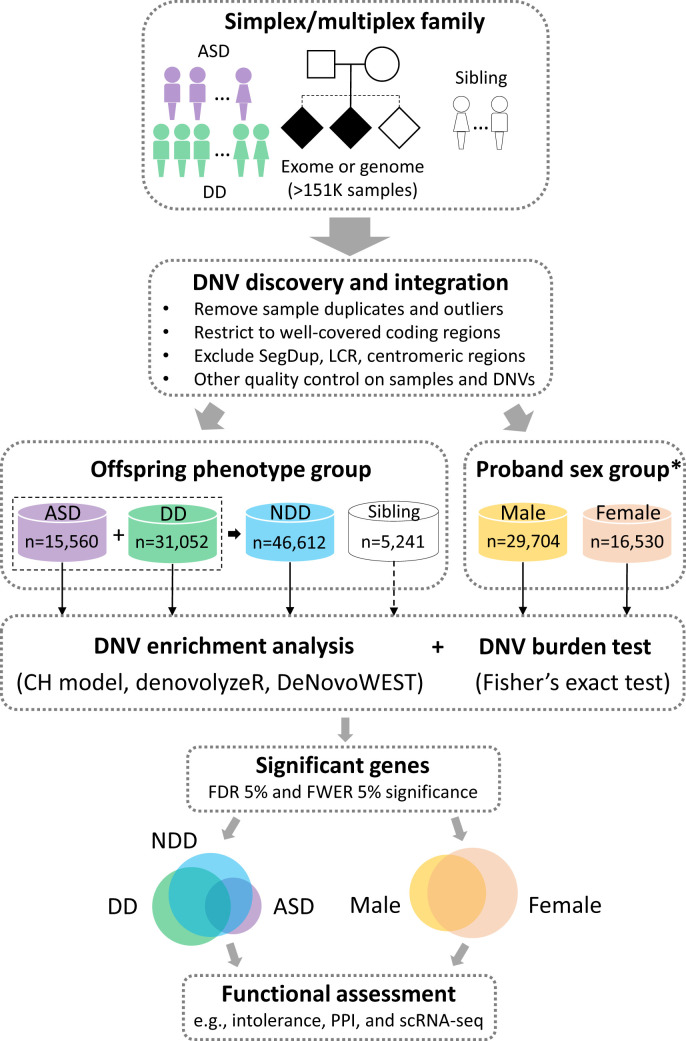
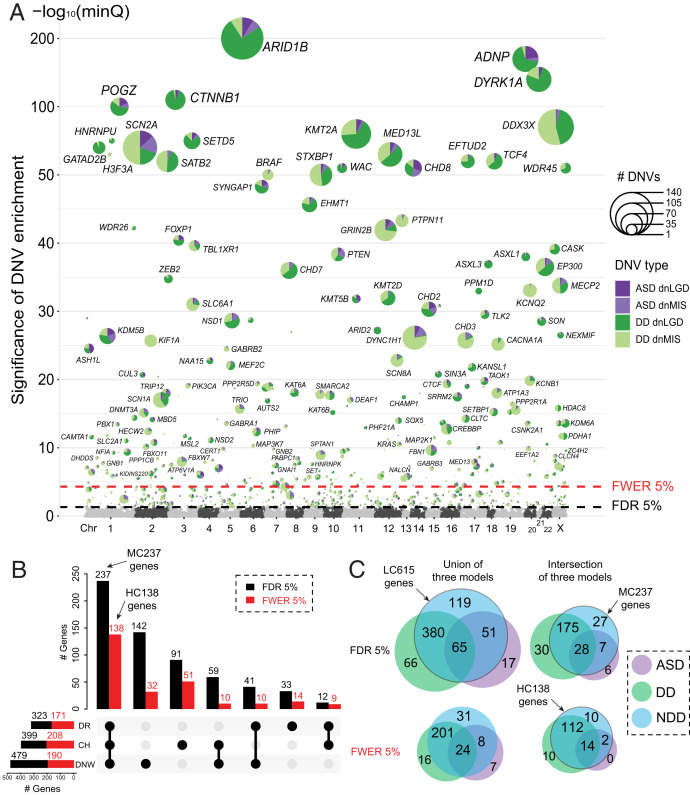
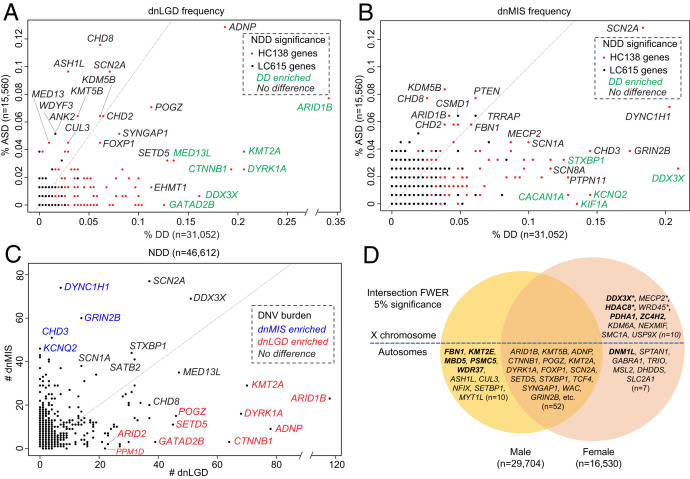
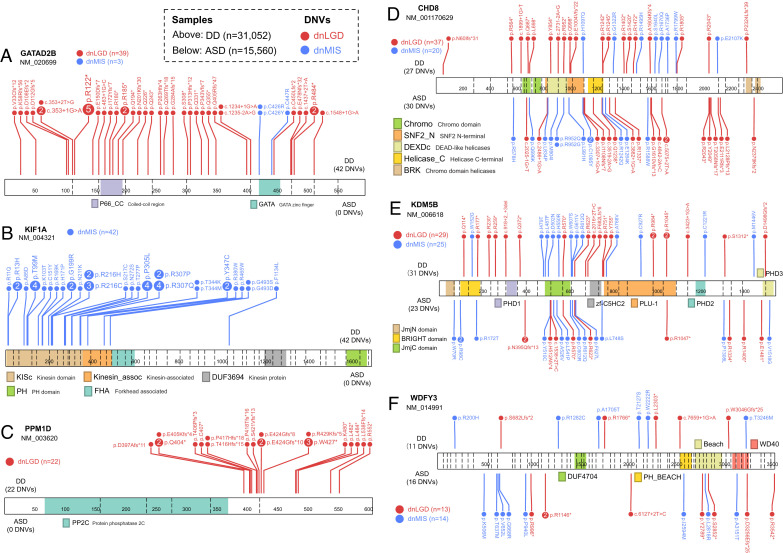
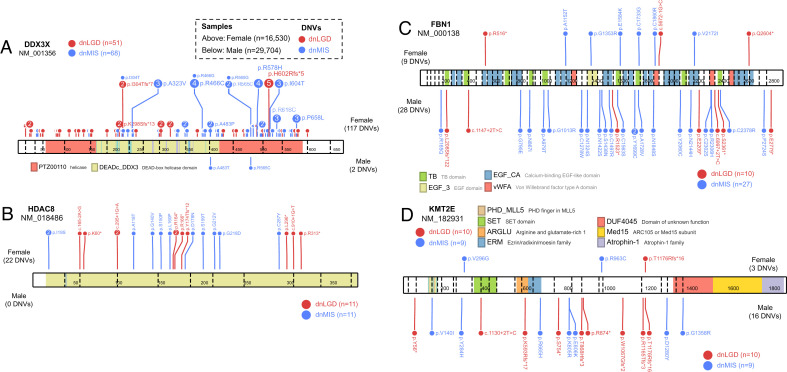
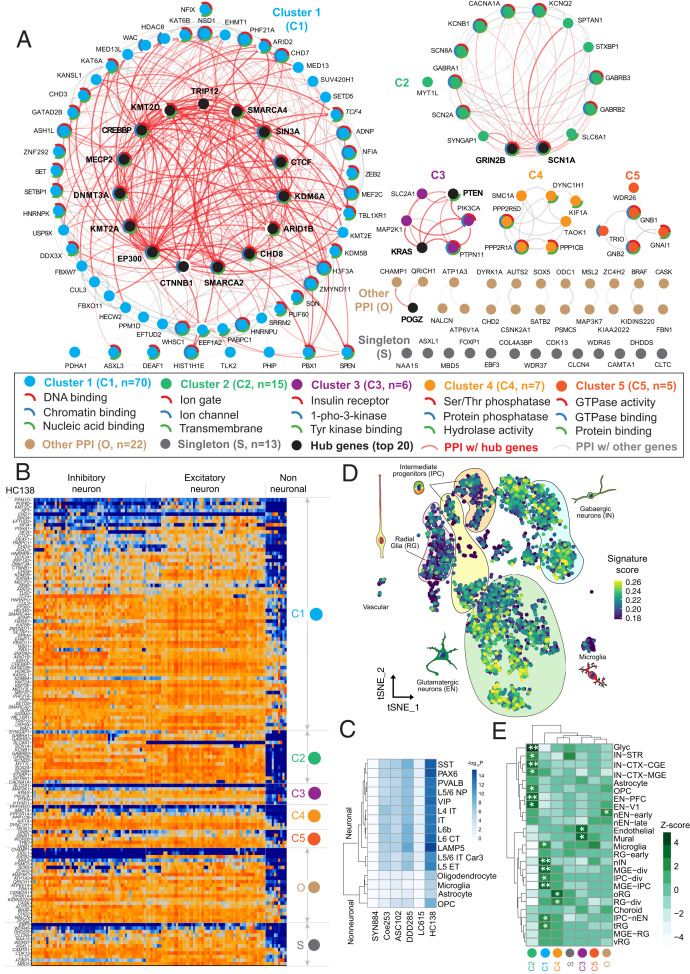
Most genetic studies consider autism spectrum disorder (ASD) and developmental disorder (DD) separately despite overwhelming comorbidity and shared genetic etiology. Here, we analyzed de novo variants (DNVs) from 15,560 ASD (6,557 from SPARK) and 31,052 DD trios independently and also combined as broader neurodevelopmental disorders (NDDs) using three models. We identify 615 NDD candidate genes (false discovery rate [FDR] < 0.05) supported by ≥1 models, including 138 reaching Bonferroni exome-wide significance (P < 3.64e-7) in all models. The genes group into five functional networks associating with different brain developmental lineages based on single-cell nuclei transcriptomic data. We find no evidence for ASD-specific genes in contrast to 18 genes significantly enriched for DD. There are 53 genes that show mutational bias, including enrichments for missense (n = 41) or truncating (n = 12) DNVs. We also find 10 genes with evidence of male- or female-bias enrichment, including 4 X chromosome genes with significant female burden (DDX3X, MECP2, WDR45, and HDAC8). This large-scale integrative analysis identifies candidates and functional subsets of NDD genes.

Keywords: de novo variants; neurodevelopmental disorder; protein–protein interaction; single-nuclei transcriptome.


Conflict of interest statement

Competing interest statement: E.E.E. is a scientific advisory board (SAB) member of Variant Bio, Inc. The other authors declare no competing interests.

Figures

Fig. 1.
Fig. 1.
Study workflow. DNVs from >151,000 samples, including both simplex and multiplex families with a primary diagnosis of ASD or DD, were integrated with strict QC and filtering measures applied (SI Appendix, Supplementary Methods). De novo enrichment analysis was performed independently in ASD (n = 15,560), DD (n = 31,052), and NDD (n = 46,612) groups, and probands with sex information available were grouped by males and females, in parallel using three statistical models (CH model, denovolyzeR, and DeNovoWEST). Siblings were also analyzed using the CH model and denovolyzeR, but not run for DeNovoWEST due to the small sample size (n = 5,241). Significant genes were used for downstream analyses for the identification of risk genes and the comparison between phenotype and sex. *Sex information is available for the majority (99.2%, 46,234/46,612) of the probands. SegDup: segmental duplications; LCR: low-complexity regions.
Fig. 2.
Fig. 2.
De novo enrichment analysis and significant genes by model and phenotype. (A) The smallest q value (minQ) after Benjamini-Hochberg correction of each gene across the three models was plotted in alphabetic order of gene name by chromosome. The LC615 genes reaching union FDR 5% significance were plotted with the number of dnLGD and dnMIS variants in the ASD and DD cohorts scaled in pie charts; the HC138 genes reaching the intersection FWER 5% significance were additionally labeled with gene name. (B) The number of genes reaching FDR 5% (black bar) and FWER 5% (red bar) significance identified by each of the three models (DR: denovolyzeR; CH: CH model; DNW: DeNovoWEST) in the combined NDD set. (C) Cohort overlap among low-confidence (n = 615, FDR 5%) and high-confidence (n = 138 FWER 5%) gene sets considering the ASD and DD cohorts separately and as one group (NDD). Genes were compared based on the union of three models for DNV enrichment versus only those that were observed by all three (intersection).
Fig. 3.
Fig. 3.
Genes with phenotype, variant class, and sex-biased DNV burden. (A) dnLGD and (B) dnMIS variant frequencies in ASD (y axis) and DD (x axis) patients were plotted for all LC615 genes in the combined NDD group, with the HC138 genes in red and others in black dots. Genes with enriched DNVs in DD over ASD patients were in green. (C) Number of dnLGD and dnMIS variants for all genes with DNVs in the combined NDD group. Example genes with significant burden of dnLGD (red) or dnMIS (blue) variants compared to the other variant class are labeled with gene name in color. (D) Genes with potential sex bias. Males and females were treated as two separate groups and genes that reached intersection FWER significance (P < 3.64e–7, by all three models) for DNVs in males (Left) and females (Right) as opposed to both sexes (center of Venn diagram). The genes in bold are those with sex-specific significance and without any significance observed in the other sex group. Genes with asterisks are high-confidence candidates with sex-biased DNV enrichment.
Fig. 4.
Fig. 4.
Example genes with variant class and phenotype-specific DNV pattern. Linear protein diagrams are present with size and exons split by vertical dashed lines. Domains are indicated in color blocks with a short description; the total number of dnLGD (red) and dnMIS (blue) variants for each gene was also provided. Recurrent DNVs are indicated by larger circles with the number of recurrences inside. Number of samples plotted: ASD (n = 15,560) and DD (n = 31,052). (A) GATAD2B with DNVs exclusively in DD patients and enriched for dnLGD variants. (B) KIF1A only has dnMIS variants and are exclusively in DD patients. (C) PPM1D only has dnLGD variants and are exclusively in DD patients. (D) CHD8, (E) KDM5B, and (F) WDYF3 have dnLGD and dnMIS variants in both DD and ASD patients, although no phenotype-specific significance, but tend to have more DNVs in ASD than in DD patients when considering the sample size.
Fig. 5.
Fig. 5.
Example genes with sex-biased DNV pattern. Linear protein diagrams are plotted in same way as in Fig. 4. Number of samples plotted: female (n = 16,530) and male (n = 29,704). (A) DDX3X and (B) HDAC8 DNVs are almost exclusively in females and with female-only DNV burden and enrichment significance. (C) FBN1 and (D) KMT2E, while having no sex-biased DNV burden significance, show male-specific DNV enrichment significance and more DNVs in males than females.
Fig. 6.
Fig. 6.
PPI analysis and panneuronal expression of the highest confidence genes. (A) PPI analysis identified five main clusters (C1 to C5), as well as 22 genes in another smaller PPI group (O) and 13 singleton genes (S) using STRING for the HC138 genes with the highest confidence. The top three GO functions were indicated by the pie chart in color (top 1 in red, top 2 in blue, and top 3 in green), if applicable, outside each gene dot with a short name in the legend. We also defined 20 top hub genes (black dot and bolded name) supported by at least half of 12 statistical methods in cytoHubba (37). Red arcs designate PPI with hub genes; gray arcs indicate PPI only between non-hub genes. The degree of the color and the width of the arc indicate the degree of the interaction. (B) Expression heatmap of the HC138 genes in 120 cell types identified across 6 human neocortical areas grouped by PPI clusters with higher expression (orange) and lower expression (blue). The cell types were grouped by transcriptomic similarity, and the major branches correspond to inhibitory and excitatory neurons and nonneuronal cells. Labels on the Right Side indicate clusters based on PPI analysis, and gene names are on the Left Side. (C) Heatmap of −log10-transformed P values (Bonferroni corrected for multiple testing) of a Kolmogorov-Smirnov test for the difference in the expression levels of each gene set (rows) in each cell subtype (columns, full name described in Materials and Methods) compared to a control set of genes (HC138 and LC615 are the gene sets with the HC and LC identified in this study; DDD285 (18), ASC102 (17), and Coe253 (19) are significant genes reported previously; SYN884, the control set, includes 844 genes with dnSYN variants [n > 2] in the 46,612 NDD samples in this study). (D) Gene signature score of the HC138 genes computed per cell. IN: interneurons; EN: excitatory neurons; IPC: intermediate progenitor cells; MGE: medial ganglionic eminence; CGE: caudal ganglionic eminence; OPC: oligodendrocyte progenitor cells; tRG: truncated radial glia; oRG: outer radial glia; vRG: ventral radial glia; CTX: cortex; V1: visual cortex; PFC: prefrontal cortex; STR: striatum. (E) The heatmap shows the SD from the mean expression value of each cluster of genes. Positive values are up-regulated compared to the mean, and negative values are down-regulated compared to the mean. Significance is derived from bootstrapping and labeled with asterisk (*P < 0.05, **FDR P < 0.05 after Benjamini-Hochberg correction). The HC138 genes were used as the background gene set.

References

    1. Zablotsky B., et al. , Prevalence and trends of developmental disabilities among children in the United States: 2009–2017. Pediatrics 144, e20190811 (2019). - PMC - PubMed
    1. First M. B., Diagnostic and statistical manual of mental disorders, 5th edition, and clinical utility. J. Nerv. Ment. Dis. 201, 727–729 (2013). - PubMed
    1. Srivastava A. K., Schwartz C. E., Intellectual disability and autism spectrum disorders: Causal genes and molecular mechanisms. Neurosci. Biobehav. Rev. 46, 161–174 (2014). - PMC - PubMed
    1. Mefford H. C., Batshaw M. L., Hoffman E. P., Genomics, intellectual disability, and autism. N. Engl. J. Med. 366, 733–743 (2012). - PMC - PubMed
    1. Lyall K., et al. , The changing epidemiology of autism spectrum disorders. Annu. Rev. Public Health 38, 81–102 (2017). - PMC - PubMed

Publication types